-
-
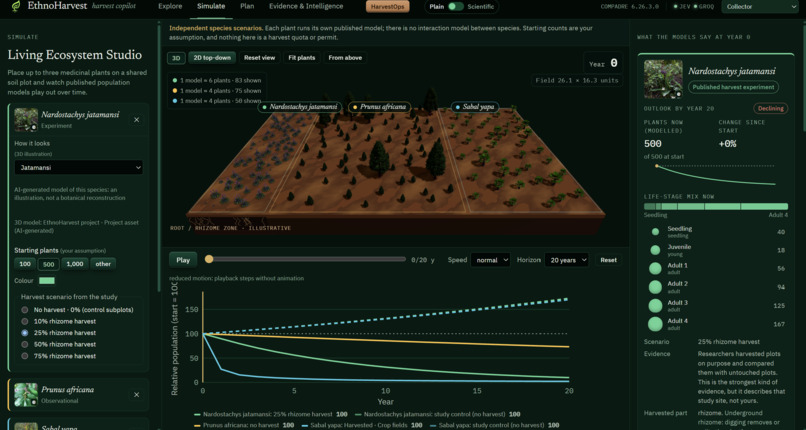
Simulation of population and harvesting
-
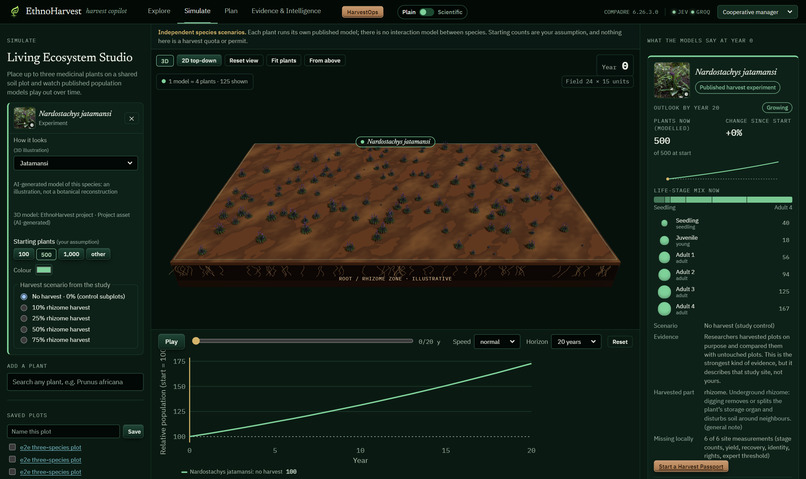
Simulation of population and harvesting
-
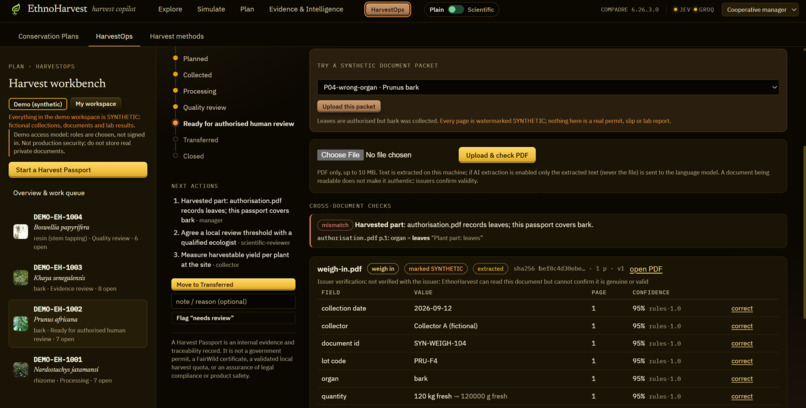
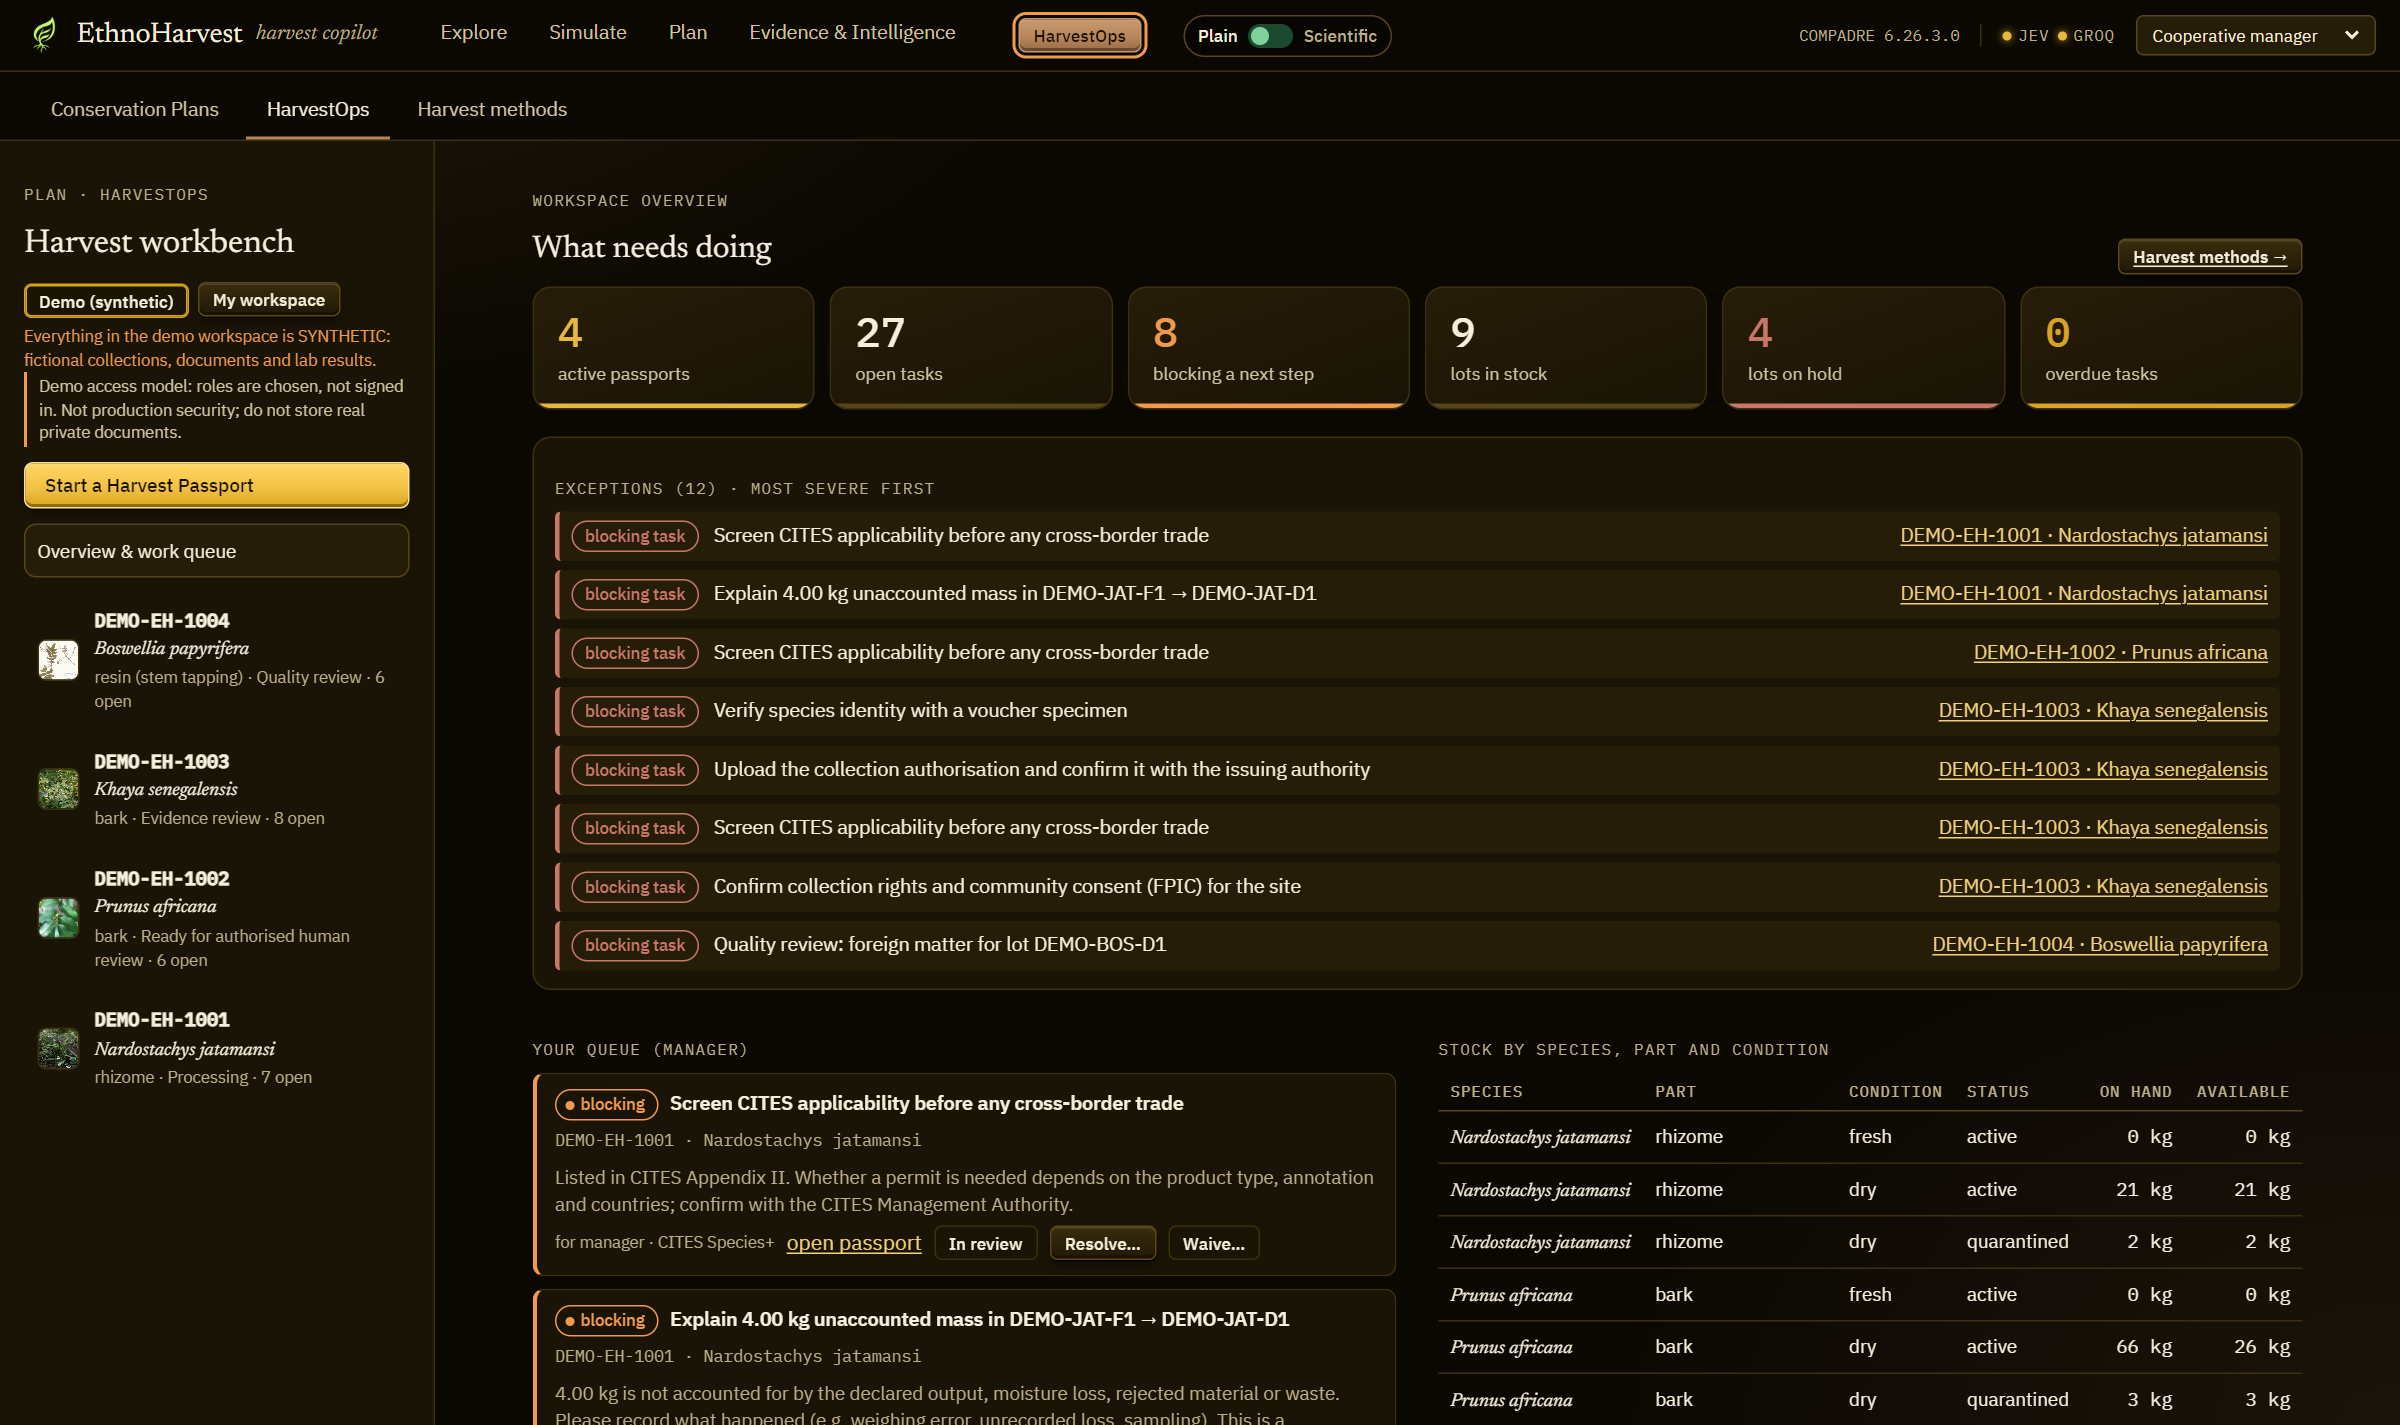
Harvester Workbench
-
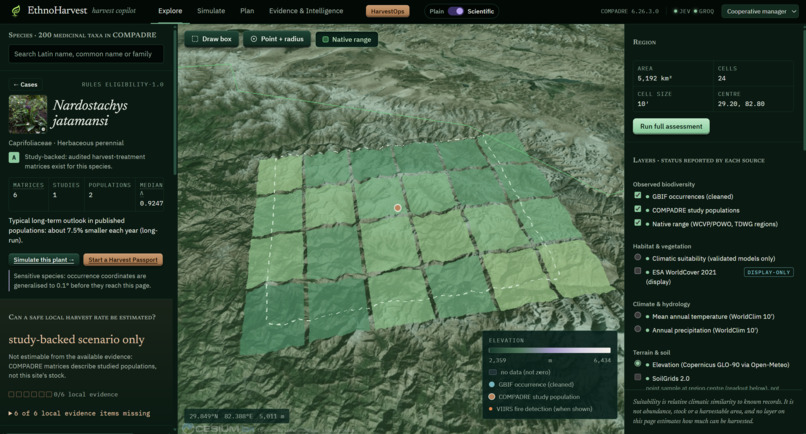
Spatial Data Vis
-
Experiments
-
Harvester Workbench
-
Harvester Workbench
-
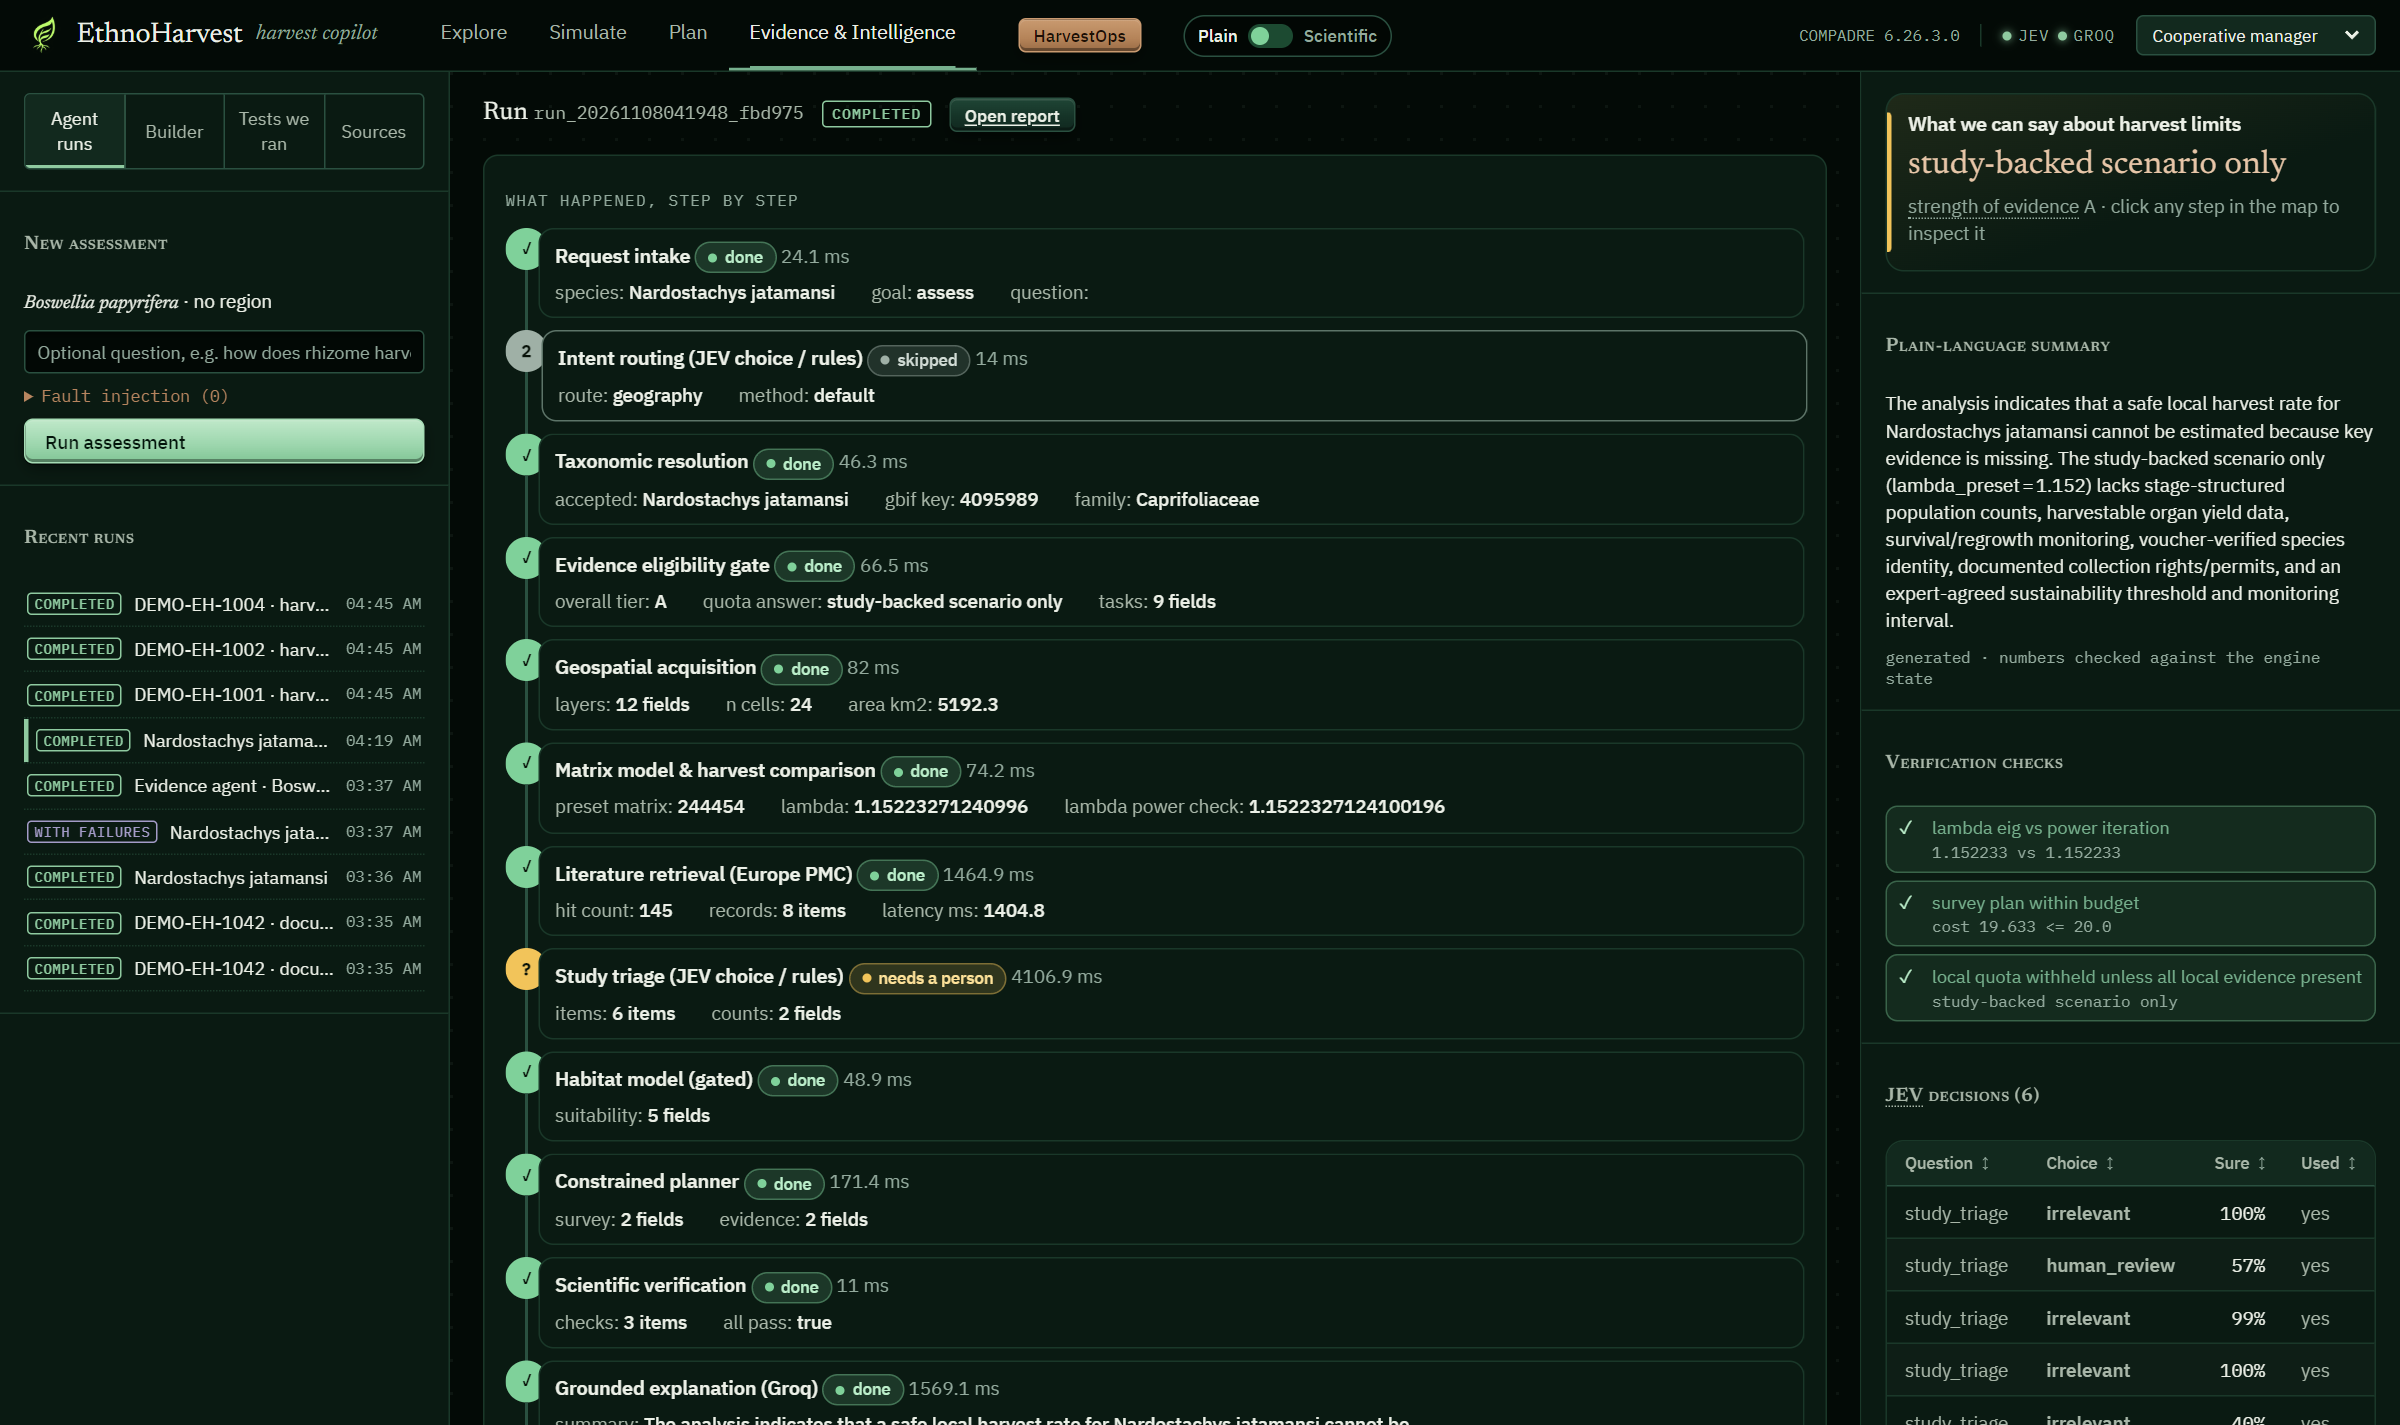
Agentic System
-
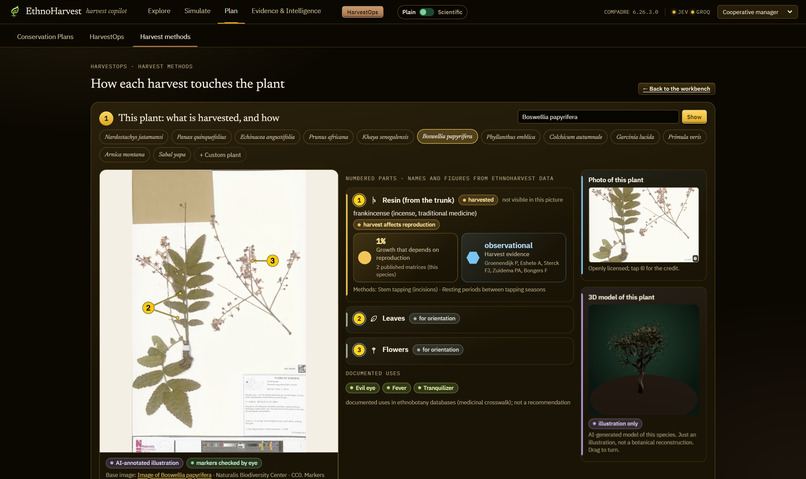
Harvest Data
-
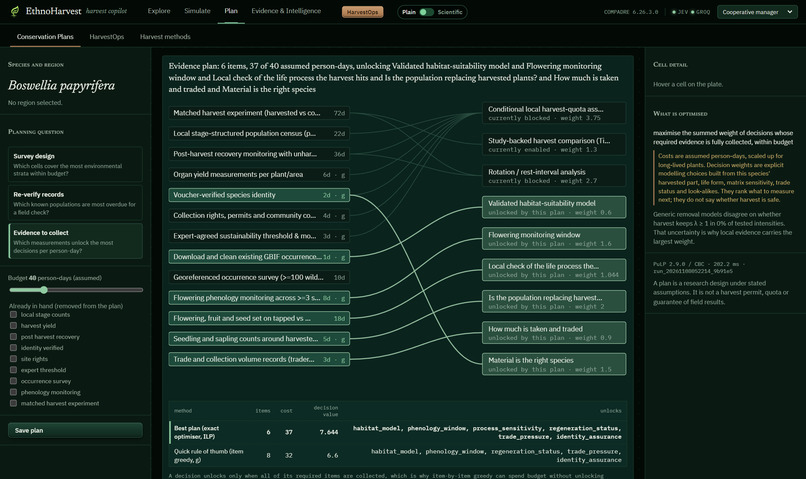
Determinsitc Evidences
-
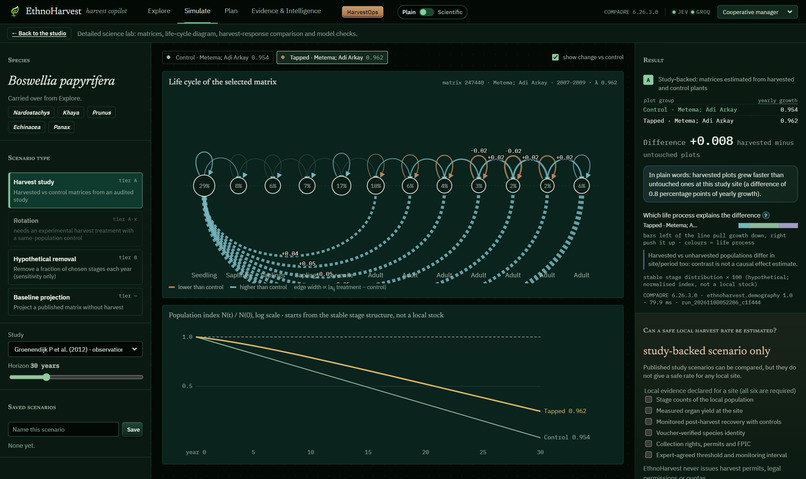
Experiments
EthnoHarvest AI
Evidence before extraction: a harvest copilot for wild medicinal plants
| Team name | Eco Roots |
| Project name | EthnoHarvest AI |
| Title | Evidence before extraction: a harvest copilot for wild medicinal plants |
| Team members | Shruthi and Vishnu |
| Hackathon | EthnoHack 2026 |
| Track | Track 3, Biodiversity and Sustainability |
| Presentation | https://drive.google.com/file/d/1ZmND90TMYBvuDxy3funerlU6loNMi8vz/view?usp=sharing |
| Youtube | https://youtu.be/2VO2N2NWDVI |
| Live frontend demo | https://ethnoharvest.vercel.app |
About the live demo. The Vercel link hosts the frontend only, so judges can explore the interface. The full backend runs the population models, the Kew and World Flora Online name checks, the 1.4 million name checklist index, the spatial layers and the evidence agent. It is too heavy for free hosting limits, so it runs locally. The full end to end system appears in our demo video, and the repository README sets it up with one command.
1. Inspiration: the problem we faced
The world relies on medicinal plants, and most of them are still taken from the wild with almost no local evidence about how much a population can survive losing.
| Number | What it means | Source |
|---|---|---|
| 88 percent | of WHO member states (170 of 194) report that their people use traditional and herbal medicine | WHO Global Report on Traditional and Complementary Medicine 2019 |
| 45 percent | of flowering plants are threatened with extinction | Royal Botanic Gardens Kew, State of the World's Plants and Fungi 2023 |
| 723 | medicinal plant species are threatened with extinction, with overharvesting a major driver | Kew, State of the World's Plants and Fungi 2020 |
| About 3,000 | medicinal and aromatic plant species are in international trade | TRAFFIC and IUCN, Wild at Home, 2018 |
| 60 to 90 percent | of those traded species are harvested from the wild | TRAFFIC and IUCN, 2018 |
| Only 7 percent | of medicinal and aromatic plants with documented uses have been assessed for the IUCN Red List | TRAFFIC and IUCN, 2018 |
| 3 times | growth in international trade value between 1999 and 2015, to over US$3 billion | TRAFFIC and IUCN, 2018 |
| Over US$100 billion | estimated global herbal medicine market (published estimates vary by definition) | Industry market reports, 2024 |
The gap is not a lack of data. Population studies, plant checklists, occurrence records and trade listings all exist. The gap is that a harvesting cooperative cannot join them up. To answer one question honestly ("how much can we take here?") they would need a botanist, a demographer, a GIS analyst and a lawyer. Generic calculators fill the gap with a confident number built on too little data, and a wrong number is worse than no number.
2. Case studies: three plants, three plant parts, one pattern
We anchored the project on three signature plants. Each is harvested for a different part, and each shows the same failure: global demand, no local evidence.
| Jatamansi (Nardostachys jatamansi) | African cherry (Prunus africana) | Frankincense (Boswellia papyrifera) | |
|---|---|---|---|
| Part taken | Rhizome; the whole plant dies | Bark | Resin, by tapping the trunk |
| Where | Nepal Himalaya | Montane Africa (Cameroon, Madagascar and others) | Ethiopia, Eritrea, Sudan |
| Scale of harvest | 100 to 500 tonnes of rhizomes traded each year; traded by some of the more than 300,000 Nepali households involved in medicinal plant trade | 3,225 tonnes of dried bark exported in 1997, the peak year | 21,786 trees studied in 23 populations |
| What is happening | Listed as threatened by IUCN; CITES Appendix II; illegal export reported | CITES Appendix II since 1995; trade suspensions for several countries; wild harvest judged no longer sustainable | 18 of 23 populations had almost no young trees; production projected to halve within 20 years |
| Source | TRAFFIC; Paudel et al. 2023, PNAS Nexus | CITES Plants Committee PC25 Doc 27; Stewart 2003, CIFOR | Bongers et al. 2019, Nature Sustainability 2:602 |
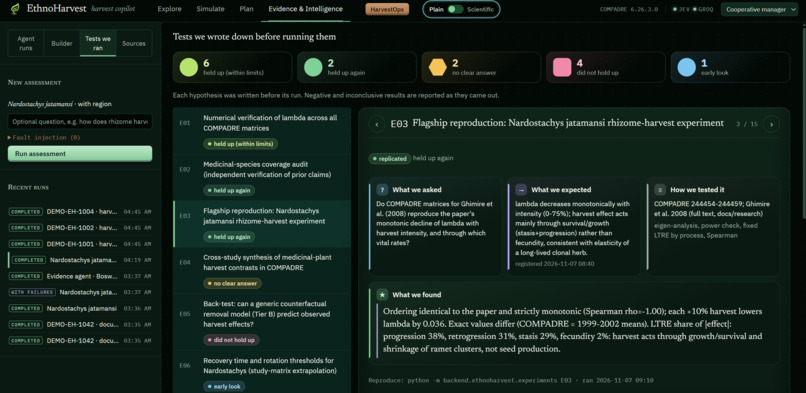
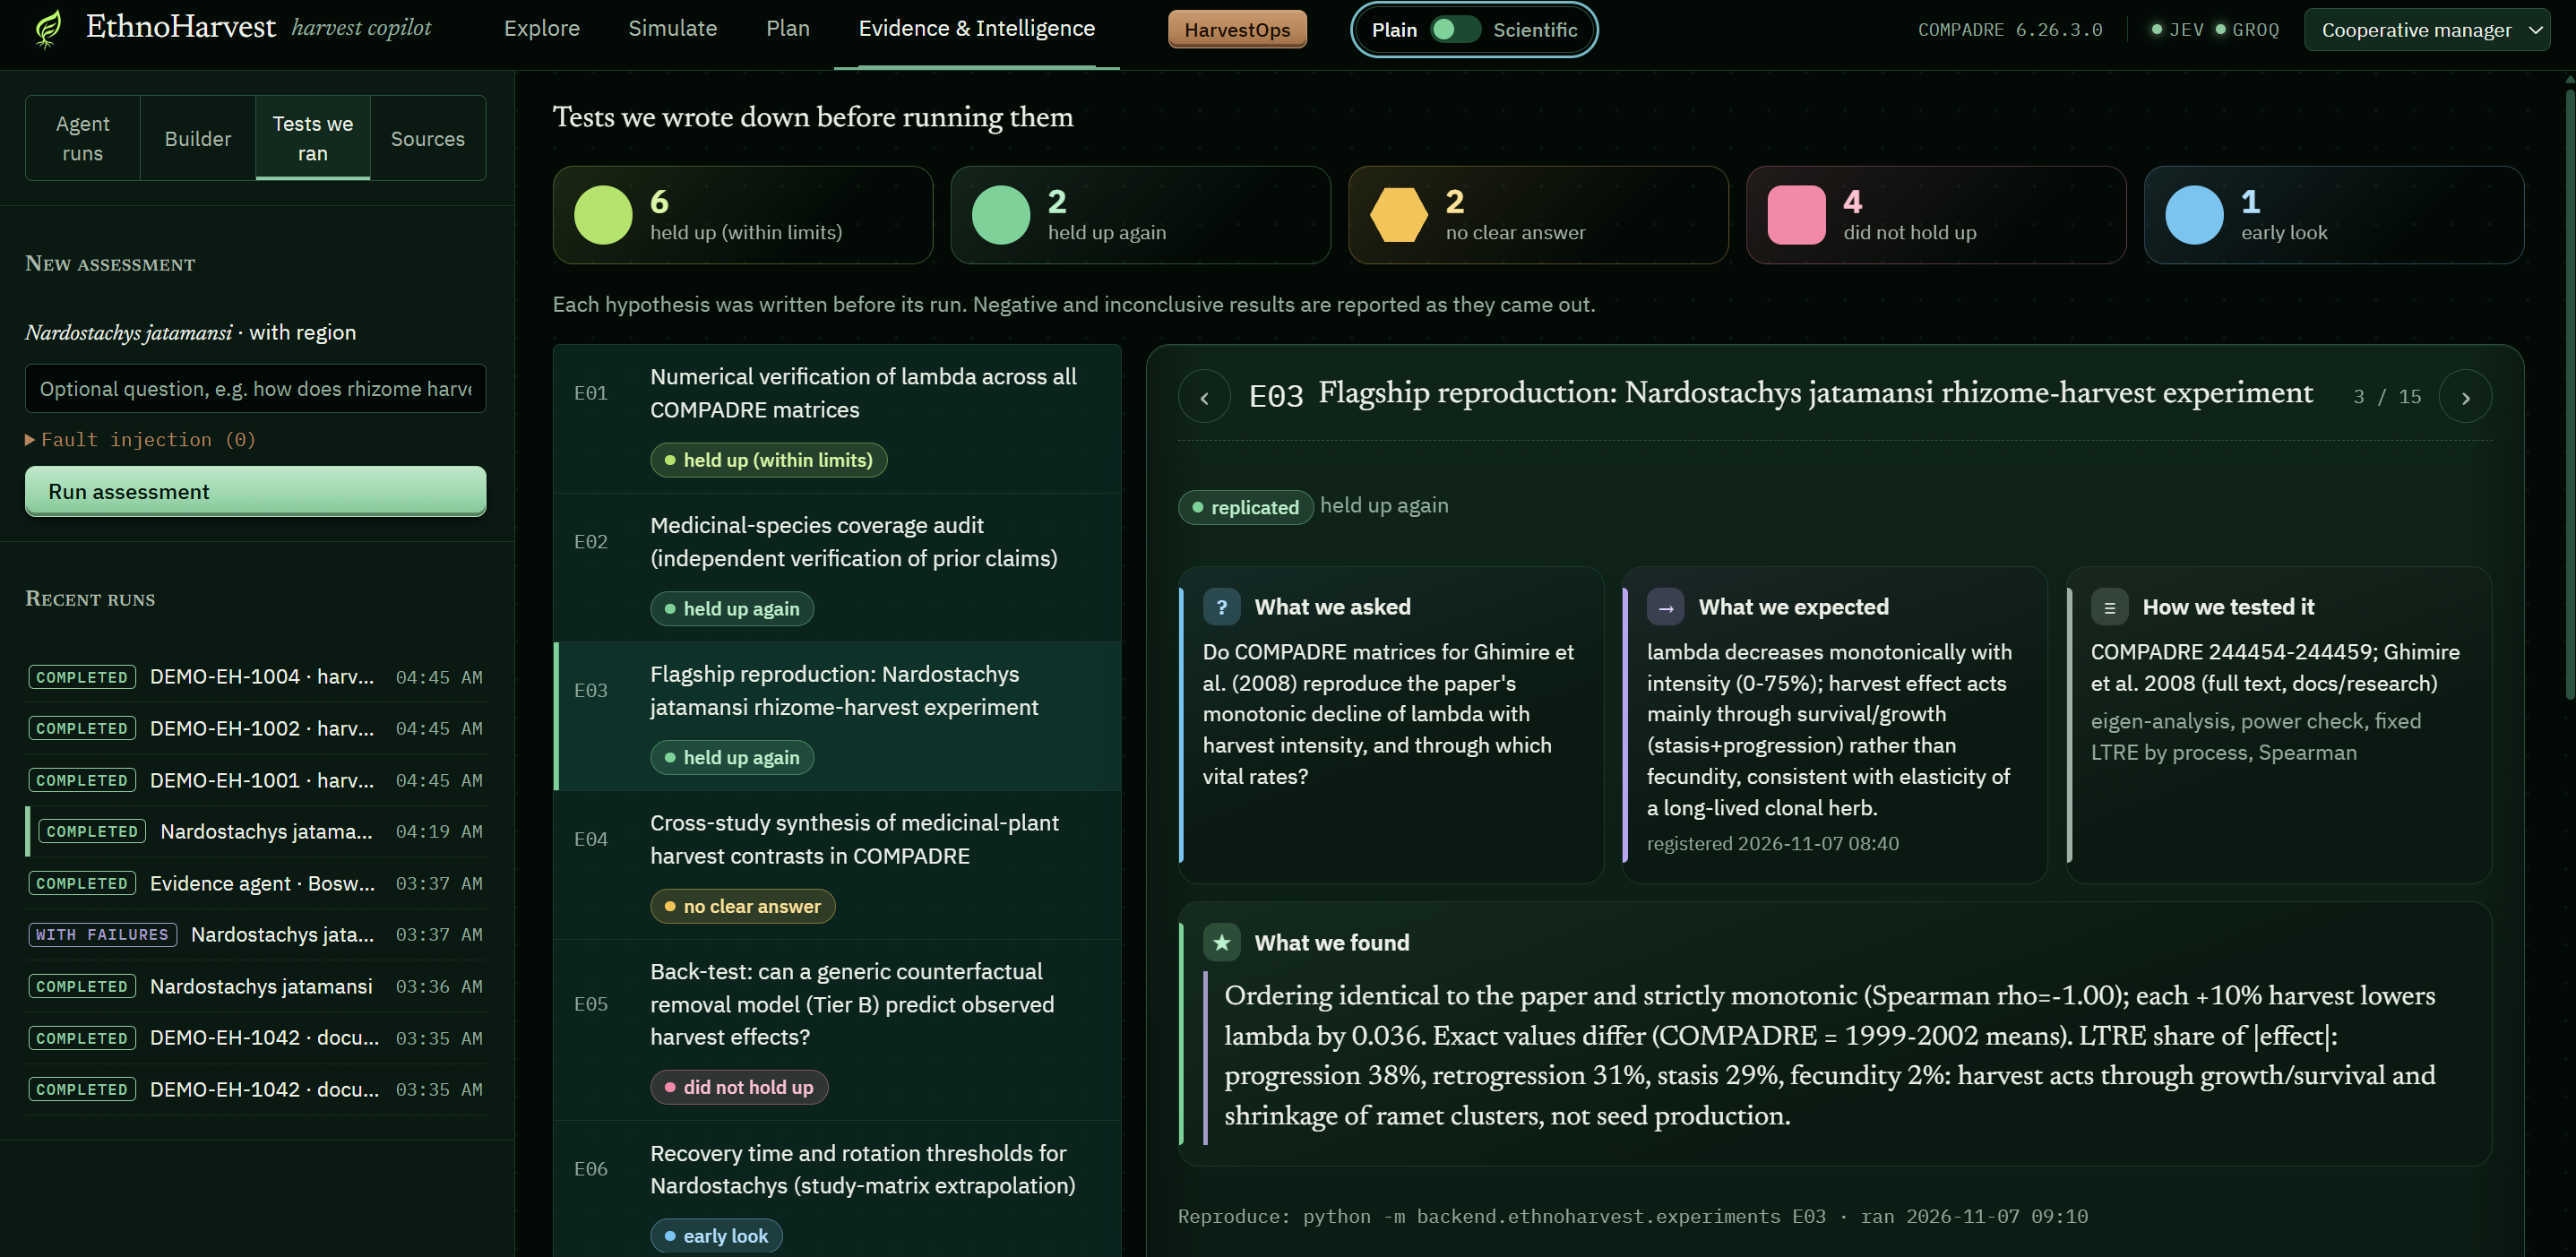
What our pipeline found for Jatamansi. We reproduced a real harvest experiment (Ghimire et al. 2008, Journal of Applied Ecology 45:41) from the COMPADRE population models. Our reproduction ranks every harvest level in the same order as the paper, a perfect rank match.
| Harvest intensity | Population growth rate, our reproduction | Population growth rate, published paper |
|---|---|---|
| 0 percent | 1.028 | 1.014 |
| 10 percent | 0.958 | 0.928 |
| 25 percent | 0.891 | 0.838 |
| 50 percent | 0.831 | 0.779 |
| 75 percent | 0.737 | 0.637 |
A growth rate below 1 means the population shrinks. Even 10 percent harvest pushes Jatamansi below that line. Each extra 10 percent of harvest costs about 0.036 in growth rate. Our decomposition (LTRE) shows why: the decline comes from growth (38 percent), shrinkage (31 percent) and survival (29 percent), and only 2 percent from seeds. So "leave the seeds" is the wrong advice for this plant; the harvest kills the plant itself.
3. Why this project is needed
- No tool joins the evidence up. Name checklists, population models, maps and trade rules live in separate places with separate formats.
- Confident guesses cause harm. Our own experiment E05 showed that generic removal models miss the real harvest effect by 0.068 in growth rate. That is the difference between a growing population and a collapsing one.
- Small budgets need guidance. A cooperative or field team can afford only a few measurements per season and needs to know which ones unlock a decision.
- Traceability is on paper. Buyers and regulators increasingly ask where a batch came from, and documents with the wrong plant part, an expired authorisation or a synonym name slip through.
4. What EthnoHarvest AI does, end to end
EthnoHarvest AI is a six step pipeline. Each step can stop the next one, so the app never produces an answer it cannot defend.
| Step | What happens | Main data or method |
|---|---|---|
| 1. Name | Checks the plant name against two world checklists and shows its native range | Kew WCVP (the data behind Plants of the World Online) and World Flora Online |
| 2. Demography | Runs published population models to see how harvest changes growth | COMPADRE matrix models, growth rate, LTRE, harvest dose response |
| 3. Evidence tier | Grades what we know: A (backed by a harvest study), B (model only), C (insufficient) | Audited harvest studies and quality control of matrices |
| 4. Gate | Asks "can a safe local harvest rate be estimated?" and shows which of six local evidence items exist | Rule based gate; answer is "not yet" until all six exist |
| 5. Plan | Picks which measurements to collect next within a budget, explaining why for this species | Integer linear program; an AI evidence agent that quotes papers word for word |
| 6. Operate | Records each harvest batch and checks its documents from field to buyer | Harvest Passport, document checks, stock and recall |
Our core rule: unknown is never zero. If something is missing, the app says it is missing, explains why it matters and shows how to get it. It never issues a quota, a permit or a "safe rate".
5. Features
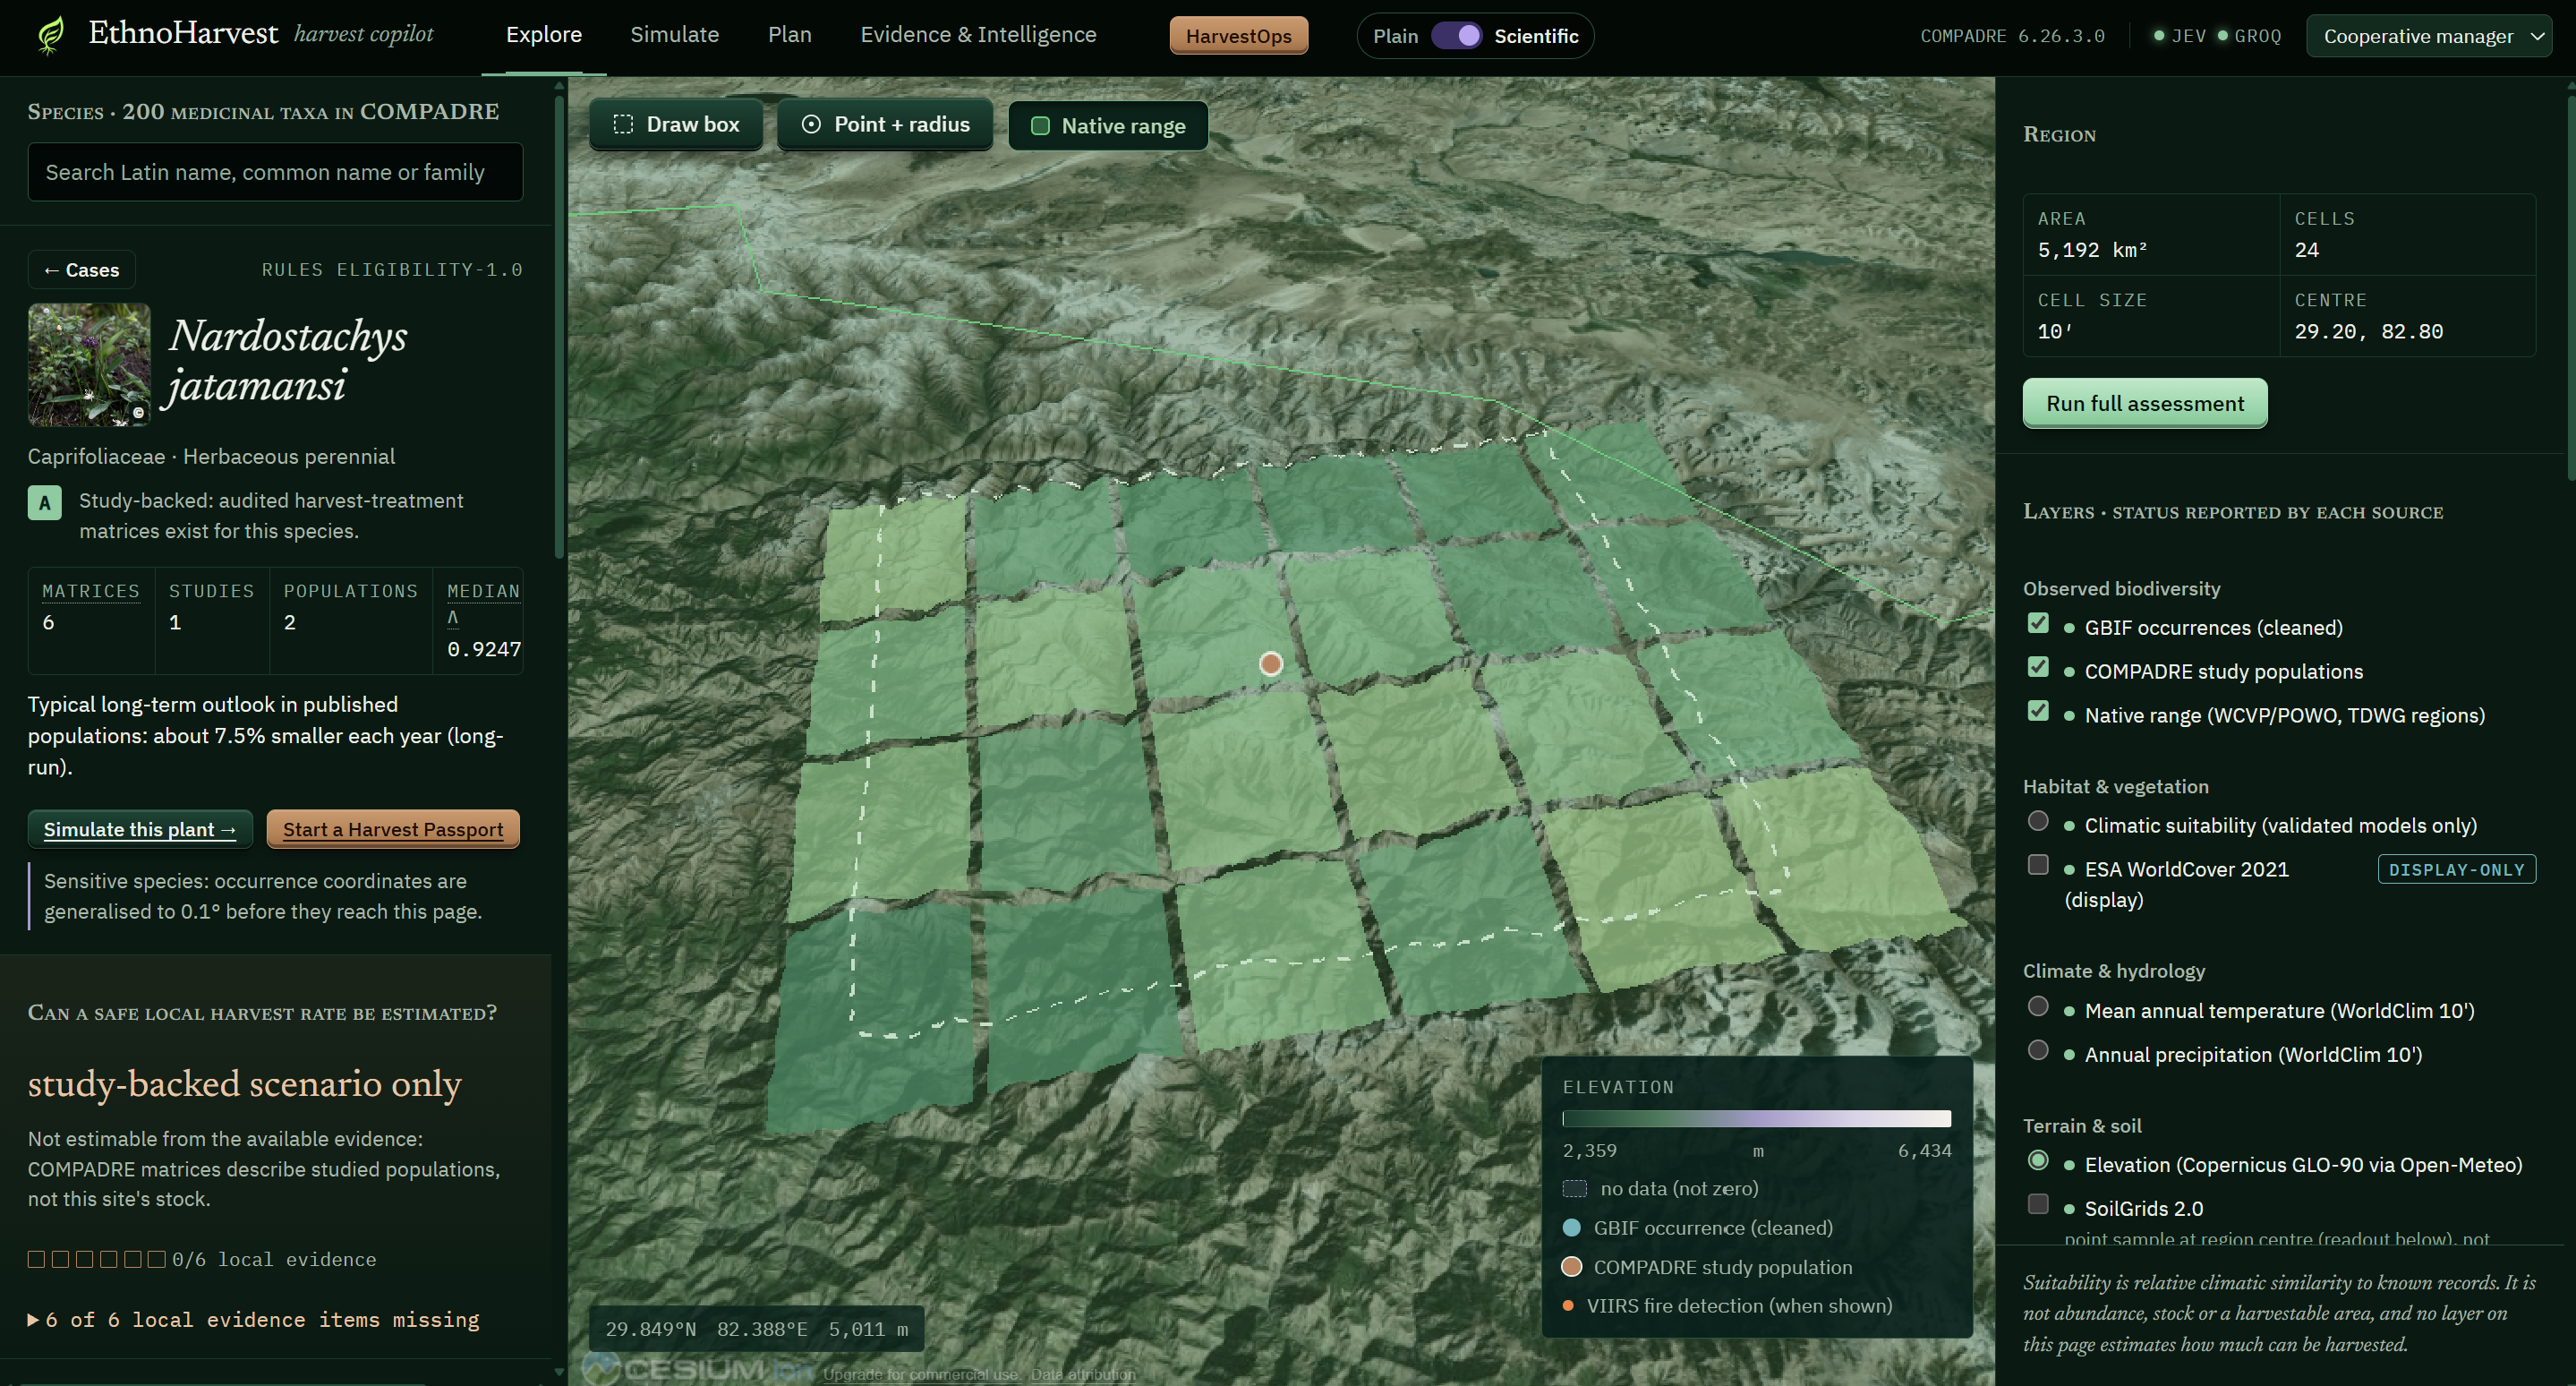
Explore: the globe
- A 3D globe (CesiumJS) with GBIF occurrence points, cleaned per region.
- Native and introduced range from Kew WCVP, drawn over 369 world regions (TDWG level 3). Native is green, introduced is amber.
- A region panel with climate (WorldClim, NASA POWER), tree cover loss (Global Forest Watch), active fires (NASA FIRMS) and land cover (ESA WorldCover).
- A species dossier with photos (open licence, credited), CITES status, documented medicinal uses and a Name Check card showing whether Kew and World Flora Online agree.
- The safe harvest question box, which answers "not yet" and lists what local evidence is missing.
- A case library of ready made harvest scenarios, such as Jatamansi rhizome harvest in the Nepal Himalaya.
Simulate: the 3D Living Ecosystem Studio
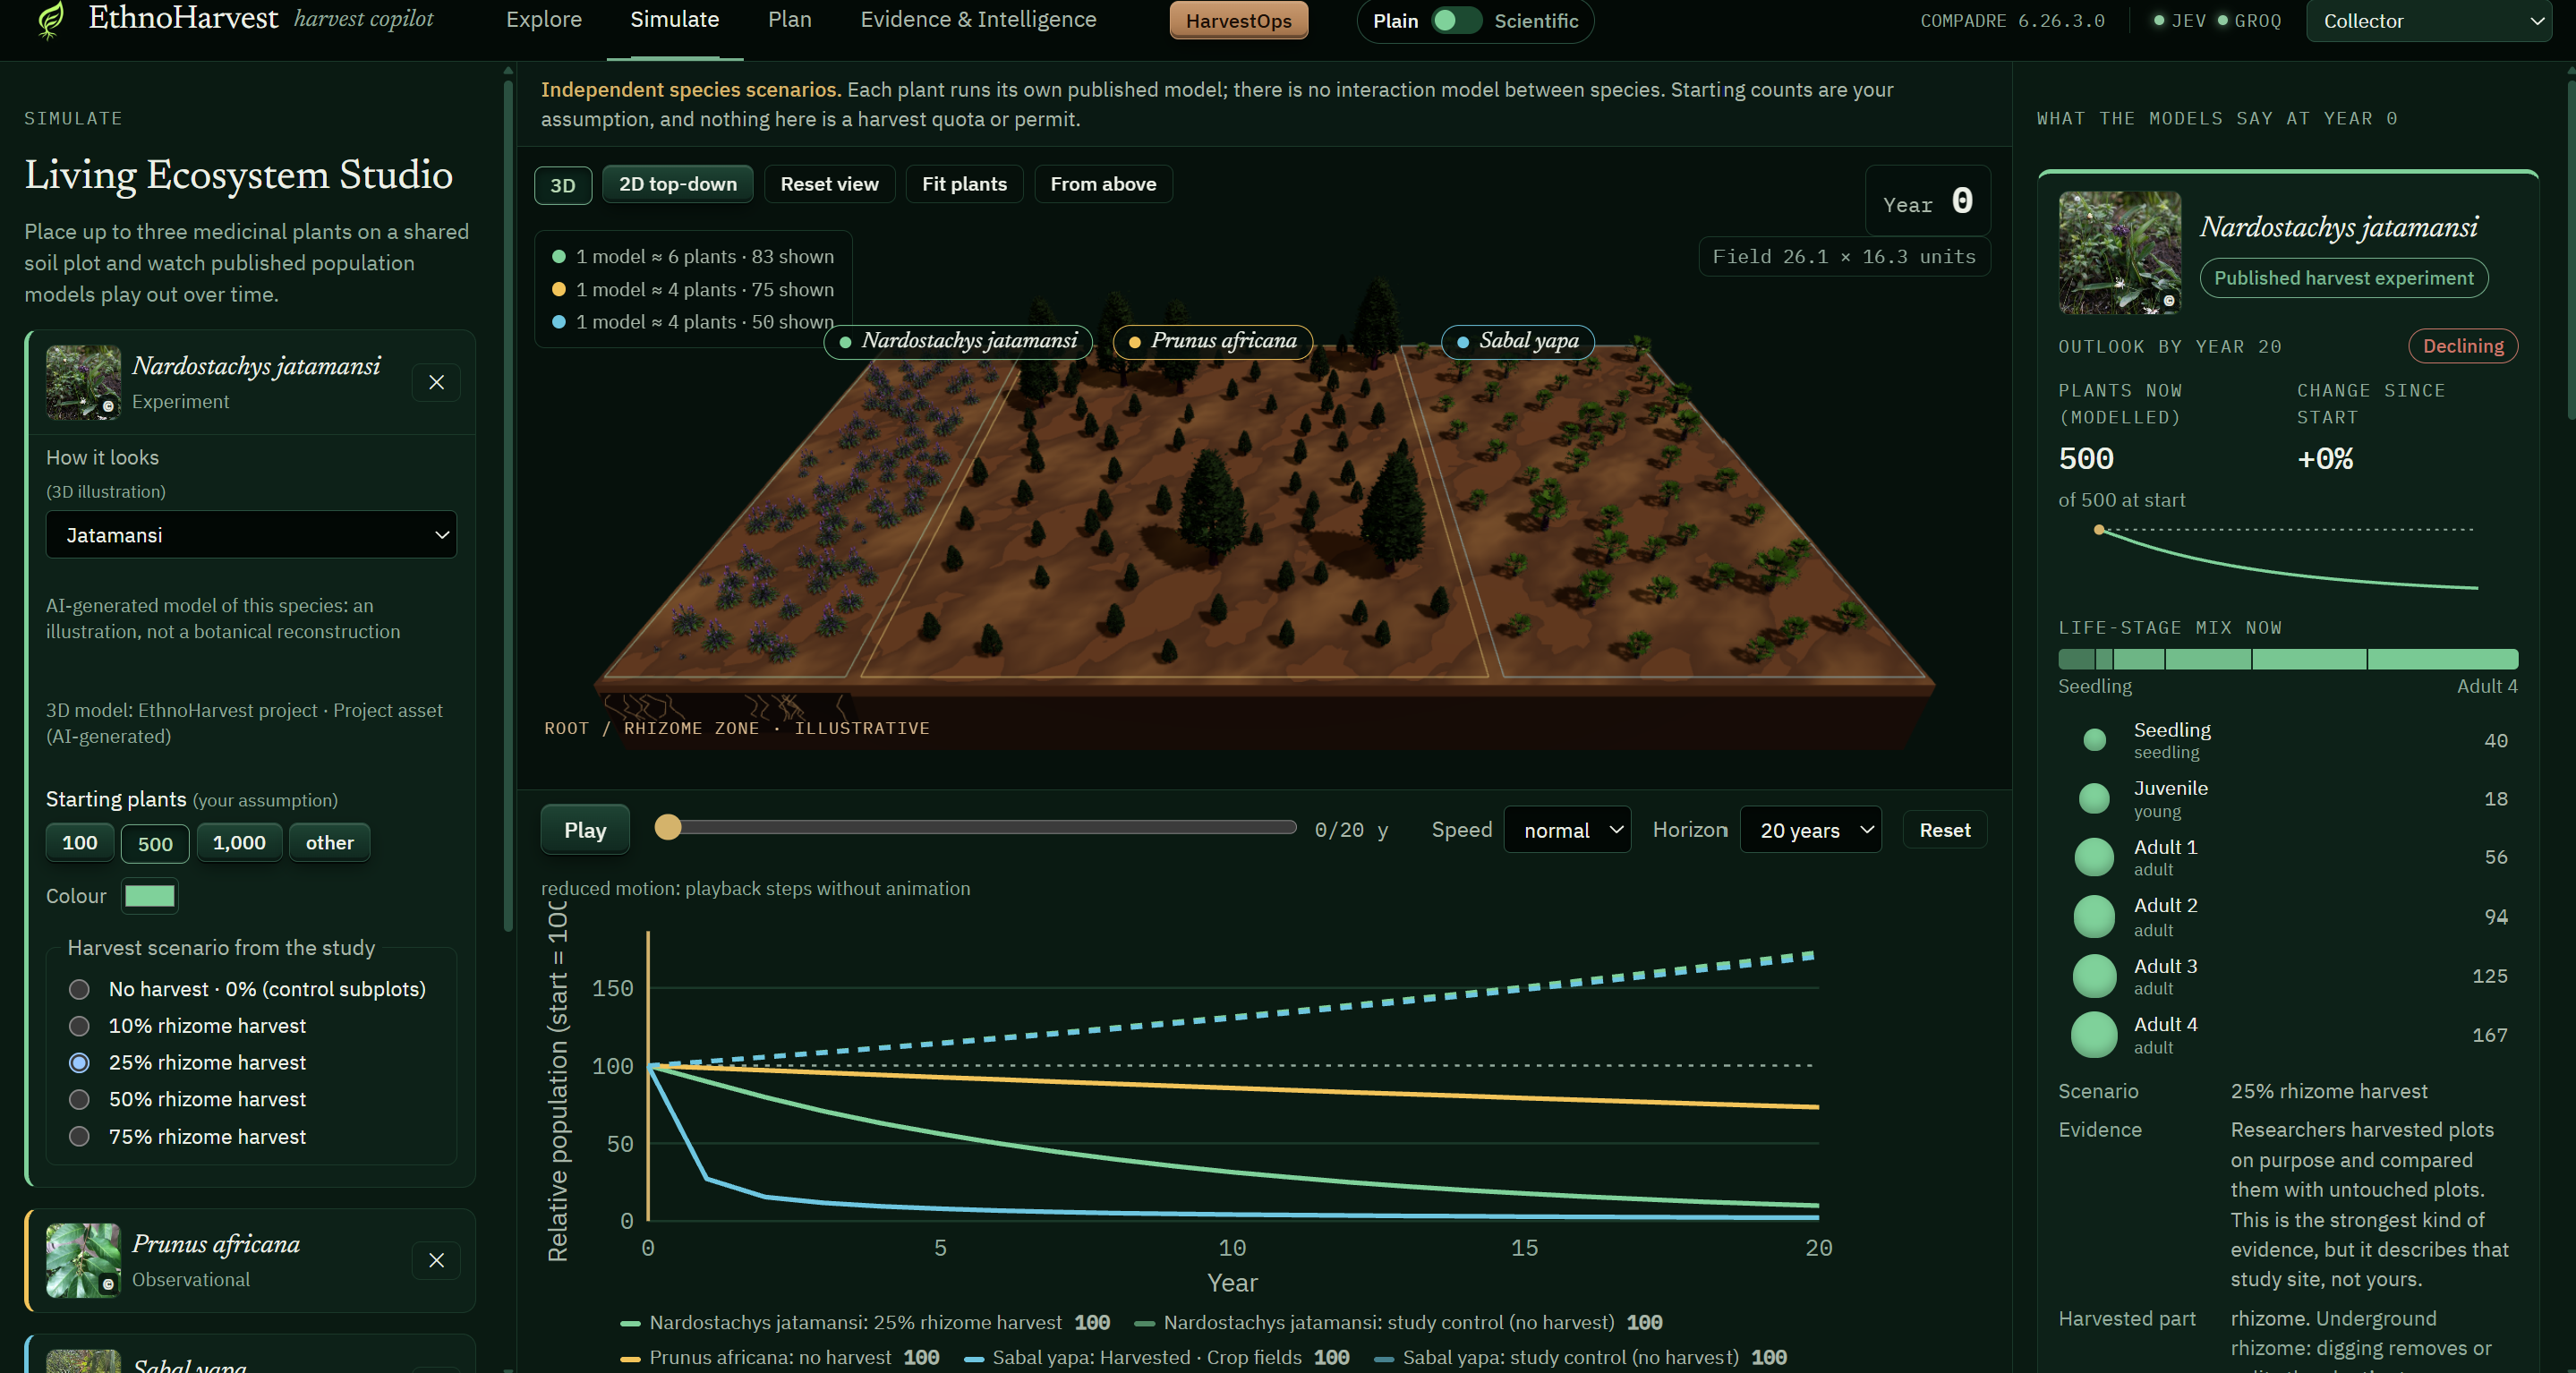
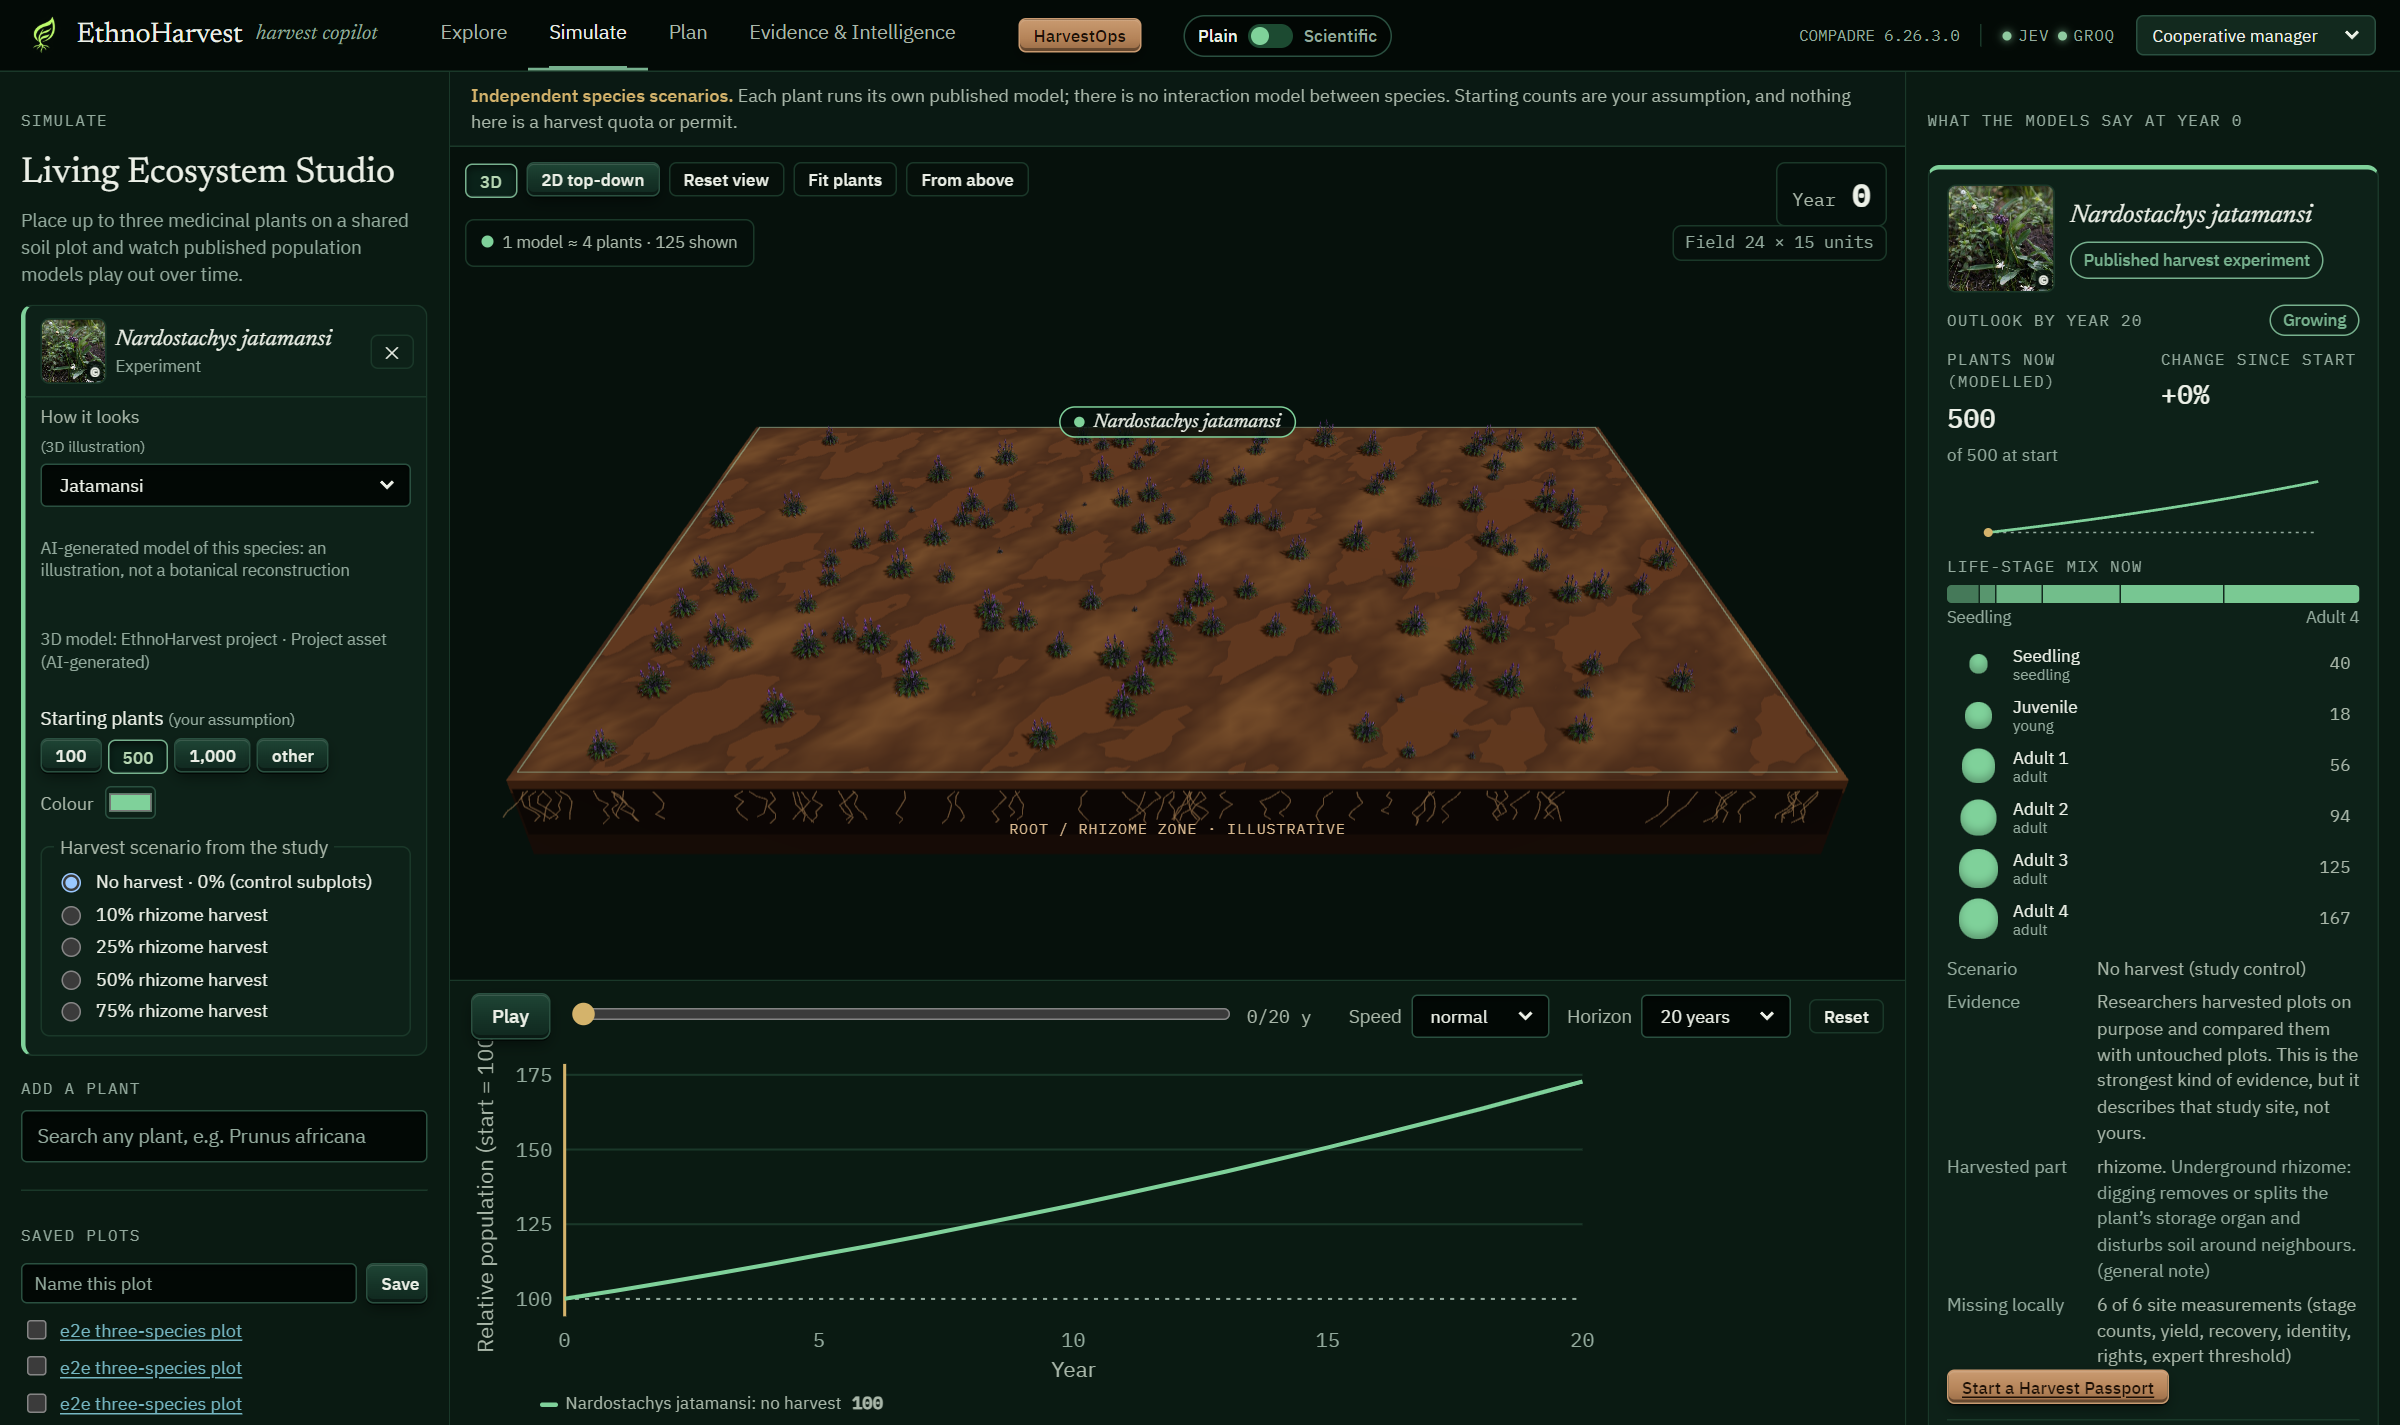
- A 3D field (Three.js) where every plant's size shows its life stage (seedling, young, adult), taken directly from the population model.
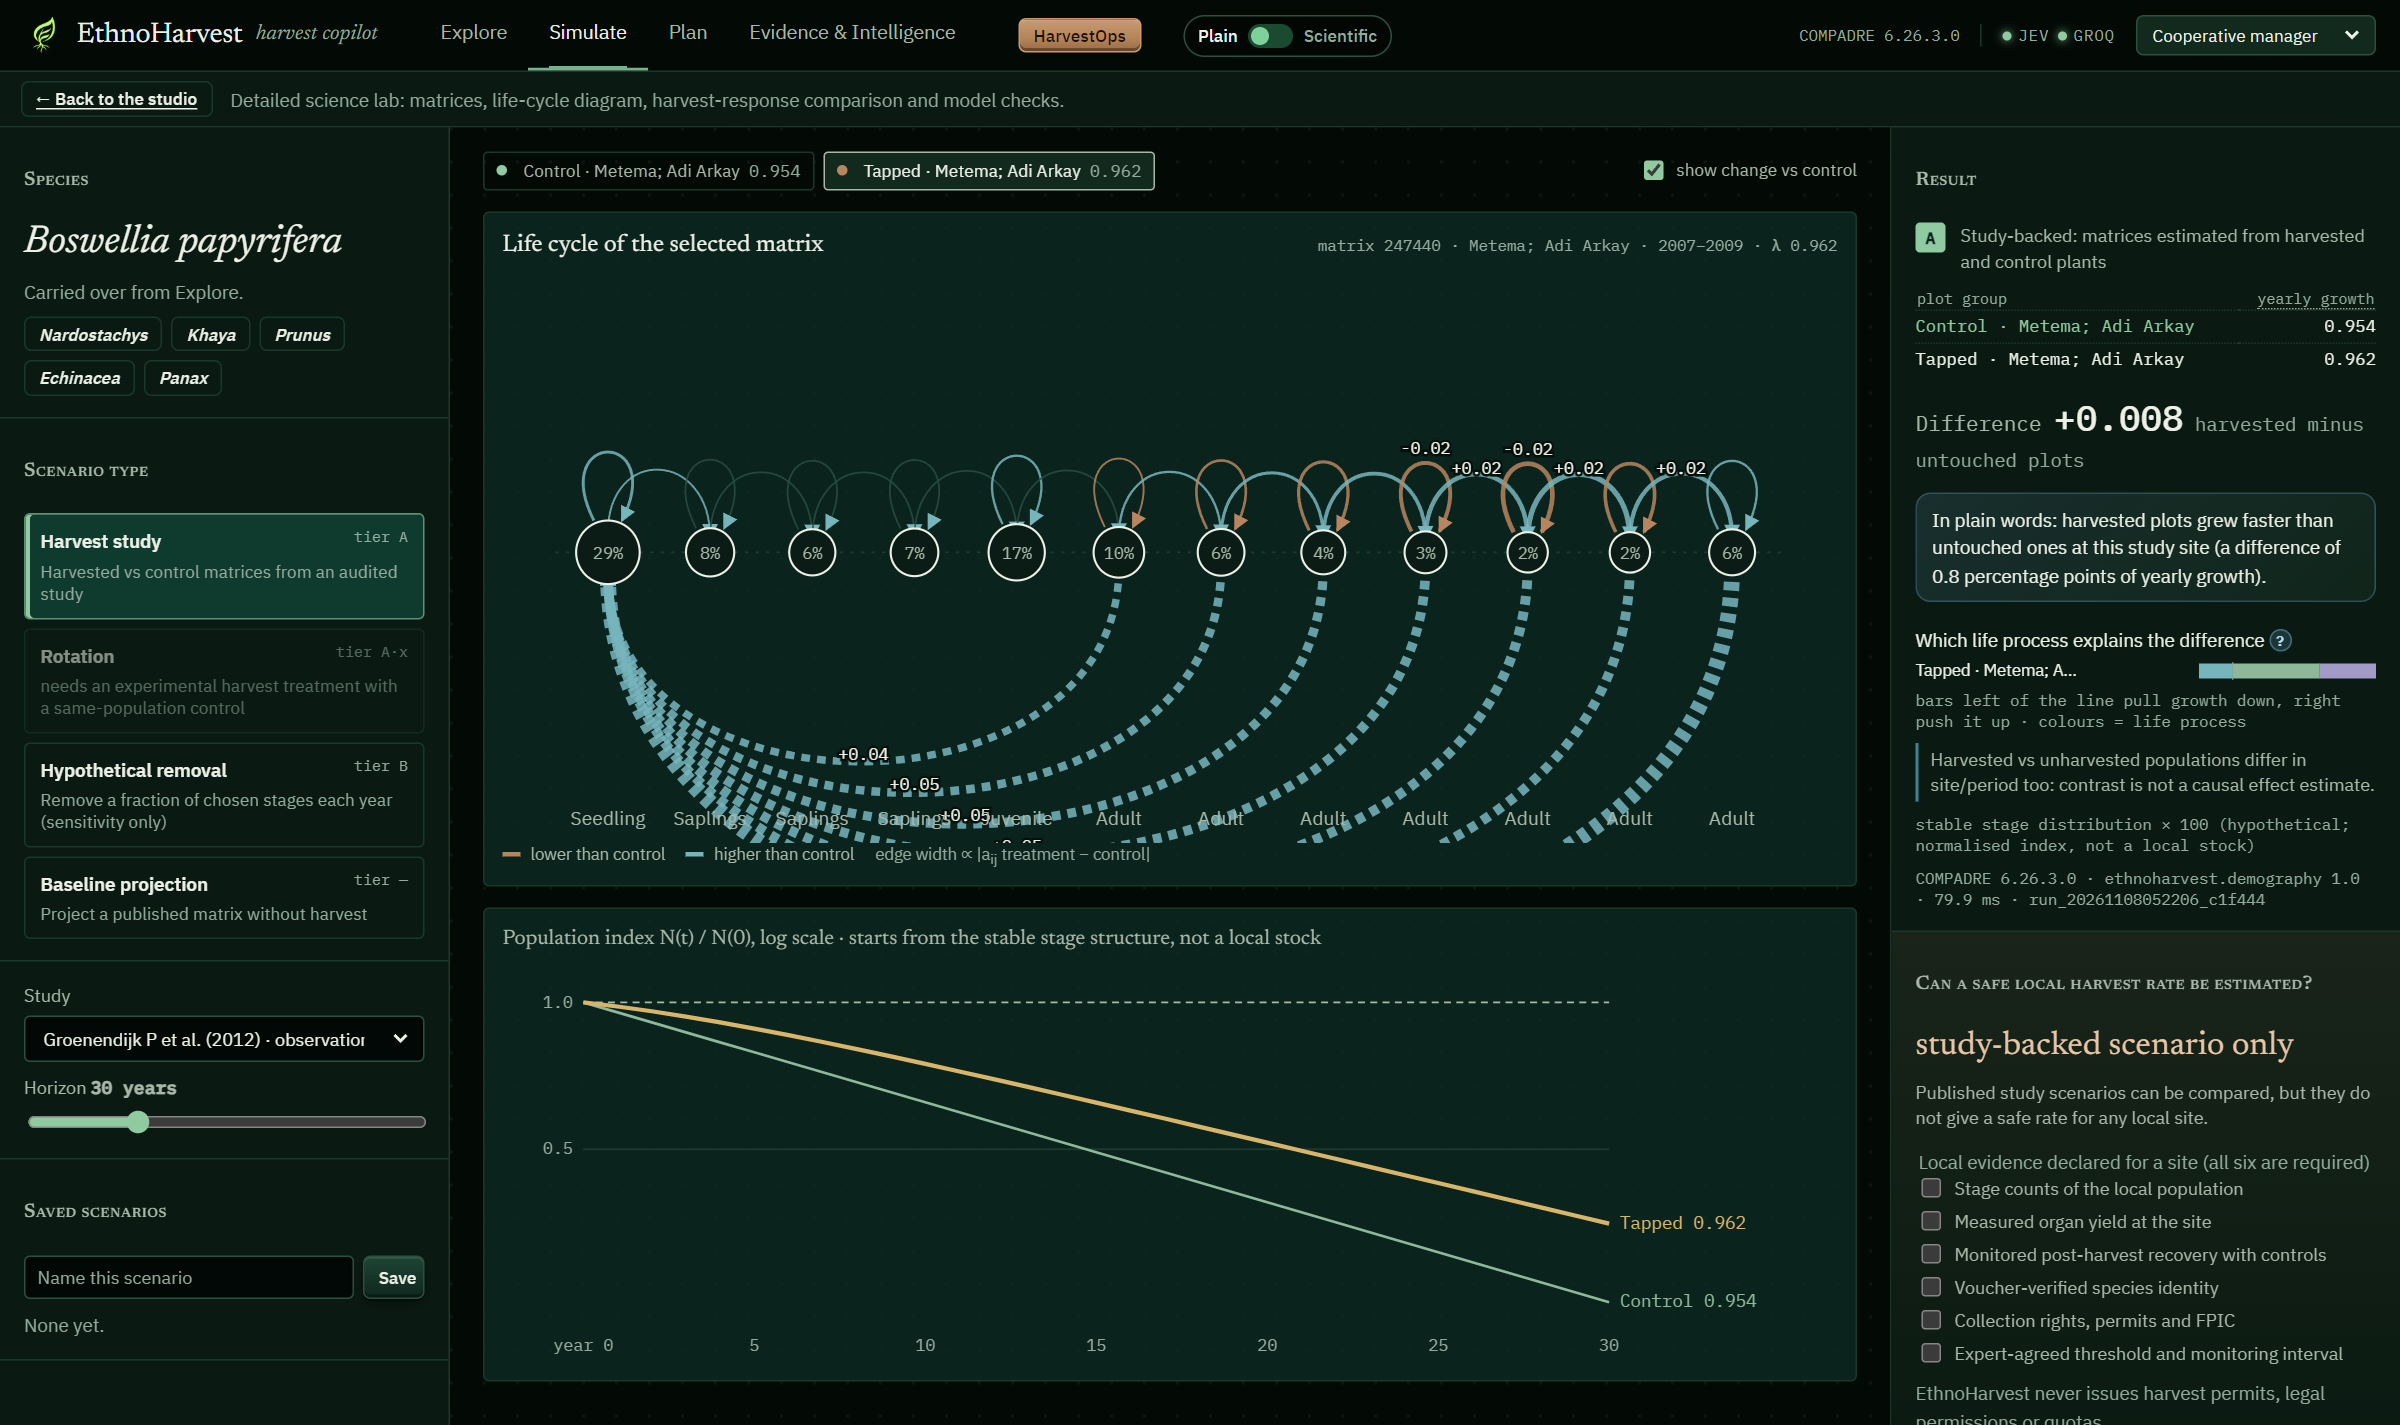
- Harvest sliders and a year by year playback, so a collector can see what a harvest level does over time.
- 33 plant models, species specific where available, with generic models by growth form.
- A Science view with the life cycle board, the growth rate chart and the LTRE breakdown, all from the same simulation as the 3D view.
Plan: deciding what to measure
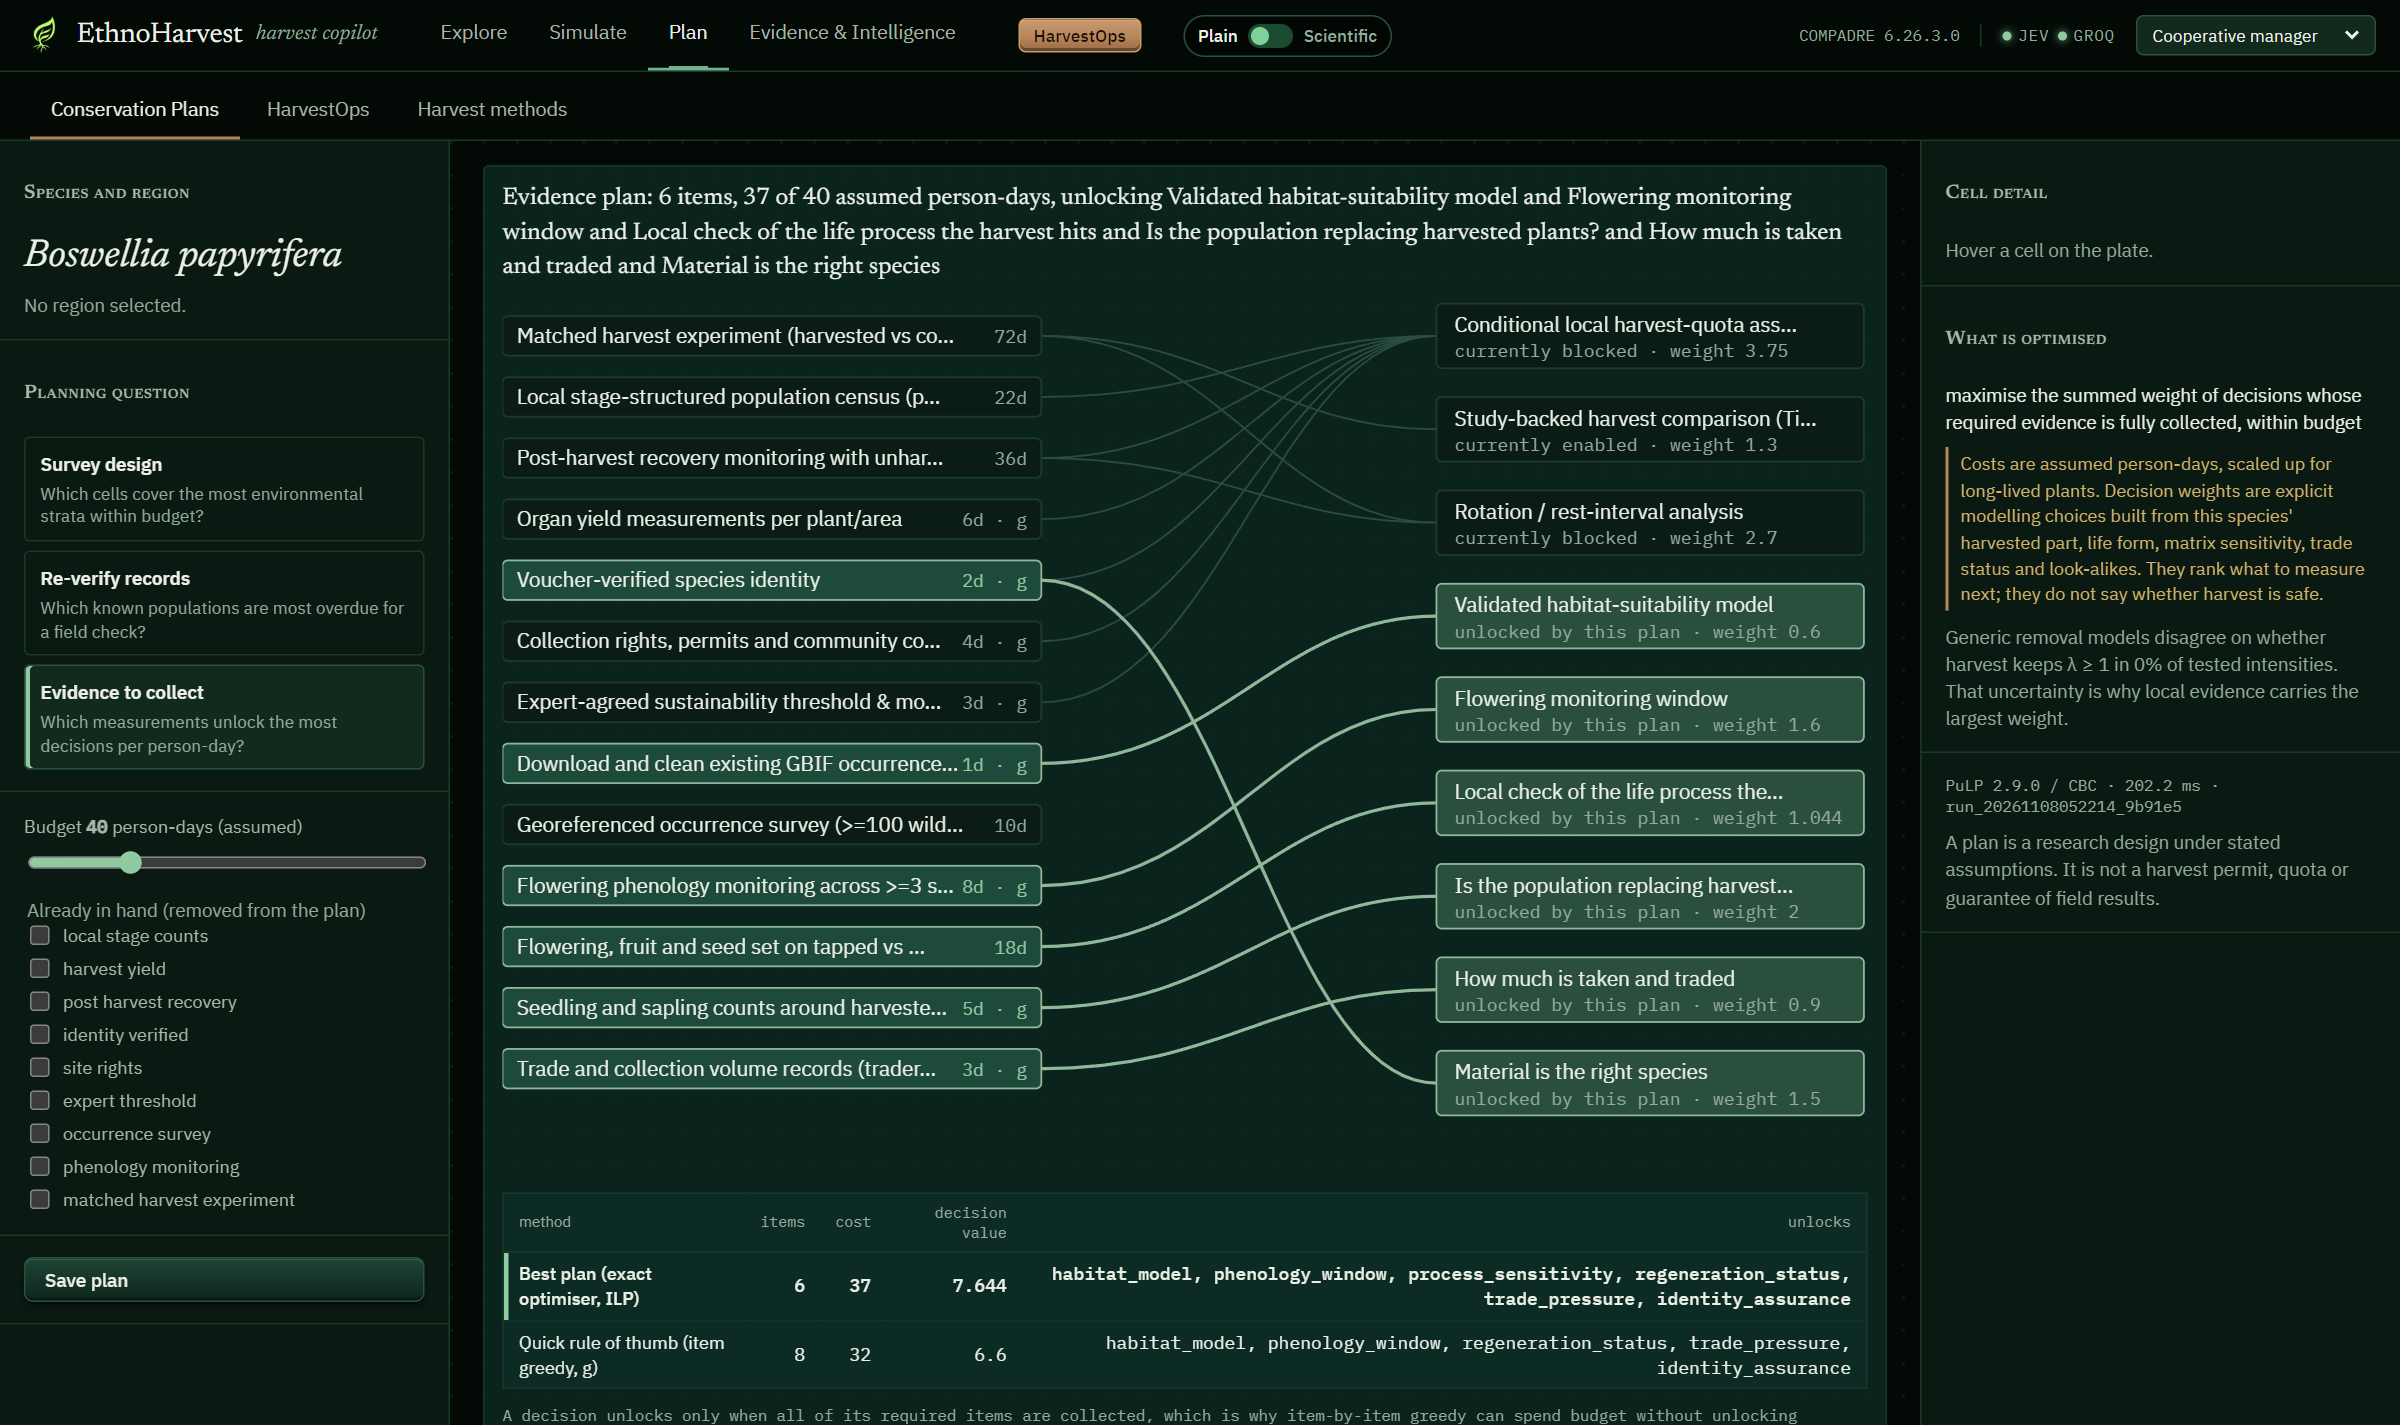
- Evidence planner. An integer linear program chooses the measurements that unlock the most decisions within a budget, such as 20 person days. Each item explains why it matters for this species (for example, large tree survival for bark harvest, recruitment for fruit or resin harvest).
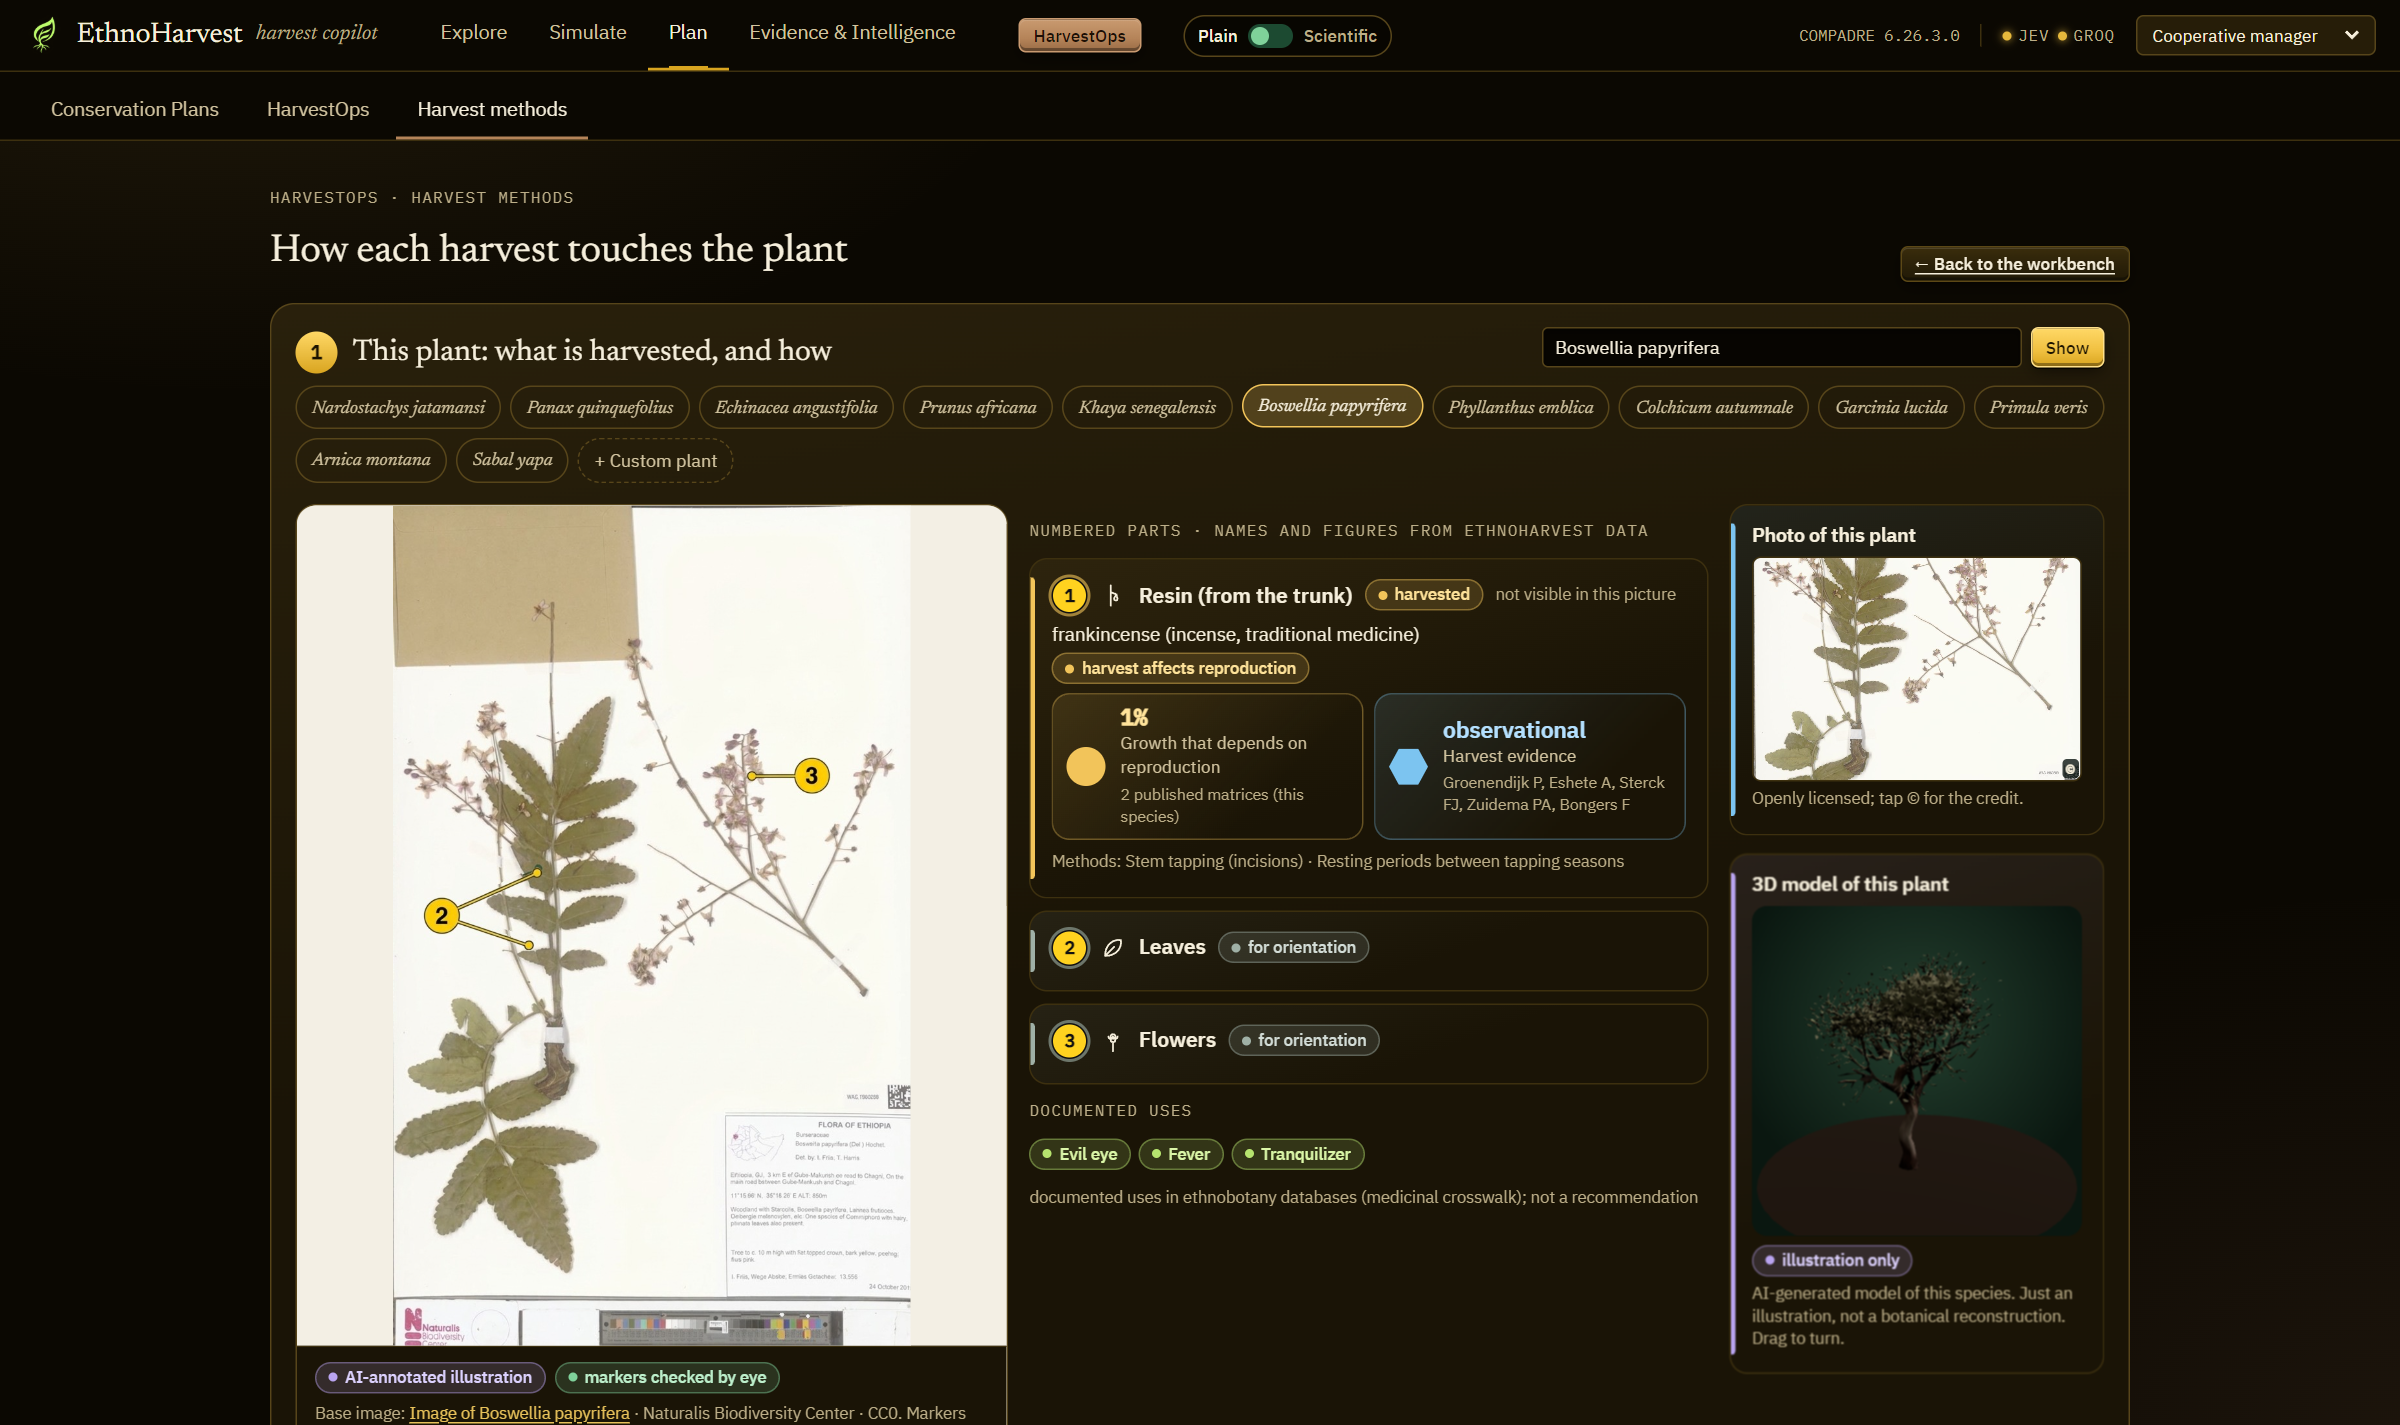
- Harvest methods. Illustrated guides to how each plant part is harvested, with numbered markers and caveats. Illustrations annotated with AI are labelled "AI annotated illustration".
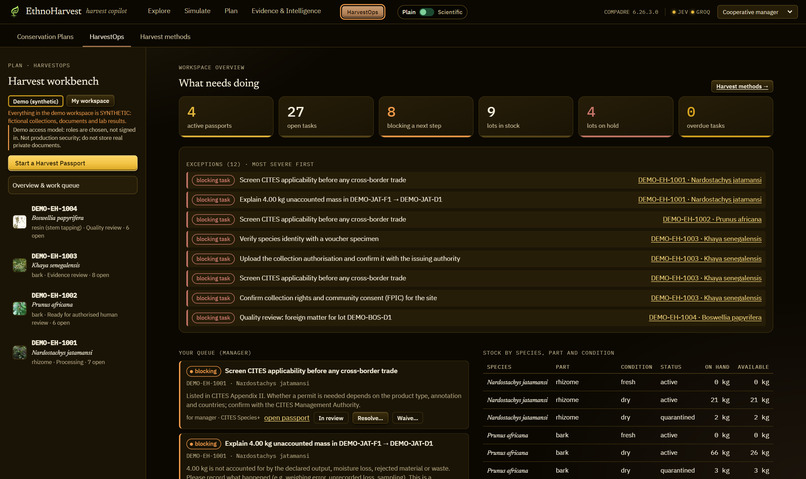
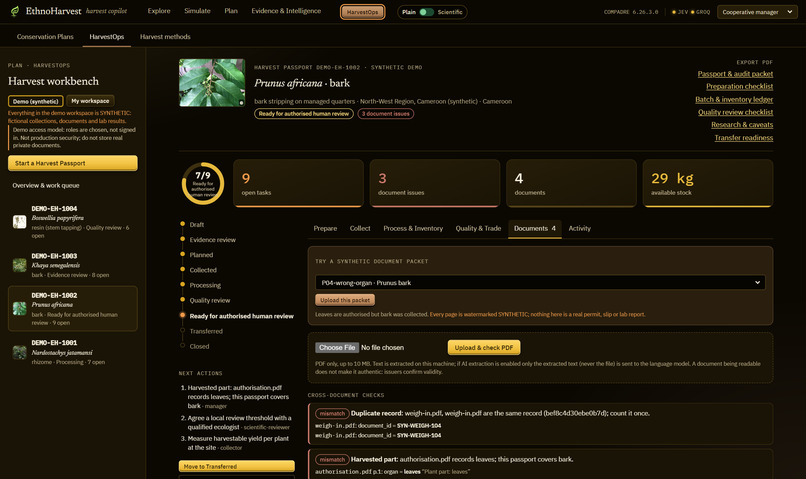
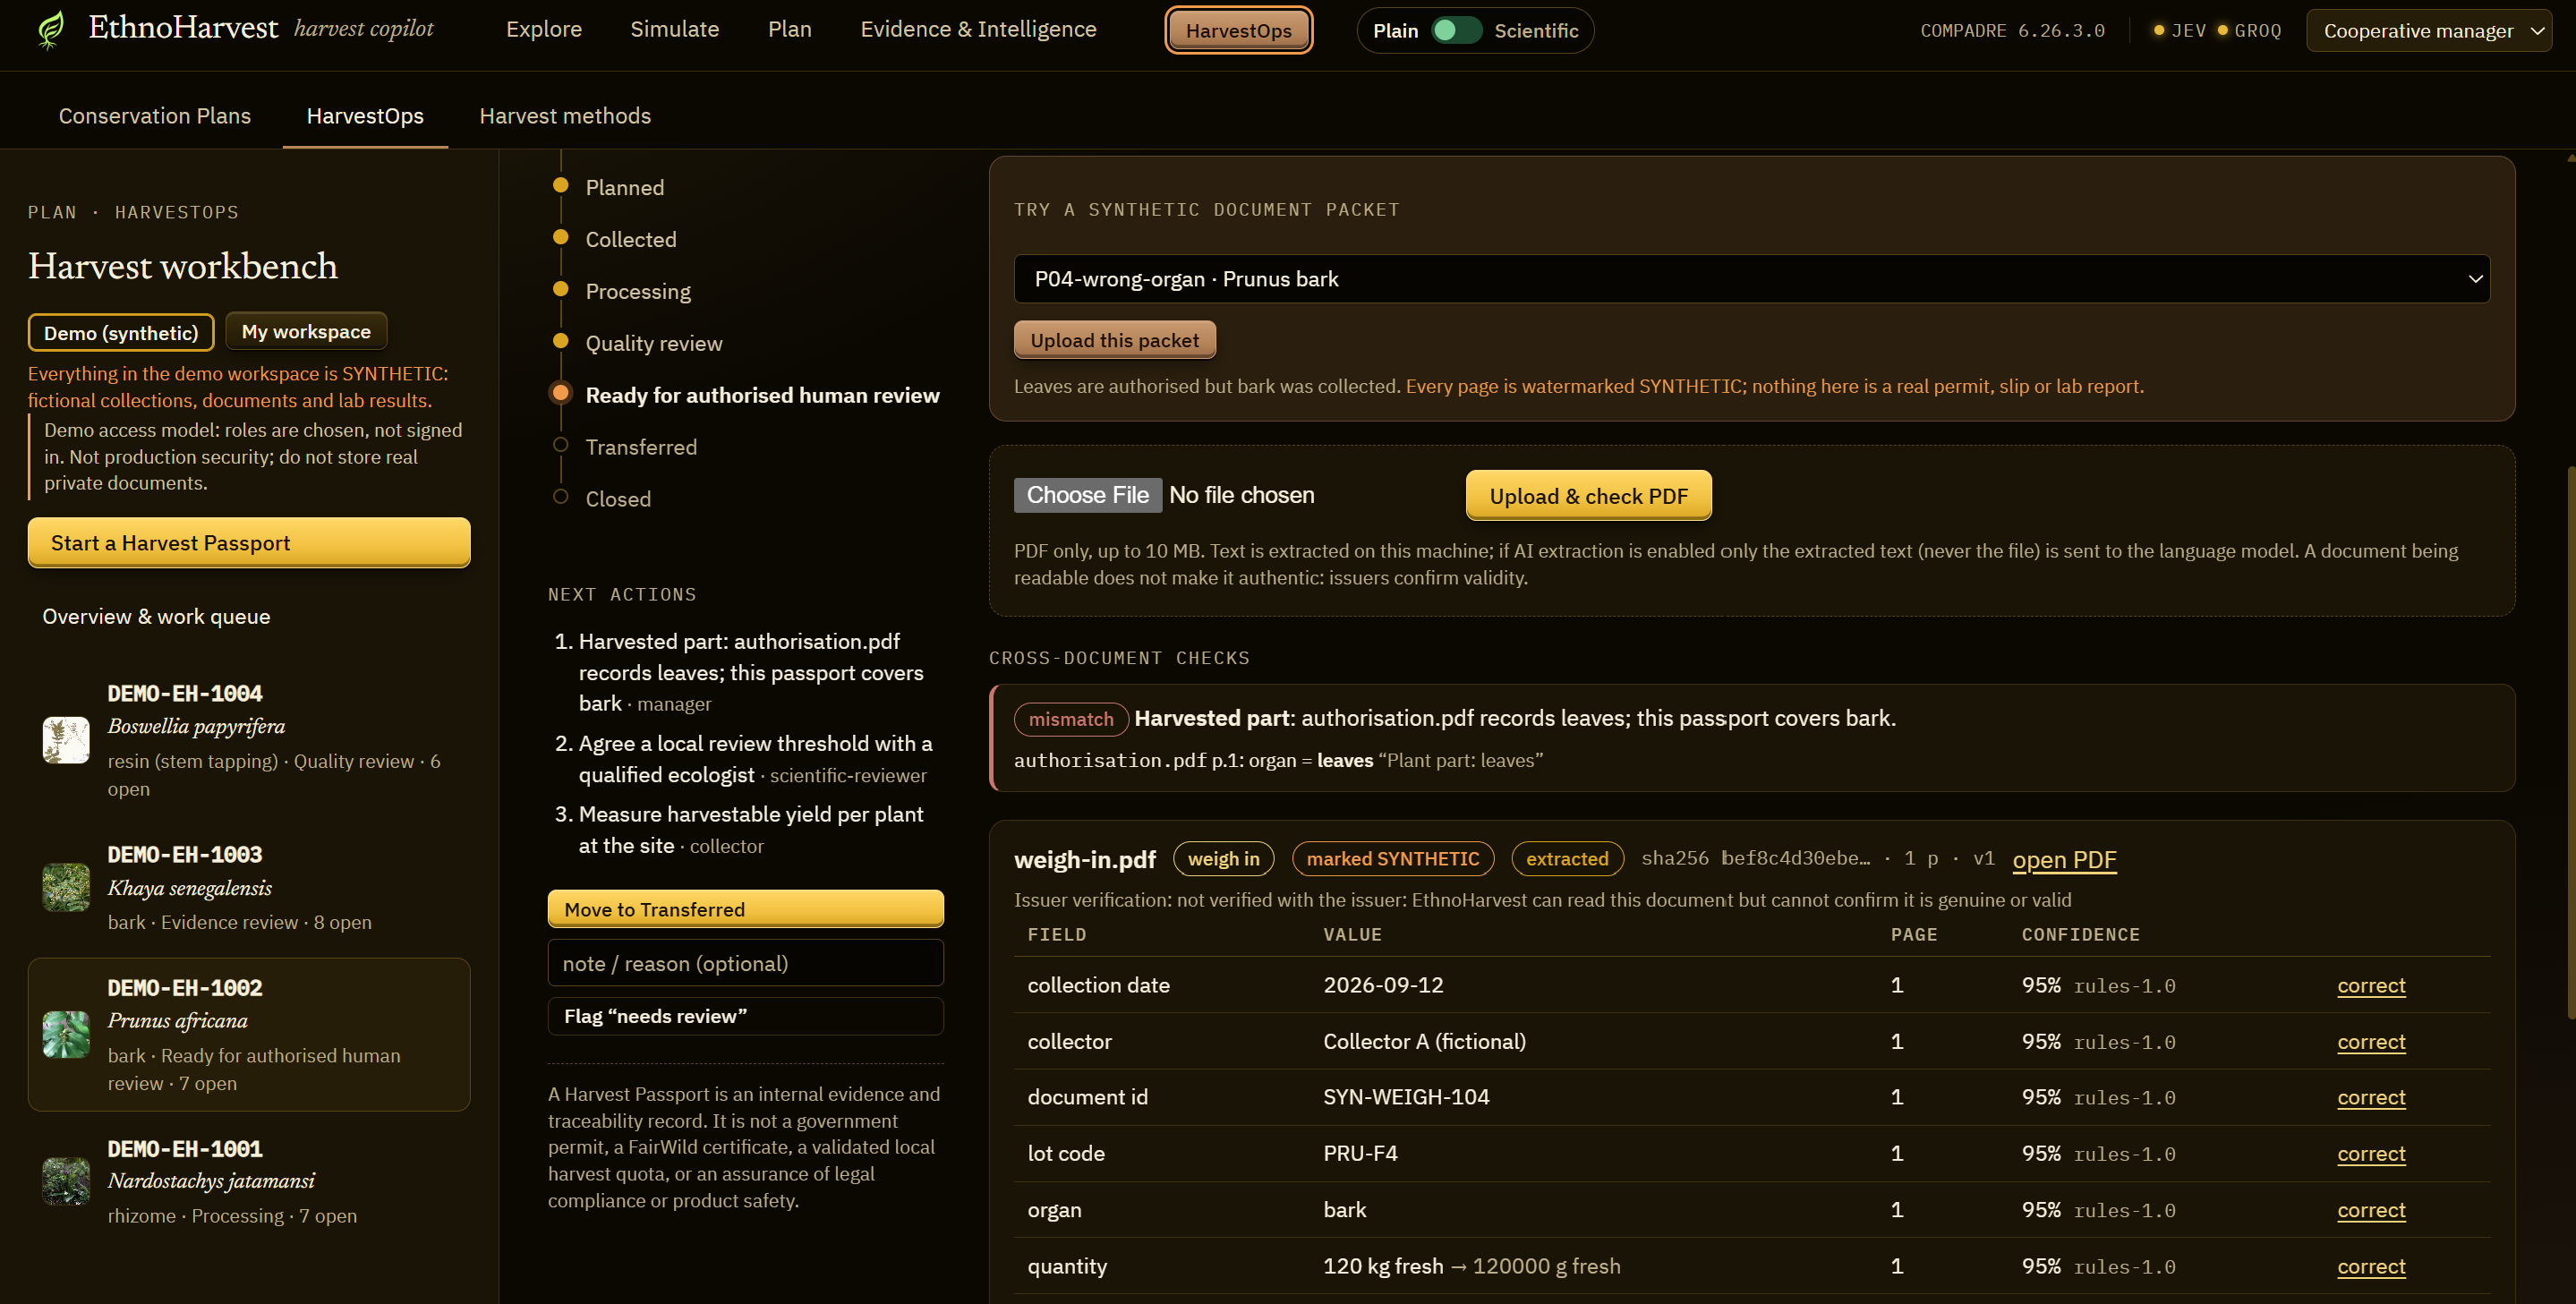
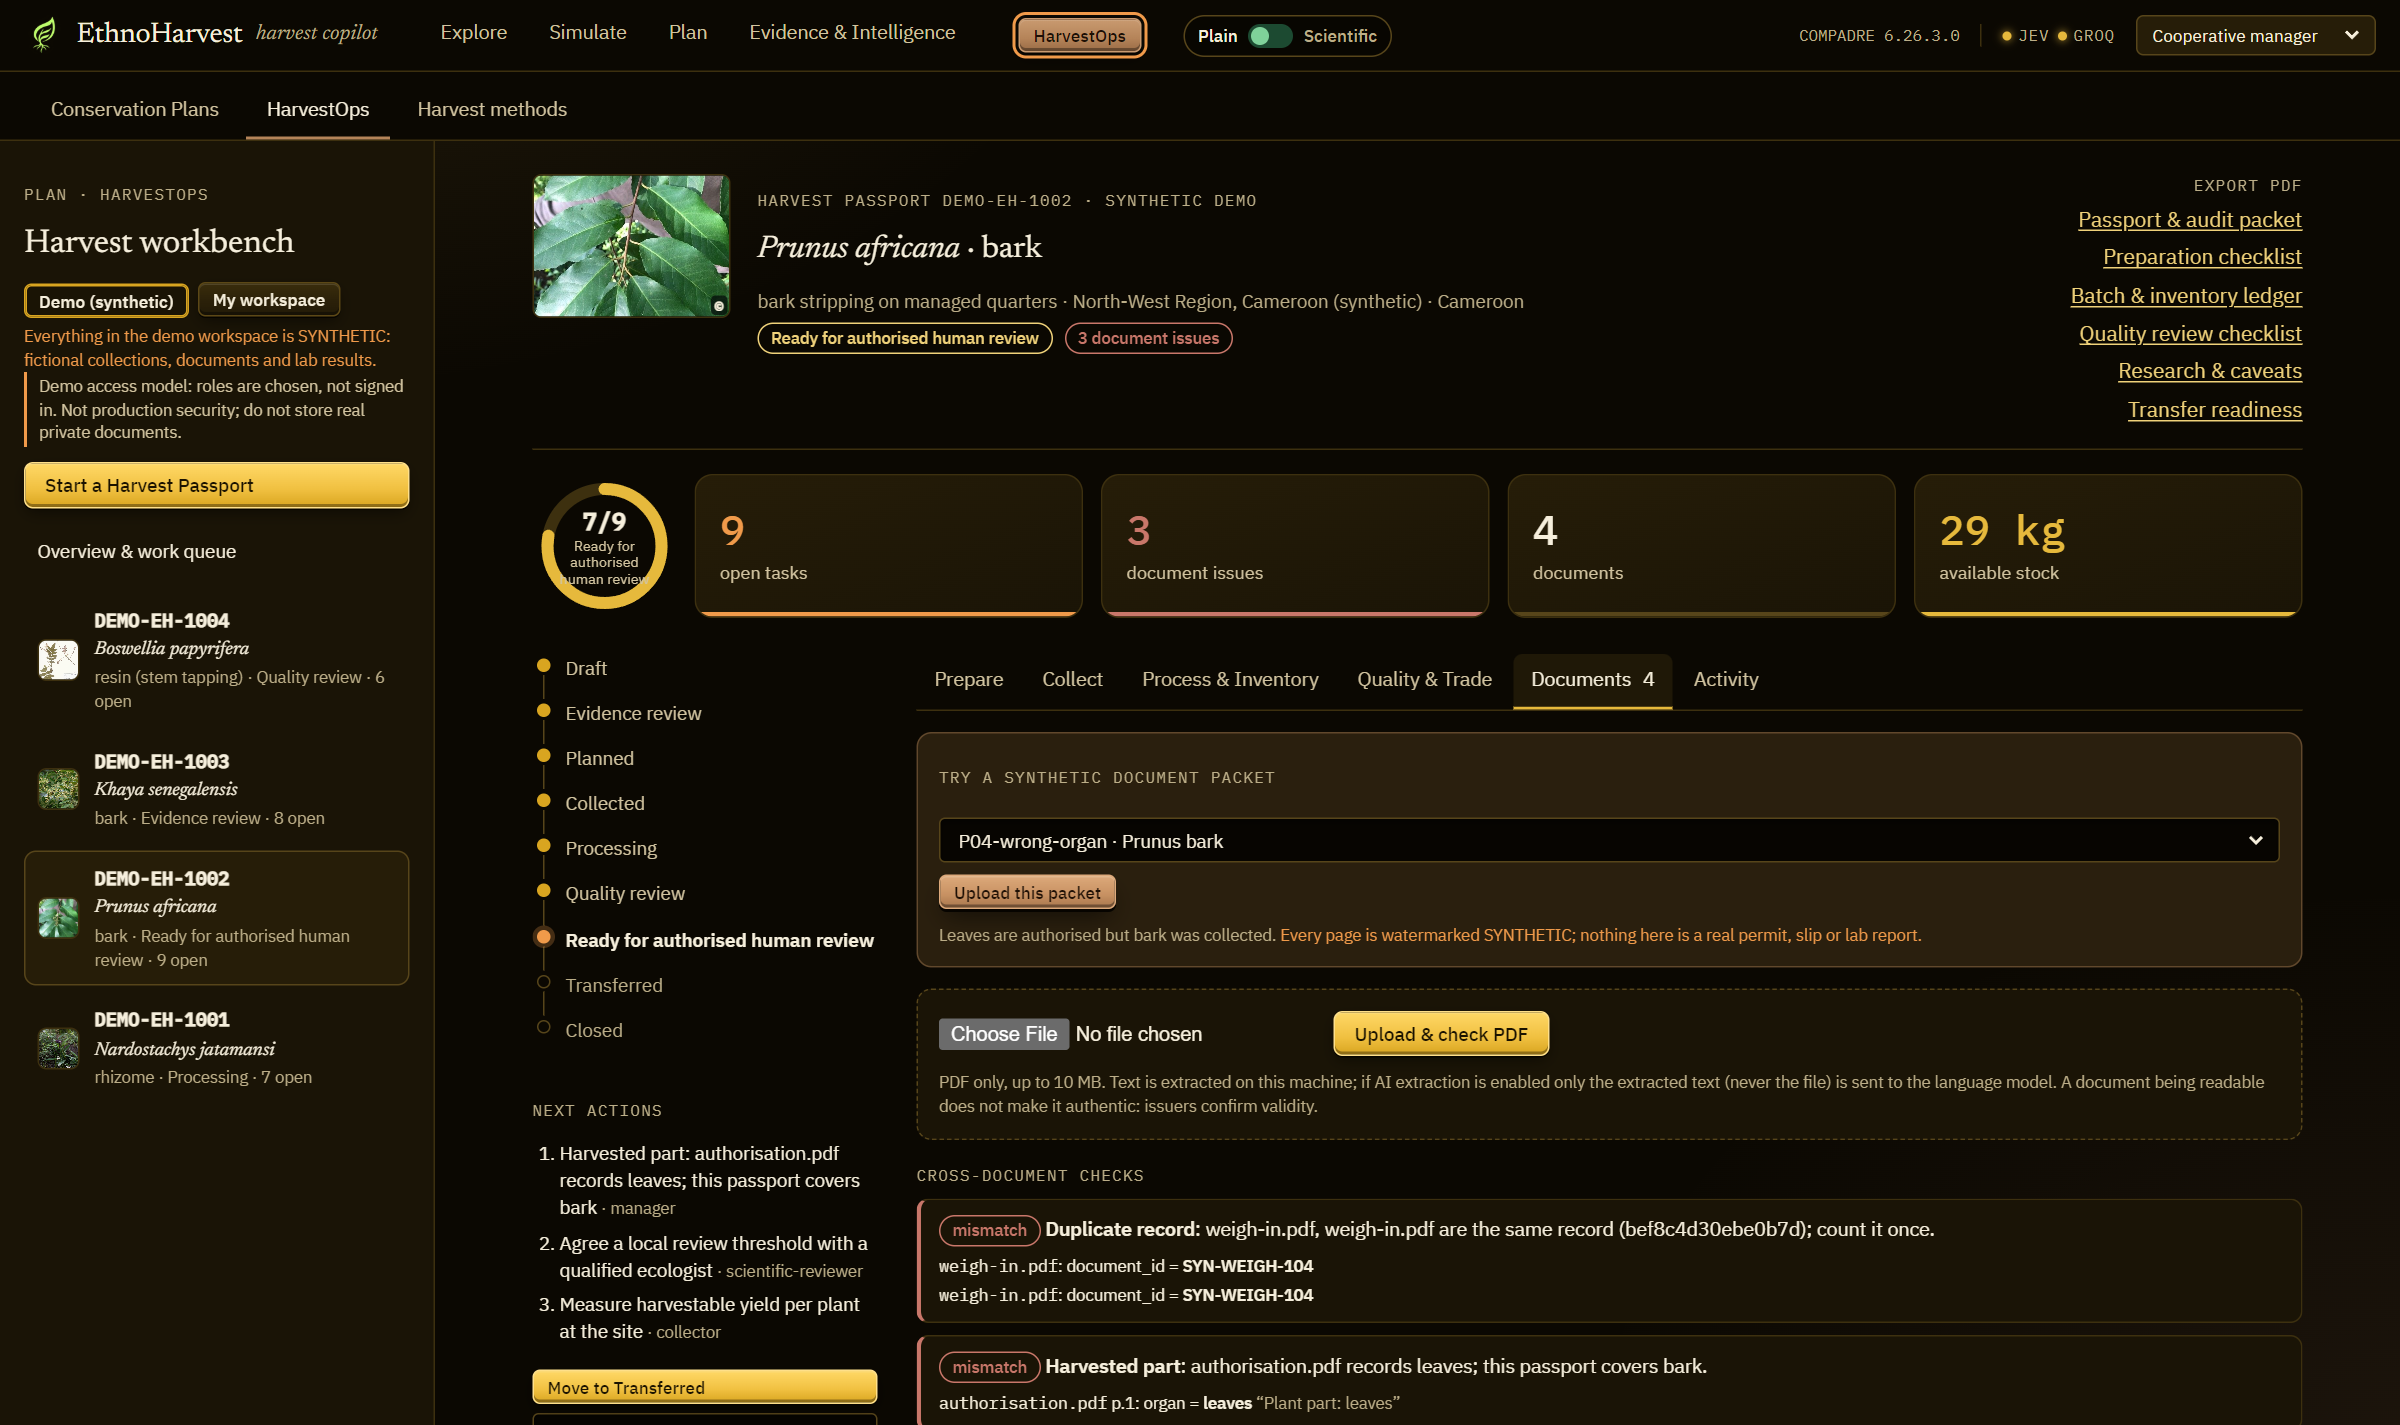
- HarvestOps and the Harvest Passport. Records harvest area, plant part, fresh and dry weight and drying. Uploaded documents are checked automatically for problems such as wrong plant part, expired authorisation, wrong species or synonym names. Every page states that a Harvest Passport is not a permit.
Evidence: the AI agent and the science record
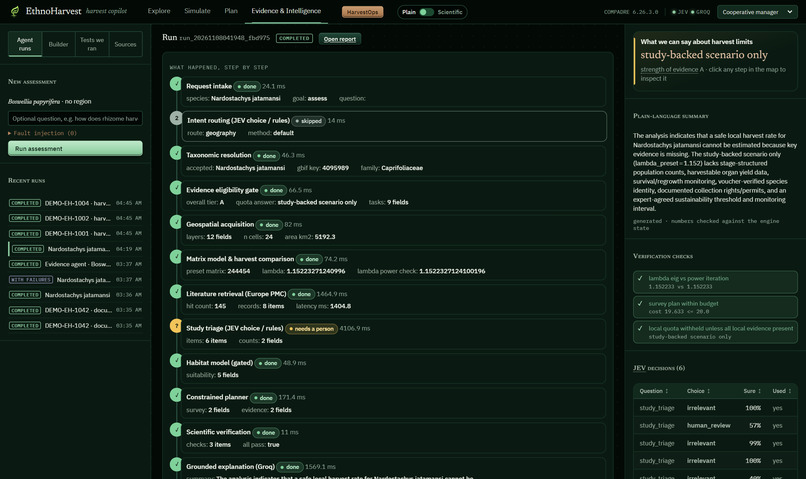
- Evidence agent. Searches the literature and extracts evidence. Every claim must quote its source word for word; a second model check runs and any failures are shown.
- Run graph. Shows each step the agent took, so judges and users can audit it.
- Workflow builder. 19 agent components (CITES lookup, regulation cards, eligibility gate, harvest comparison, recovery rotation, evidence gaps and more) that can be chained into custom workflows.
- Experiments tab. All 15 preregistered experiments, including the ones that failed.
6. A closer look at the product
The features above are the map. This section walks through the parts a user actually touches, and why each one is built the way it is.
6.1 The 3D Living Ecosystem Studio: seeing a harvest before it happens
Most people cannot read a population matrix, but anyone can read a field of plants. The Studio turns the model into something a collector, a cooperative board or a buyer can understand in seconds.
| What you see | What it means | Where it comes from |
|---|---|---|
| A field of individual plants | The population being harvested | The stage counts in the population model |
| Small, medium and large plants | Seedlings, young plants and adults | The life stage of each individual; the size key on screen explains it |
| Plants thinning or filling in as years play | Whether the population shrinks or recovers | The same yearly projection used in the growth rate chart |
| A harvest slider (for example 0, 10, 25 or 50 percent) | How much of the harvested part is taken each year | The harvest dose response applied to the plant part (rhizome, bark, resin, leaf, fruit) |
| Species specific 3D plants | What the real plant looks like | Compressed 3D models for the signature species, generic models by growth form for the rest |
How a user gets there. From the globe, a user picks a case such as Jatamansi in Nepal and presses "Simulate this". The Studio opens with that species, that plant part and that region already loaded, so there is no setup.
Why it matters for a product. The Studio is the conversation starter. A cooperative leader can show members what 25 percent harvest does over ten years without a single equation. A buyer can see why a supplier is choosing a lower harvest. Because the picture and the numbers come from the same simulation, the 3D view never tells a different story from the charts.
What it refuses to do. When the species only has a generic model (tier B or C), the Studio says so on screen. It is a way to understand a model, not a way to set a quota.
6.2 The globe: one screen instead of six websites
Without EthnoHarvest AI, checking one plant in one valley means opening a checklist site, a GBIF map, a CITES page, a climate dataset, a forest loss map and a fire map. On the globe these are layers on one view.
- Click a region to see its climate, tree cover loss, recent fires and land cover in one panel.
- Turn on the native range to see whether the plant is native, introduced or not recorded in that region. The app adds that "not recorded" is not proof of absence.
- Open the dossier for photos, documented uses, CITES status and the Name Check, which shows whether the two world checklists agree on the name.
- Read the answer box, which says plainly whether a safe local harvest rate can be estimated yet, and what is missing.
6.3 The Evidence Planner: a shopping list for the next field season
The planner answers the question every small team has: "We have 20 person days. What should we measure?" It does not just rank items; it picks the combination that unlocks the most decisions, because some evidence is only useful together. Each item carries a plain reason, such as "bark harvest removes large trees, so measure large tree survival first". The output is a list a field team can take into the season.
6.4 Harvest Methods: how the part is taken
Each species has a page showing how its harvested part is collected, with an illustration, numbered markers on the relevant parts and the caveats that matter for that method (for example, tapping depth for resin, or the fact that digging a rhizome kills the plant). Every illustration annotated with AI is labelled as such, and the names and facts drawn over it come from our own data.
6.5 HarvestOps and the Harvest Passport: from the field to the buyer
This is where EthnoHarvest AI stops being a research tool and becomes an operations tool.
| Stage | What the user does | What the app does |
|---|---|---|
| Collect | Records the area, the species, the plant part and the fresh weight | Creates a Harvest Passport with its own ID |
| Dry and store | Records the dry weight and drying method | Tracks stock and the ratio of fresh to dry weight |
| Attach documents | Uploads the collection authorisation, the transport slip and similar papers | Reads each document and checks it against the passport |
| Check | Reviews the flags | Flags problems such as an authorisation that covers leaves while the passport covers bark, an expired date, a synonym or a wrong species |
| Sell or recall | Shares the passport with a buyer, or traces a batch back if there is a problem | Keeps the full record, so any batch can be traced to where and when it was collected |
Every passport page states clearly that a Harvest Passport is not a permit. In the demo, all documents are synthetic and watermarked.
6.6 The Workflow Builder: make your own checks
The 19 agent components are building blocks. An organisation can chain them into its own routine, for example: check the name, look up CITES status, apply the regulation card for the country, run the eligibility gate, then list evidence gaps. A certifier could run the same workflow on every supplier; a researcher could run it on a list of species. Every run shows its run graph, so the result can be audited.
7. More than a research tool: EthnoHarvest AI as a product
EthnoHarvest AI is built on research, but it is designed to be used every season by people who are not scientists.
7.1 Product principles
| Principle | What it means in the app |
|---|---|
| One question per screen | Each page answers one plain question: is the name right, where does it grow, what happens if we harvest, what should we measure, is this batch in order |
| Show, then explain | The 3D field and the globe come first; charts and numbers are one click away |
| Honest by default | Missing data is shown as missing; "not yet" is a valid answer, with the next step attached |
| Ready made starting points | A case library and demo passports mean a new user sees a working example before entering any data |
| Every claim traceable | Each fact links to its dataset, licence and version; each AI claim quotes its source |
| Runs on a laptop | No special hardware or paid cloud services are needed to run the full stack |
7.2 One product, many jobs
| User | The job they hire EthnoHarvest AI for | Main screens |
|---|---|---|
| Cooperative manager | Plan the season, explain harvest choices to members, keep batches in order | Studio, Planner, HarvestOps |
| Collector | See what different harvest levels do, learn the right method | Studio, Harvest Methods |
| Field researcher or NGO | Decide what to measure on a small budget, gather published evidence | Planner, Evidence agent |
| Buyer or herbal product company | Check suppliers' batches before purchase, keep a recall record | HarvestOps, Workflow Builder |
| Certifier or auditor | Run the same checks on every supplier and keep an audit trail | Workflow Builder, run graph, HarvestOps |
| Regulator or CITES authority | See the evidence behind a harvest request in one place | Globe, dossier, evidence tiers |
7.3 Why someone would keep using it
- It saves work. Name, range, trade status, site conditions and published evidence are gathered in one place instead of many.
- It reduces risk for buyers. A wrong plant part or an expired authorisation found before purchase avoids a rejected shipment or a legal problem.
- It helps cooperatives sell. A clean, traceable Harvest Passport is a stronger offer to a buyer who must prove responsible sourcing.
- It gets better every season. Each measurement a cooperative collects fills a gap in the gate, moving a species from "not yet" toward a locally supported answer.
7.4 How it could be sustained (proposed)
These are plans, not current customers or revenue.
| Model | Who | What they get |
|---|---|---|
| Free | Harvesting cooperatives, community groups, students and researchers | The full app, open source, running locally |
| Paid hosted service | Buyers, herbal product companies, certifiers | Hosted backend, supplier dashboards, shared passports and workflow runs |
| Grants and partnerships | Conservation NGOs, development agencies, botanical gardens | Pilots in specific regions and support for new species |
7.5 Path to adoption
- Pilot with one Jatamansi cooperative in Nepal (planned), using the Studio and Planner before the season.
- Add HarvestOps for that cooperative's batches and one partner buyer.
- Expand to the other signature plants, Prunus africana and Boswellia, with local partners.
- Open the Workflow Builder to certifiers so the same checks run across many suppliers.
8. Data at a glance
| Number | What |
|---|---|
| 1,448,984 | plant names scanned in Kew's World Checklist of Vascular Plants (WCVP) |
| 365,813 | accepted vascular plant species in it |
| 1,995,338 | native range records read and mapped to 369 world regions |
| 9,178 | population matrix models checked (COMPADRE v6.26.3.0) |
| 812 | plant taxa from 546 studies in 64 countries |
| 200 | medicinal taxa with population models |
| 752 of 812 | names on which Kew and World Flora Online agree; 17 disagreements shown to the user |
| 3,447 | documented medicinal use records from 870 references (USDA Dr Duke, Herbolario) |
| 13 | open data sources, each with its licence and version recorded |
| Question the user asks | Dataset |
|---|---|
| Does harvest change population growth? | COMPADRE Plant Matrix Database |
| Is the name right? Where is it native? | Kew WCVP and World Flora Online |
| Where has it been seen? | GBIF (including iNaturalist research grade records) |
| Is it traded internationally? | CITES Species+ |
| What is the climate? | WorldClim 2.1 and NASA POWER |
| What threatens the site? | Global Forest Watch, NASA FIRMS, ESA WorldCover |
| When does it flower? | PhenObs (Zenodo) |
| Is it medicinal? | USDA Dr Duke database and Herbolario (documented use only) |
Not used yet, with the honest reason: the IUCN Red List API (token pending) and TRY plant traits (requires a reviewed data request). Both slots are already in the layer list, marked pending, and are never filled with defaults.
9. Scientific rigour: what worked and what did not
We registered 15 experiments before running them, with a fixed random seed. Every result is saved as a JSON file with the exact command that produced it. Six were negative or inconclusive, and we published them all and changed the app because of them.
| Experiment | Finding | What we changed in the app |
|---|---|---|
| E03 Jatamansi harvest reproduction | Same ordering as the published paper; 0.036 loss in growth rate per extra 10 percent harvest | Used as the reference case |
| E04 Does harvest lower growth across 8 studies? | 6 of 8 lower, but not significant (p = 0.29) | No transfer of a harvest effect between species |
| E05 Can generic removal models predict the experiment? | No; error of 0.068 in growth rate | Model only results carry a warning and never become harvest advice |
| E09 Does an independent demography archive replicate? | No clear answer | Not used for decisions |
| E10 Habitat model accuracy | Spatial AUC 0.786; random validation would have overstated accuracy by up to 0.19 | Only spatial cross validation is used |
| E11 Does AI triage papers better than keyword rules? | No; macro F1 0.768 versus 0.773 | AI stays advisory; rules decide |
| E13 Does our planner beat a greedy choice? | Equal or better in 24 of 24 budget cases, strictly better in 15 | Planner used for evidence plans |
| E14 Does harvest hurt Khaya bark in a stochastic model? | No detectable penalty | Shown as inconclusive, not used |
| E15 Do poor quality matrices change answers? | Yes; 15 percent fail quality control and 9 species shift growth rate by more than 0.05 | Failing matrices are excluded |
Document checks. On 13 synthetic document packets (37 PDFs written by us and watermarked), rules alone found 14 of 15 planted problems with zero false alarms. With the grounded AI, all 15 were found. A held out layout the rules had never seen was flagged as "fields not found" rather than passed.
Testing. 140 Python tests and 35 browser tests, all passing.
10. Who uses it and how they benefit
| User | Their question | How EthnoHarvest AI helps |
|---|---|---|
| Harvesting cooperatives and collector groups (for example, rhizome collectors in western Nepal; this is an illustrative persona, not a current customer) | How much can we take, and can we prove where our batch came from? | Name and CITES check before the season, a clear "not yet" with the missing evidence listed, and a Harvest Passport that catches document problems before the buyer does |
| Field researchers and conservation NGOs | What should we measure first with a small budget? | A budgeted evidence plan with reasons for each species, built on published population models |
| Forest and wildlife authorities, CITES scientific authorities | Is this harvest supported by evidence? | Transparent evidence tiers, native range checks and regulation cards, with every source cited |
| Buyers, herbal product companies and certifiers | Is this batch correctly named, legally collected and traceable? | Document checks for wrong plant part, wrong species, synonyms and expired authorisations, plus stock and recall records |
| Pharmacognosy and ethnobotany researchers | Which medicinal plants are at risk, and where is the evidence weakest? | One place combining names, ranges, demography and documented uses, with every gap shown |
A season with EthnoHarvest AI, for a cooperative:
- Before the season: check the name, the native range and the CITES status, and see what evidence is missing.
- Plan: spend the measurement budget on the items that unlock the most decisions.
- Harvest: a Harvest Passport records the area, the part taken, the weights and the drying.
- Sell: documents are checked automatically, so problems are caught before the buyer sees them.
11. Responsible research
| Principle | What EthnoHarvest AI does |
|---|---|
| Licences and attribution | Licence and credit stored for every dataset and every photo; COMPADRE raw data is never redistributed |
| Privacy | Coordinates of sensitive species are generalised to 0.1 degrees; uploads stay private |
| Indigenous and traditional knowledge | No traditional knowledge is collected or stored; only published, licensed records are used |
| Scientific integrity | Unknown is never zero; negative results are published |
| No medical claims | Medicinal use is shown as "documented use", never as efficacy |
| No false authority | No quotas, permits or safe rates are ever issued |
| Responsible AI | AI is advisory, quotes its sources word for word, is clearly labelled and was benchmarked against rules (E11) |
| Synthetic data | All demo documents are synthetic and watermarked |
12. How we built it
| Layer | Tools |
|---|---|
| Backend | Python, FastAPI, SQLite |
| Science | NumPy, SciPy, matrix population models, LTRE, PuLP (integer linear programming), Shapely for spatial range overlap |
| Frontend | React 19, TypeScript, Vite |
| Visuals | CesiumJS globe, Three.js 3D studio |
| AI | Evidence agent with verbatim quote checks and a second model verification step; AI annotated illustrations reviewed by eye and labelled |
| Testing | pytest (140 tests) and Playwright (35 browser tests) |
| Hosting | Frontend demo on Vercel; full stack runs locally |
Security. API keys stay on the server and are never committed or sent to the browser.
13. Challenges we ran into
- Joining two world checklists. Kew and World Flora Online sometimes disagree on names. Rather than silently choosing one, we show the 17 disagreements to the user.
- Scale. Reading 1.4 million names and 2 million range records and mapping them to 369 world regions had to stay fast enough to rebuild on a laptop. The full checklist build reruns in about 35 seconds.
- Making science readable. Population models are hard to explain. The 3D Studio was our answer: plant size shows life stage, so the model becomes a picture.
- Our own AI did not win. Experiment E11 showed the AI was no better than keyword rules at triaging papers, so we kept rules in charge and made the AI an advisor.
- Hosting. The backend is too heavy for free hosting tiers, so we deployed the frontend on Vercel and documented the local setup.
14. Accomplishments we are proud of
- A tool that is honest by design: it says "not yet" instead of guessing.
- A reproduction of a real Jatamansi harvest experiment from published population models.
- A 3D Studio that lets anyone see what a harvest does, driven by the same model as the science.
- 15 preregistered experiments, with every failure published and acted on.
- A full chain from the globe to the warehouse in one working app.
15. What we learned
- A missing value must never be treated as zero, in code or in conservation.
- Spatial validation matters; random validation would have overstated our habitat model accuracy.
- Negative results are useful; four of our app's rules exist because an experiment failed.
- AI is most useful when it must show its sources and is tested against simple baselines.
- People trust what they can see. Showing a model as a living field made it far easier to explain than any chart.
16. Limits and future directions
| Honest limits today | Next six months | Why it scales |
|---|---|---|
| Habitat models for 2 species only | Pilot with one Jatamansi cooperative in Nepal (planned) | Any of the 200 COMPADRE medicinal taxa works today; new plants enter as tier C, never with invented data |
| Jurisdiction rules for 4 countries | Add IUCN Red List and TRY plant traits | Open data and open source; runs on a laptop |
| AI illustrations not yet reviewed by experts | Expert review by pharmacognosists and ethnobotanists | Rules are versioned, so each country can add its own |
| Demo documents are synthetic | A real document benchmark with a cooperative | Name and range checks already cover 365,813 species |
| Backend not publicly hosted | Hosted backend with caching for the heavy layers |
Further directions:
- Offline mobile mode for collectors in areas without internet.
- Multilingual interface, starting with Nepali, Amharic and French.
- Links to certification schemes such as FairWild.
- Community controlled data sharing, so cooperatives decide what leaves their hands.
- Shared Harvest Passports that a buyer can open directly from a QR code on the batch.
17. Key references
- WHO Global Report on Traditional and Complementary Medicine, 2019.
- Royal Botanic Gardens Kew, State of the World's Plants and Fungi, 2020 and 2023.
- TRAFFIC and IUCN, Wild at Home, 2018.
- TRAFFIC, Jatamansi trade from Nepal.
- Paudel et al. 2023, PNAS Nexus.
- CITES Plants Committee, PC25 Doc 27 (Prunus africana).
- Stewart 2003, CIFOR (Prunus africana).
- Bongers et al. 2019, Frankincense in peril, Nature Sustainability 2:602.
- Ghimire et al. 2008, Journal of Applied Ecology 45:41.
- Govaerts et al. 2021, The World Checklist of Vascular Plants, Scientific Data 8:215.
- COMPADRE Plant Matrix Database, version 6.26.3.0.
- World Flora Online.
Evidence before extraction.
Eco Roots: Shruthi and Vishnu

