Inspiration
We often think about how we affect the environment in our daily lives. However, it's easy to neglect the ways in which our environments affect us.
One of the environments in which we spend the most time -- our homes -- are often not fully suited to our needs. Common problems such as poor ventilation, a lack of light, and harmful chemicals from building materials can significantly degrade our health and quality of life. Despite the real harms they present, these issues often go ignored because they have become normal to us.
The ESPresso Home Air Quality Monitor aims to promote a healthy home environment by bringing awareness to common air quality and lighting problems.
What it does
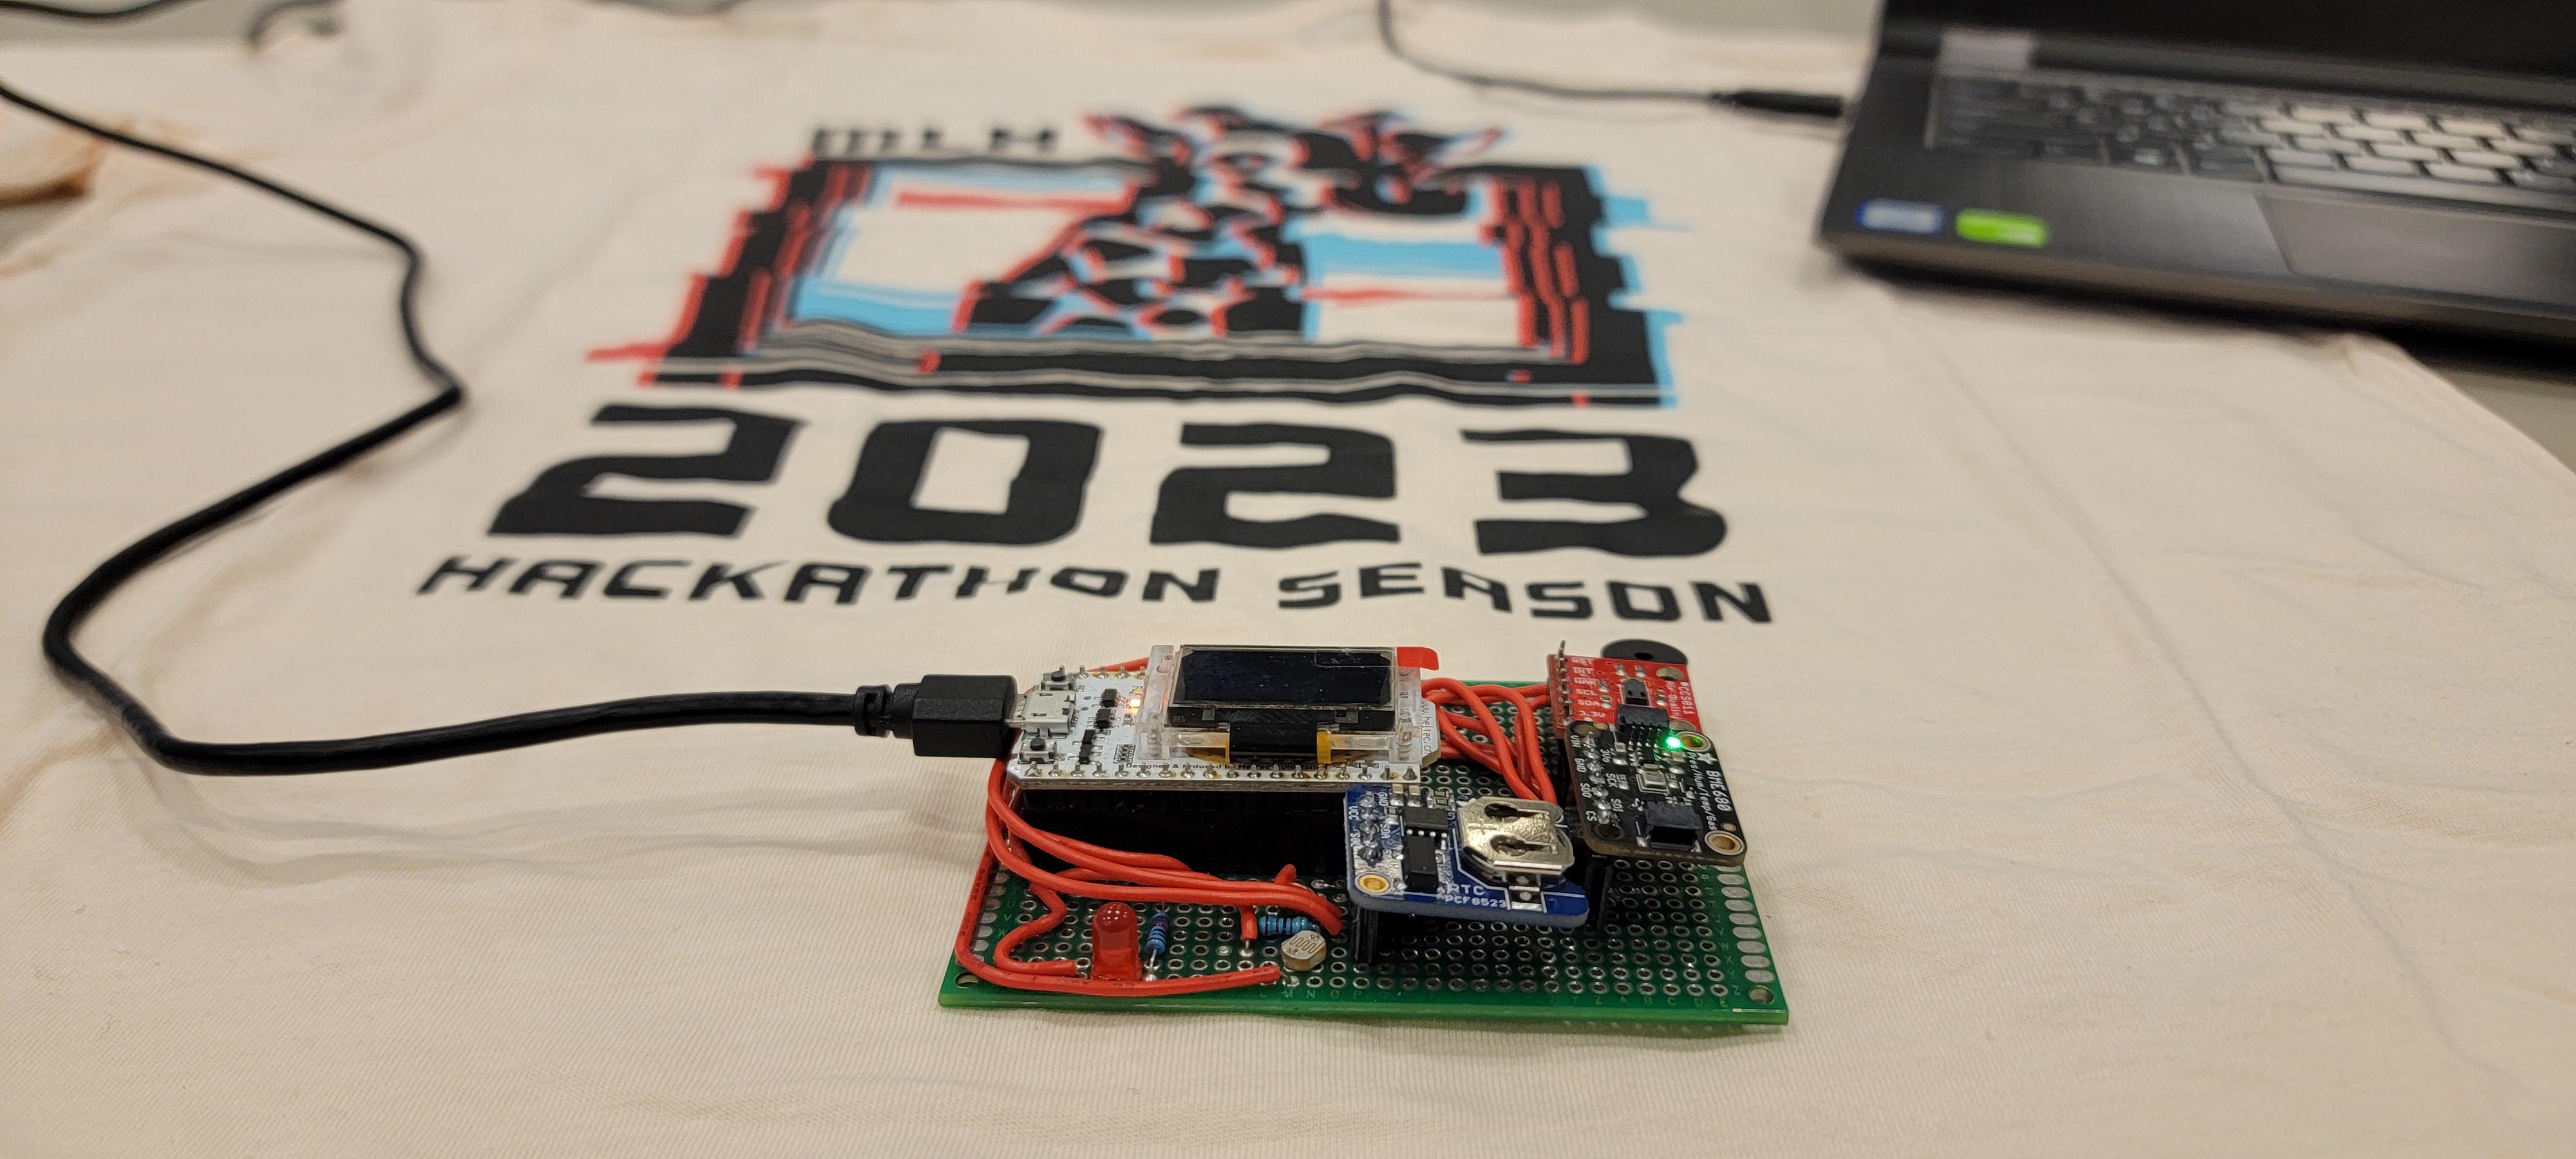
The ESPresso is a sensor box that sits in a common area of the home, such as a bedroom or living room, and measures air quality and lighting levels. Specifically, it measures temperature, humidity, barometric pressure, VOC (volatile organic compound) air concentration, carbon dioxide air concentration, and ambient light level. Readings are taken at a set interval and stored in memory for later access. The box also has an emergency warning feature: if the air quality ever drops below a certain threshold, a warning buzzer sounds to notify anyone in the vicinity.
The device hosts a web server over WiFi which provides a REST API for accessing the sensor data. As a result, any WiFi-enabled device can connect to the ESPresso and request data.
We have developed a front-end for the ESPresso in the form of a mobile application. The app displays historical sensor readings and provides you with relevant suggestions for improving the quality of your environment (e.g. opening a window if the CO2 concentration gets too high).
How we built it
We used the following hardware to construct the sensor box:
Microcontroller:
- Heltec WiFi Kit 32 (a variant of the ESP32 microcontroller with built-in WiFi)
Sensors:
- Bosch BME680 (temperature, humidity, pressure)
- DigiKey CCS811 (VOC, CO2 concentration)
- Photoresistor (light levels)
- PCF8523 (real-time clock for providing time stamps)
Other:
- Piezo buzzer (for the warning feature)
- Red LED (accompanies buzzer for warning function)
- Resistors, wires, perf-board for electrical connections
The embedded code on the microcontroller uses the WiFi.h and WebServer.h libraries to set up a WiFi access point and provide API endpoints for clients to talk to. We offer the following API endpoints:
GET {IP_address}/getstate
- Returns the current readings from all sensors, along with a timestamp
GET {IP_address}/pressure_hist
- Returns a list of the last 144 pressure readings, each with an associated timestamp
Similarly, we offer:
GET {IP_address}/humidity_hist
GET {IP_address}/temp_hist
GET {IP_address}/co2_hist
GET {IP_address}/voc_hist
GET {IP_address}/light_hist
...to provide historical data for each sensor data type.
We use relevant open-source libraries for gathering readings from all of the sensors. One exception is bsec.h, Bosch's closed-source library for interfacing with the BME680. This came in the form of a pre-compiled binary whose source cannot be inspected.
Frontend: We used Flutter a Dart framework for our front end because it is usable on all operating systems.
Flutter Packages used: http fl_chart
The app has 3 pages graphs, advice, and settings. Graphs displays all our data in form of line graphs for the user to see with timestamps on the x axis and sensor values on the y axis as well as a title at the top of the graph saying what it is. The advice section uses the graph data to give simple suggestions then displays all the advice as a list. The settings section is currently an about section with the teams contact and contributions.
Challenges we ran into
We ran into several challenges on the hardware/embedded side: Firstly, our BME680 air quality sensor was not returning usable gas concentration data. It returned temperature, pressure, and humidity readings as expected, but the CO2 and VOC concentrations were stuck at a default values. We got around this by checking out a CCS811 air quality sensor from the hardware table and using it to provide our gas concentration readings instead.
Secondly, we had difficulty finding an appropriate way to store historical sensor data. We tried to store the data to an SD card, but we were not able to procure the card reader breakout necessary to control it. We tried following a tutorial for directly communicating with the card without the breakout, but we were unable to make it work. In the end, we stored the sensor data in a large array in RAM. This has the drawback of lower capacity and volatility (everything gets wiped when the power is lost).
Finally, we were puzzled when several analog pins were returning zero when they should not be. We discovered that the WebServer library used an on-board ADC associated with certain pins, and thus those pins could not be used. It worked once we switched pins.
We also ran into a few challenges with the frontend: Though the front end had very few challenges it did have at least a couple. One being having graphs and being completely sure on what it will look like. Due to there not being a bunch of test data and it not being easy to test it with different scenarios. Also you cannot detect when the backend is giving bad data. This was solved by running the backend a few different times and communicating about what might get into the history requests and how to filter it out.
The other challenge faced is processing the data to give advice. To give advice you have to understand what the number value means. This is solved by thinking about in what situation would you get this value and how would we solve it. For instance if the device is detecting high levels of CO2 and high temperatures the house could be on fire.
Accomplishments that we're proud of
We're proud of getting the sensors to work reliably. The BME680 is a finicky sensor that will misbehave unless conditions are just right. Getting all of the sensors chained together on a single I2C bus and still retrieving reliable data is also a noteworthy accomplishment.
We are also proud of how well we managed to get the frontend working with with the server. The communication is very reliable.
What we learned
We now know how to host a web server/API on an embedded device; none of us had ever done that before. After this project, we are now capable of making IoT-like devices that can talk to other devices on the same network.
Working more with flutter and charts we now know that when working with data of variable size it is wise to try how the largest and smallest data sets will display on graph and whether or not it is ready for giving advice.
What's next for ESPresso
We had several ideas that proved too big to implement over the course of one weekend. These include:
- Integrating ESPresso with Google Home / Amazon Alexa to provide voice commands for easy access
- Using the built-in LED screen on the microcontroller to provide an at-a-glance summary of the air quality (e.g. showing a smiley/neutral/sad face based on the air quality).
- Accessing an online weather data API to tailor suggestions to the outside environment (e.g. you wouldn't want to open a window if it's hailing outside).
- Storing historical sensor readings on an ejectable SD card; this would enable months worth of data to be stored for long-term analysis.
If we were to take this product to market, we would likely make a custom PCB using surface-mount components. This would dramatically reduce the footprint of the device. Additionally, we would design an enclosure to house the electronics.
PowerPoint
If you would like to see a fun PowerPoint click this link link


Log in or sign up for Devpost to join the conversation.