Inspiration
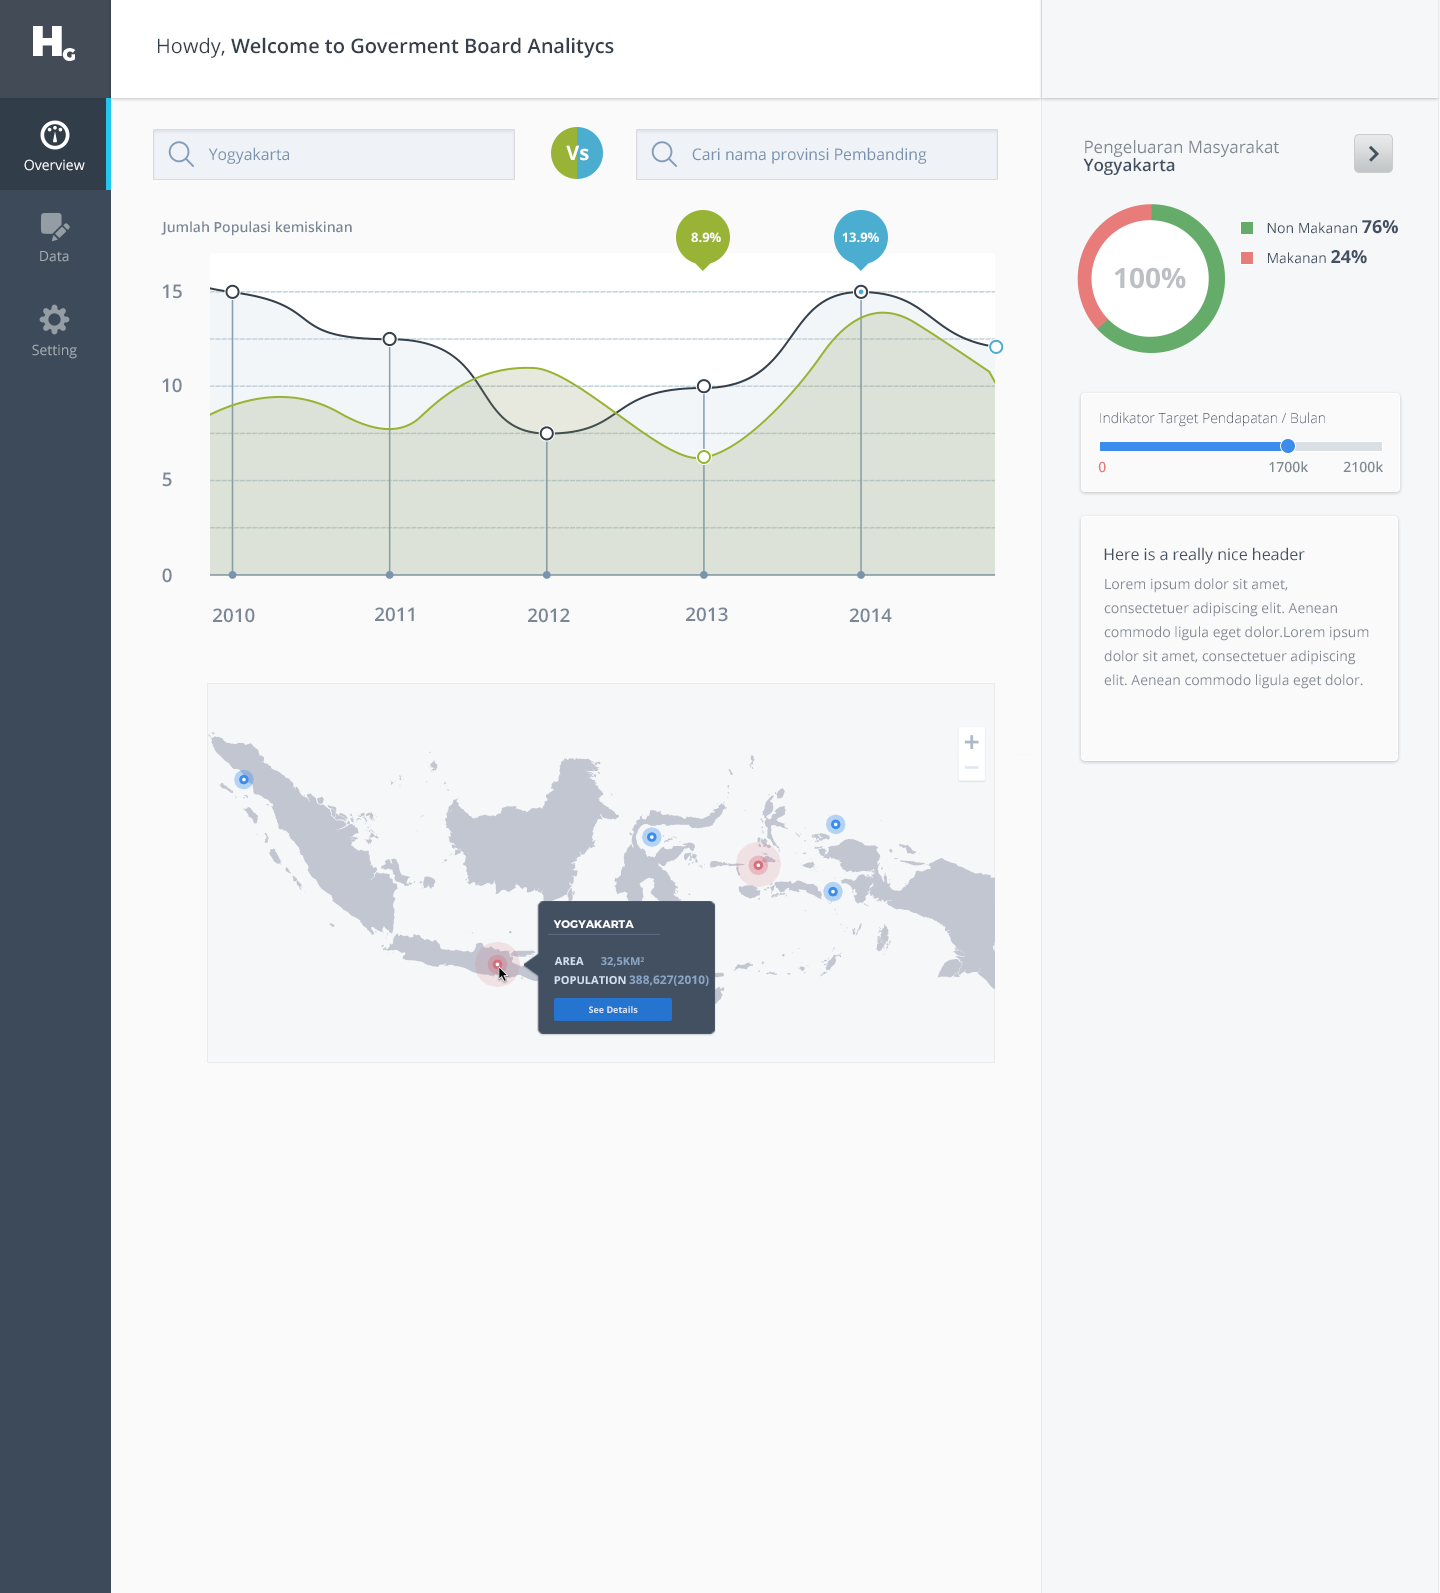
According to data from World Bank, 11.3% of Indonesians are living under poverty line. it means 27,990,026 people are living in poverty. Indonesia itself is the 4th most populated country. Number of poor people In Indonesia is more than the total population of Mozambique. Indonesia is famous for it's richness of resources. Indonesia has tremendous potential in both natural and human resources. 53% of people in Indonesia are living in the cities, and number of poverty in cities in Indonesia and 8.3% of them are living at poverty line. Those advantages should actually help The inspiration came after looking at the percentage of poverty in several provinces in Indonesia. There are some unique data of poverty in urban area of those provinces. After comparing two provinces, there are several problems that can be seen such as why the percentage of poverty between two provinces such as Jakarta and Yogyakarta are so much different? Although, both of them are located in the same island. Why the poverty percentages in those provinces are so significantly different.
What it does
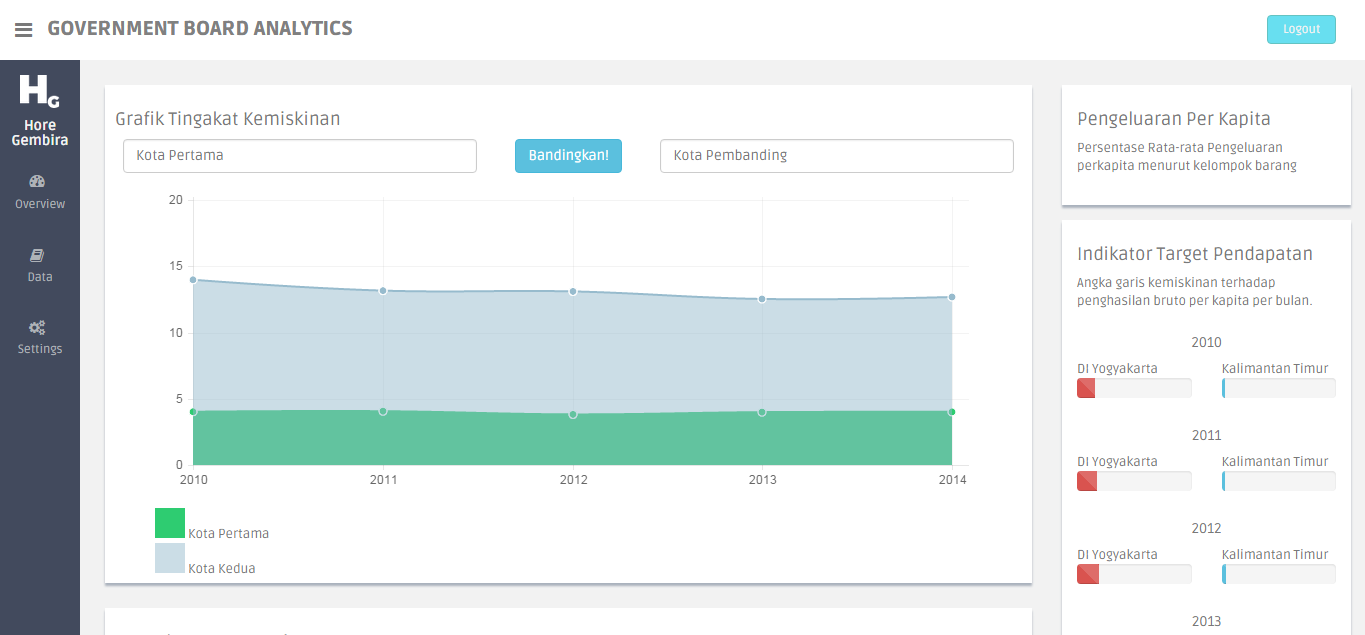
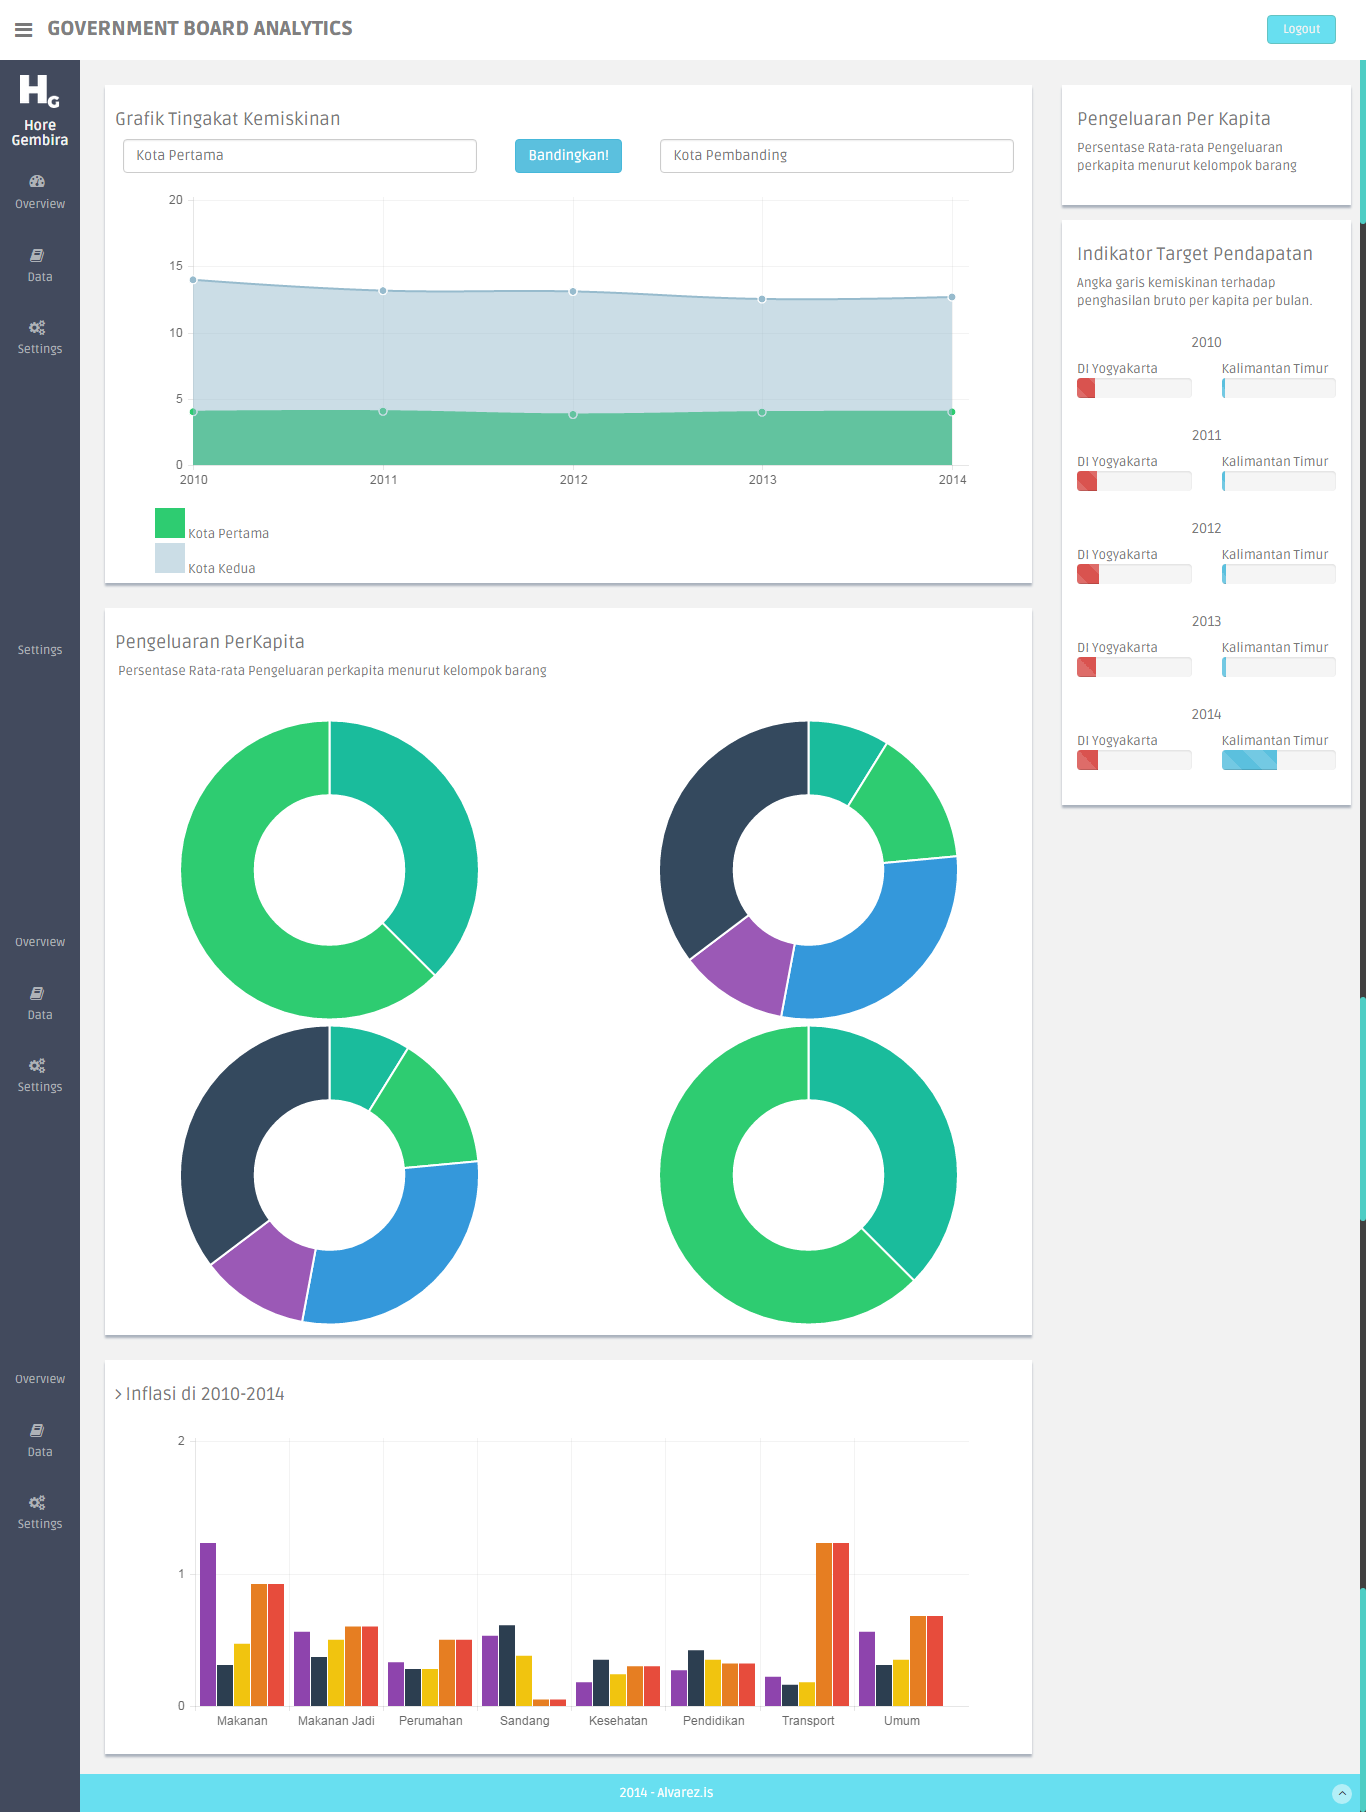
The data that we create tells the reader information about the gross domestic product of each province, the comparison of income and spending of people who's living in poverty and the inflation that causes such economic condition. There will be a graph showing the percentage of poverty in both provinces, so the reader will be able to experience the differences between two provinces. The GDP per capita and the poverty data will allow the reader to see how the development of the province by looking at it. at the end of page, there will be suggestion about what government need to do to fix the problem. as the result, the data will show the reader the point for than needs to be analyzed by looking at the poverty percentage between two provinces, the amount of income that need to be reached by people who’s living in poverty to reach the GDP of the province, and also the policy analysis to lower the inflation rate of goods and products.
How I built it
We combine several economic data to support the poverty data, such as gross domestic product per capita of several provinces, the total spending per capita per province for group of goods (food and non-food), inflation according to type of people's spending and Poverty line of Indonesian per province. by combining those data, we want to analyze the main cause of poverty and how actually people spend their income. We try to look at the percentage of income they spend for food and non-food/goods, and then we can look at the inflation that causes such condition. After looking at the graph of dataset, the reader are expected to find where the the problem is and what analysis should be used.
Challenges I ran into
the challenges is to simplify the data set so it can be visually accepted by people and how it can visualize the real problem. the dataset is so technical and needs special way to be delivered so people who's not so familiar with economic terms can make sense of the data and find the point to be analyze. another challenge is to input all of the data needed for all provinces in Indonesia. So, we decide to take several samples just to test how it works.
Accomplishments that I'm proud
The expectation to visualize the comparison between two provinces is accomplished. it happens to be the kind of dataset view that we plan it to be. We can see the significant bias in poverty distribution in Indonesia that are represented by some provinces that we have chosen.
What I learned
I learn to combine several data to create effective presentation of reality statistic data. Statistic data is not easy to be understood because the there are too many number, by creating an effective of visualization; we can see the point that needs to be analyzed. Finding the points that need to be analyzed will be a lot harder if the data is still served in statistic table.
What's next for Escaping Poverty
The next thing for escaping poverty project is combining more data and more parameter to measure the development in Indonesia so there’s no area left behind. There must be even distribution of development in Indonesia to reach one of the points of sustainable development which is no poverty. No poverty can lead to better quality of life. The other sustainable development goals can be reached if we have make sure that we have achieved no poverty goal.

Log in or sign up for Devpost to join the conversation.