Inspiration
Our TreeHacks team formed due to common career motivations in tackling climate change. We’re particularly interested in how technology can shape global finance toward climate solutions, hence our interest in the Carbon Removal Assessment challenge.
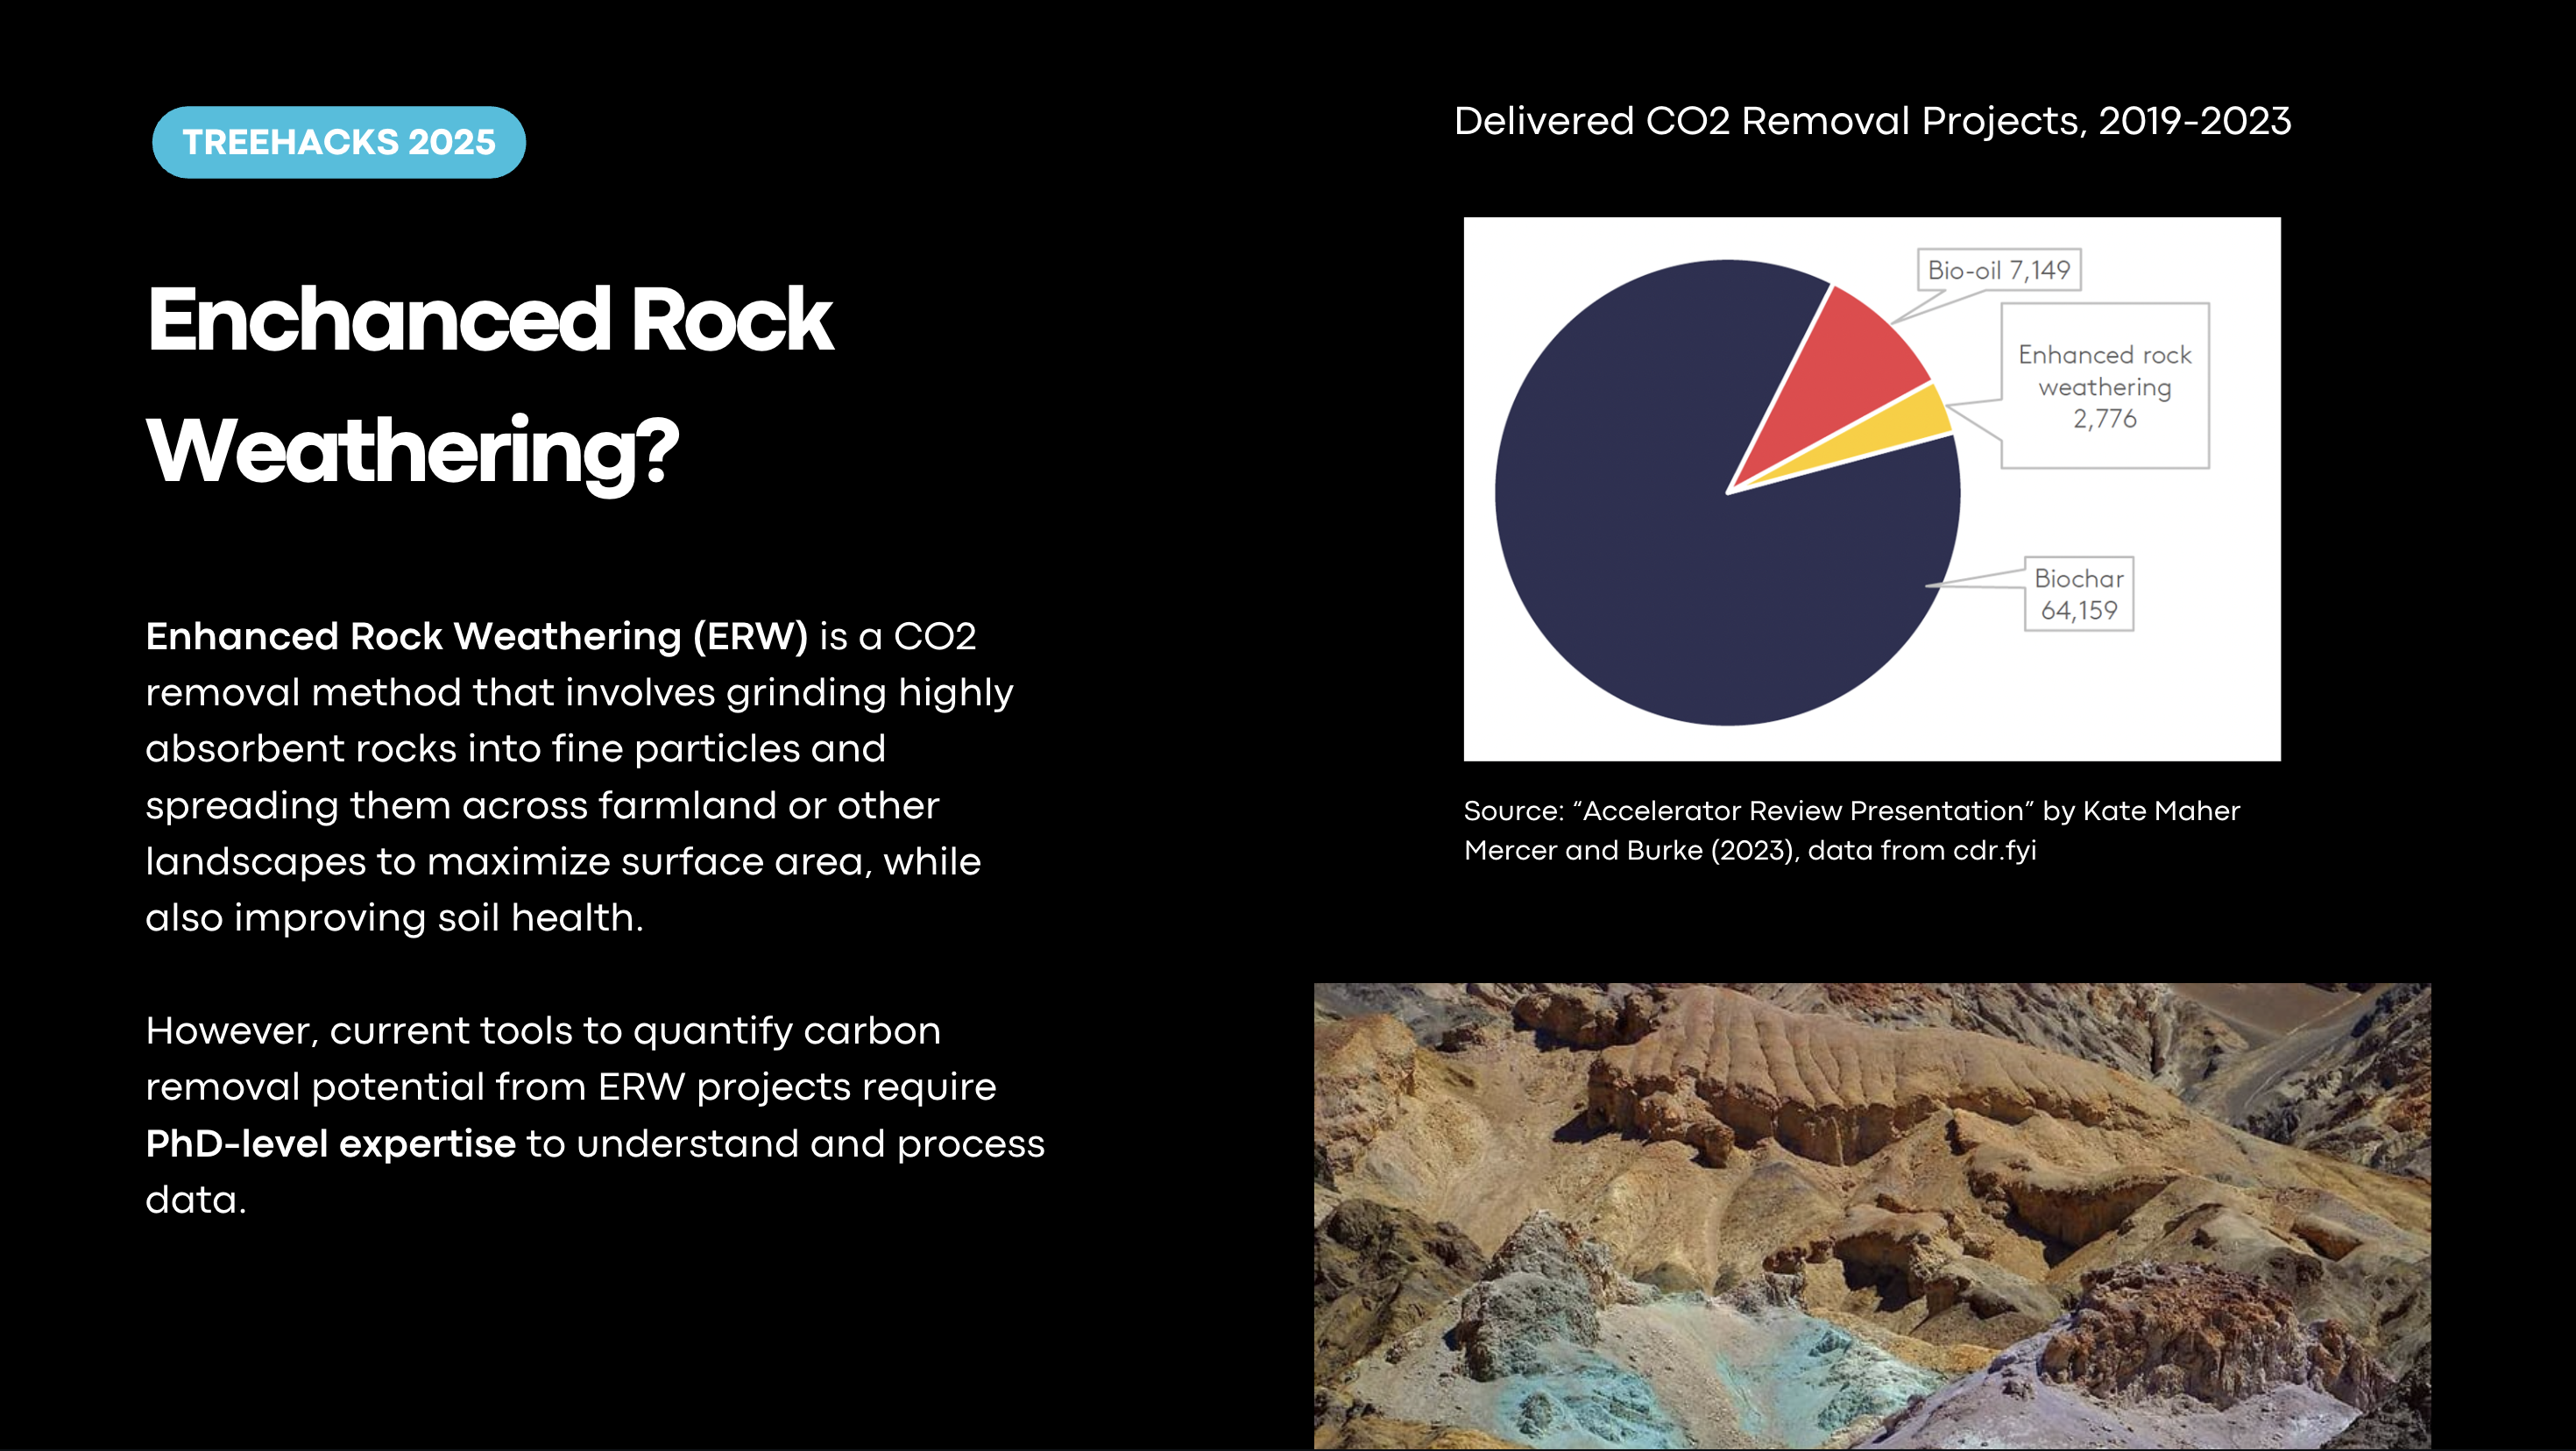
We spoke with Stanford Earth Systems Professor Kate Maher to learn about pain points in Enhanced Rock Weathering (ERW), an increasingly popular method of carbon removal, where certain species of rock with high CO2 sequestration rates are ground up and distributed to maximize reaction rates via surface area.
Forecasting the carbon removal potential of an ERW project is an esoteric process with a steep learning curve - estimates used by investors and project planners in carbon credit markets have vast uncertainty, and more scientific approaches require PhD-level knowledge and access to poorly-documented methods of accessing computational models running on Fortran and text files. There are few people in the world with the resources and experience to scientifically forecast carbon removal rates for ERW projects.
What it does
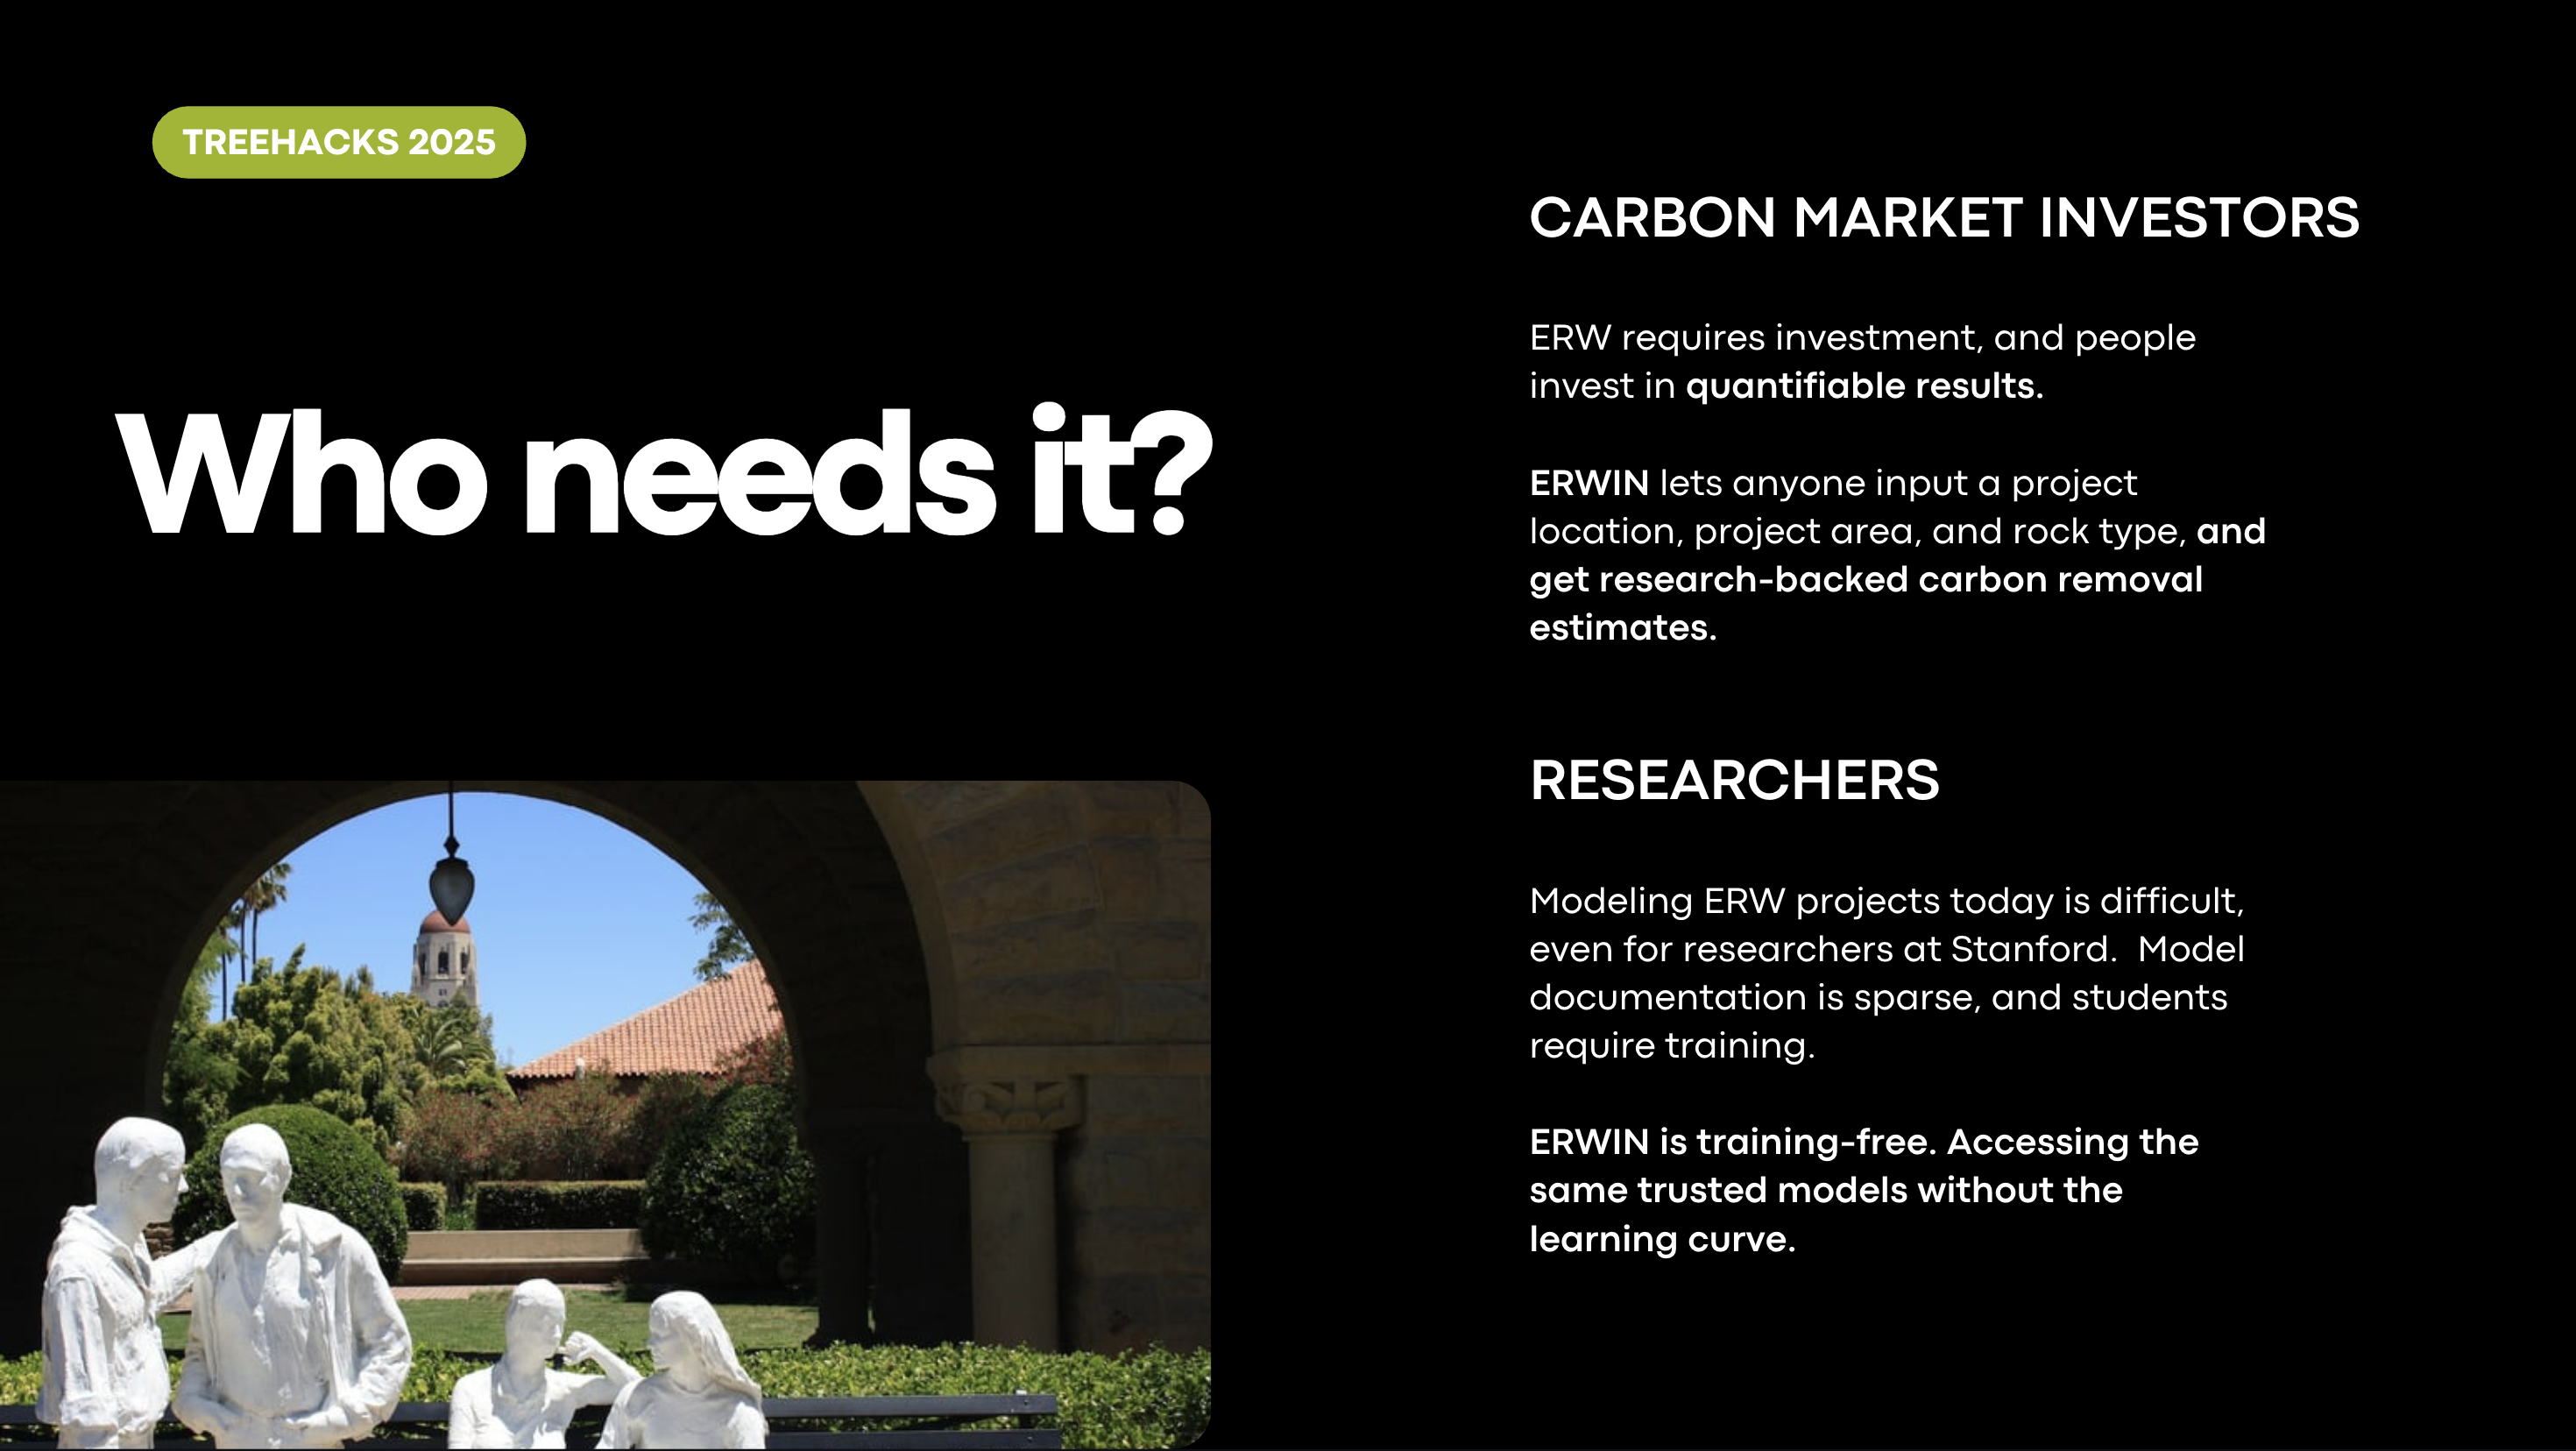
We’ve developed a visual platform democratizing ERW carbon removal assessment for any user, focusing on carbon credit markets and ERW researchers.
Now, users can select a target region for an ERW project and input simple parameters of feedstock (rock) type project area, feedstock surface density, and time series length for the output. After clicking ‘Run’, the user is presented with graphs of the CO2 removal rate per meter squared, and the pH, over time in years. The user is also presented with an estimate of the total CO2 removed over the total project area over the inputted period of years.
Accommodating our two main categories of stakeholders, we have a ‘Basic’ and ‘Advanced’ mode on the User Interface. Those less familiar with the science of ERW, such as potential investors, can choose the Basic mode to be provided with the simple data needed to observe Carbon Removal rates in selected regions. For those who are better-versed in ERW, the Advanced mode serves to provide more options and detailed information regarding the science of ERW and our calculations.
How we built it
After the user clicks ‘Run,’ ERWIN automatically retrieves a comprehensive set of soil and environmental data for the selected location and integrates it with user-provided inputs to generate and refine the data required for underlying computational algorithms. To do this, we took the latitude and longitude of the center of the user’s region of interest and used soil and weather APIs to fetch data relevant to soil carbon exchange geochemistry, such as soil composition, cation exchange rate, and mean annual precipitation, to name a few.
As an additional functionality, before the user selects 'Run,' they have the option to explore quarries recommended for their bounded location. After the user chooses a type of rock and a selected area, the toggle switch on the top left outputs n (set to 50) points with the best quarry options to obtain that rock type. This data comes from the National Mine Map Repository, pulled using Selenium and BeautifulSoup4, and stored in CSV files on a public GitHub repository. These spreadsheet-like files are named with the latitude, longitude, and rock type that they represent, and are accessed as such within the script in JavaScript.
One of the greatest challenges of carbon removal projects lies within random sampling and generating probability distributions across vast datasets. Powered by Qiskit in Python, our quantum computing system leverages quantum superposition and entanglement to significantly enhance sampling efficiency and accuracy. Likewise, our quantum processes can run on quantum computers in real-time with IBM Quantum Cloud in the present day, and these processes will become more scalable over time.
Identifying the relevant time series outputs across the many output files, based on CO2 removal relevance and scientific interest, we generated distribution curves of these prioritized datasets (ion concentration and soil pH time series), used stoichiometry to convert chemical data to CO2 removal rates, and graphed the mean curves for CO2 removal rates and pH over time with one standard deviation of uncertainty. By integrating the data under the curve, we found the total CO2 removed per m^2 across the time series and multiplied this by the project area to get the total CO2 removed over the provided project timeframe.
Overall, our key tasks were:
- Understanding ERW and carbon removal assessment needs and barriers, for carbon credits markets and researchers, with input from Professor Kate Maher and private sector stakeholders (ERW startup affiliates).
- Designing and iterating an accessible interface simplifying user input and output.
- Parsing expected input and output files to identify data types to fetch from the web/APIs, and necessary calculations/conversions to meet the required input template and output needs.
- Developing an easy-to-use user interface for users with all levels of experience with ERW.
- Building a Docker container and workflow to standardize operations across operating systems and devices.
Challenges:
The data fetched and inputted does not correspond directly to the inputs required by the computational algorithms used, and given an example input text file, it took us many hours to reverse engineer the syntax, meanings of different parameters, and units. The lack of documentation served as a frustrating barrier, but also a valuable firsthand insight into the pain point of our intended users - this lack of clarity is the obstacle faced by anyone approaching ERW carbon removal forecasting, from investors to researchers, and the problem we aim to solve. Reading up extensively on soil geochemistry formulas and methodologies and consulting Professor Maher, we were able to parse what the data meant, and the calculations necessary to fit our data to the required inputs. The same process applied to parsing the output files.
Accomplishments we’re proud of
This was our team’s first hackathon, and we’re incredibly proud of having built a solution to a real-world problem that can drive measurable climate impact, by increasing confidence in carbon removal projects through science-backed forecasts.
What we learned
We’re particularly proud of learning carbon removal geochemistry on the fly, and teaching ourselves to understand complex academic methodologies to the extent that we were able to build a simplified workflow around the necessary computations - to build a simplified model, we had to understand not only inputs A and outputs B, but also what calculations are required to get from A -> B. Within 36 hours, we built scalable digital infrastructure, a robust UI interface, and a backend interfacing with numerous APIs to fetch soil and climate data, while learning ERW science, formulas, and data representations, and meeting user needs.
What's next for ERWIN: Enhanced Rock Weathering Impact Navigator
We seek to continue our collaboration with Professor Maher and other ERW stakeholders in academia and the private sector, to receive more user feedback and better serve stakeholder needs. We also want to expand our offering of recommending ERW project locations for maximizing carbon sequestration and minimizing distance from feedstock quarries, likely supplemented with better feedstock quarry spatial data through computer vision analysis of satellite imagery.
The carbon removal project market, and particularly the ERW sector, is rapidly growing, and we see this tool having great potential for the basis of a venture accelerating a zero GHG future.
Built With
- beautifulsoup4
- crunchflow
- docker
- flask-(python)
- javascript
- mapbox-api
- open-meteo
- qiskit-(python)
- selenium
- soilgrid-api

Log in or sign up for Devpost to join the conversation.