-
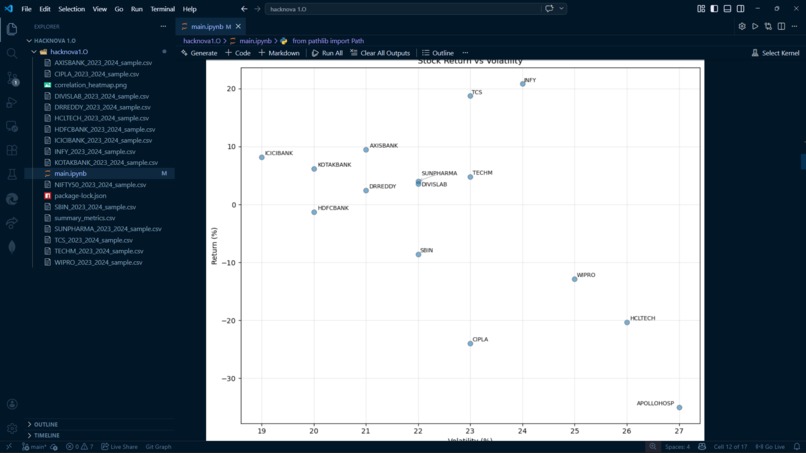
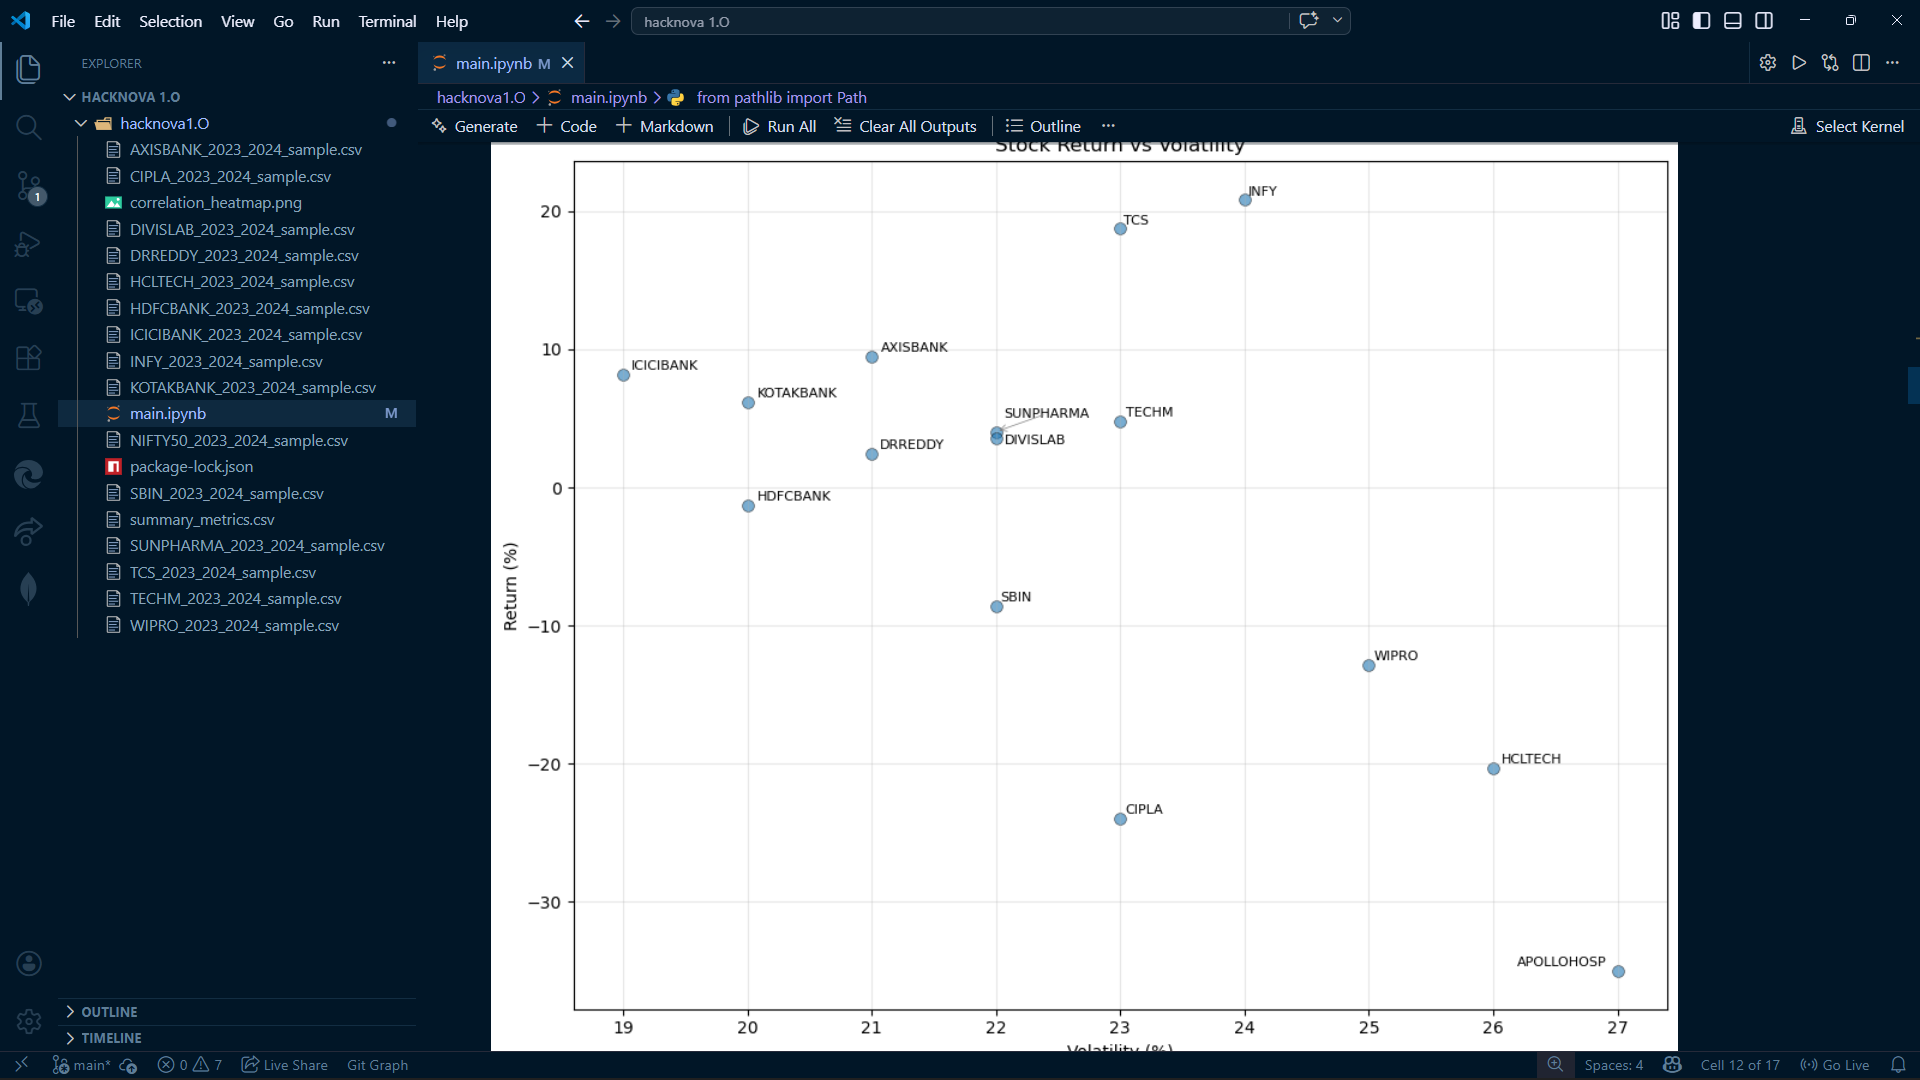
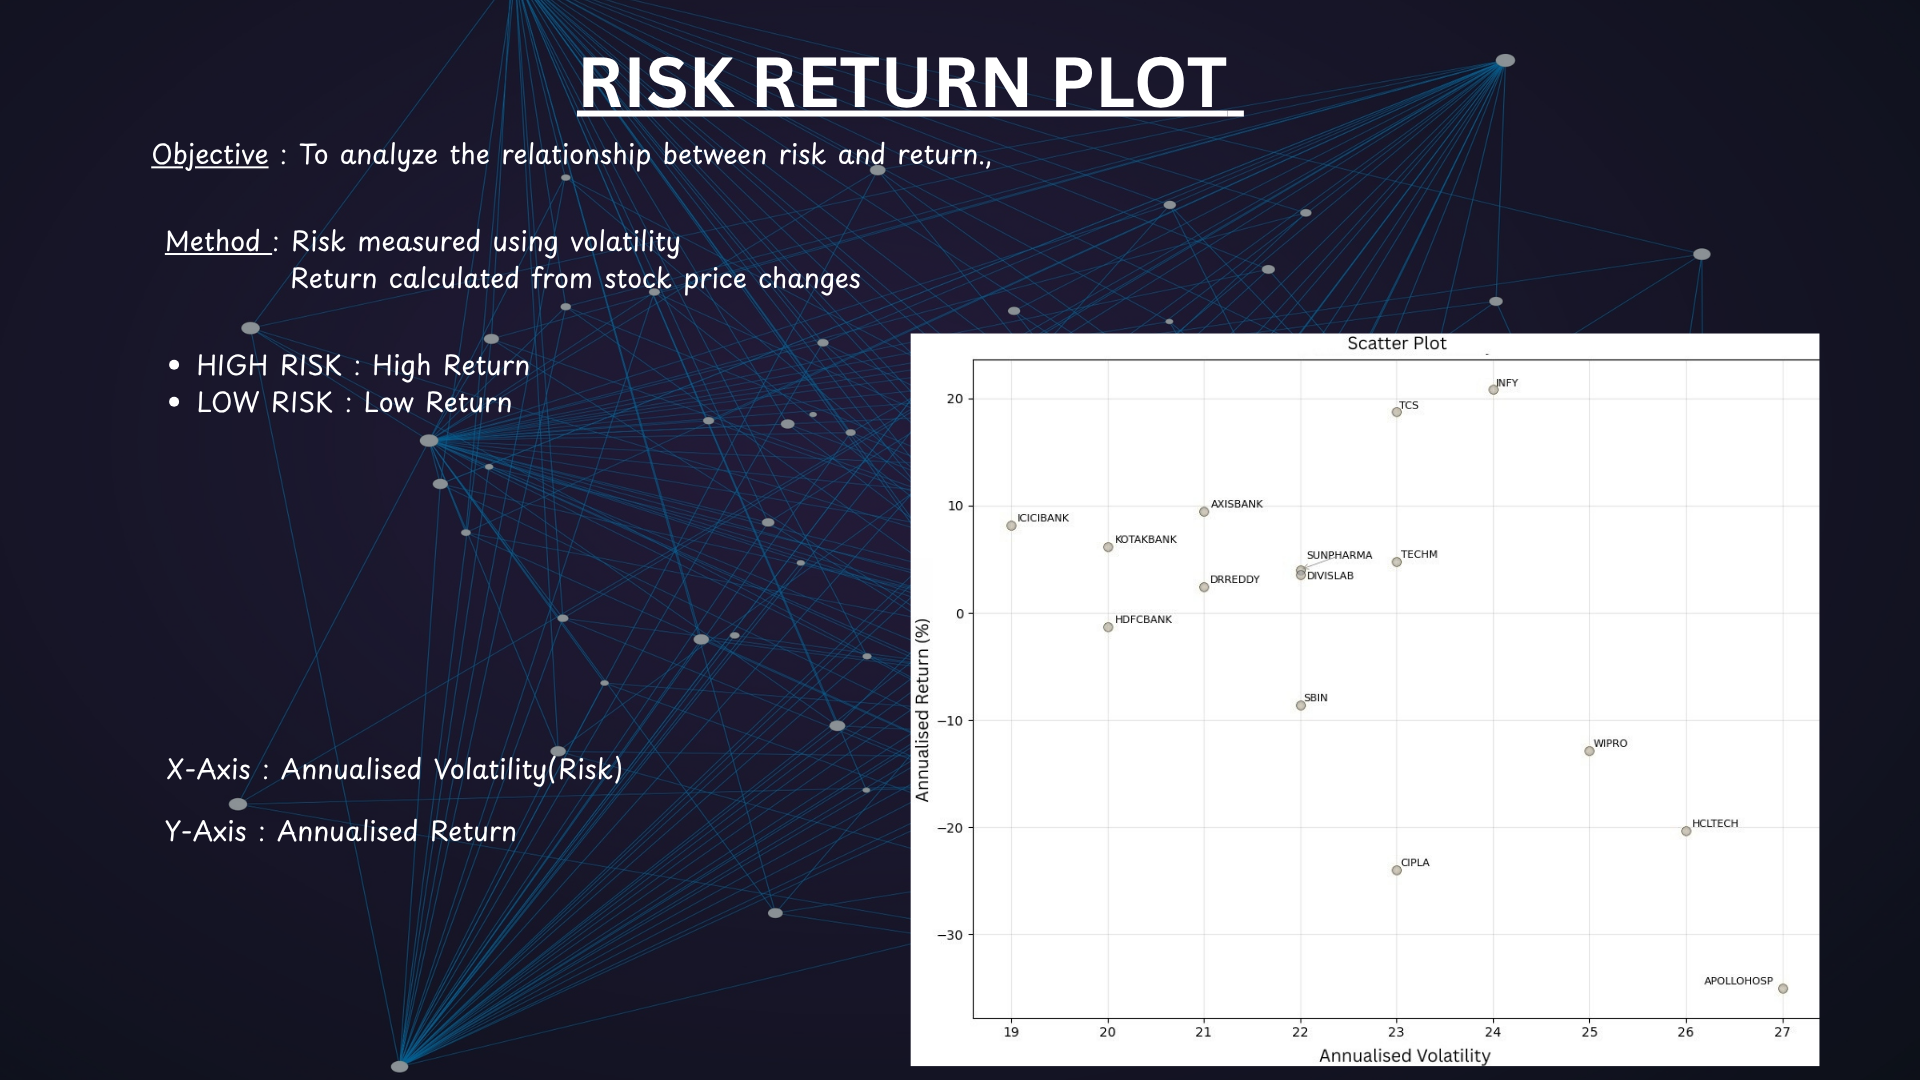
team 2 scatter
-
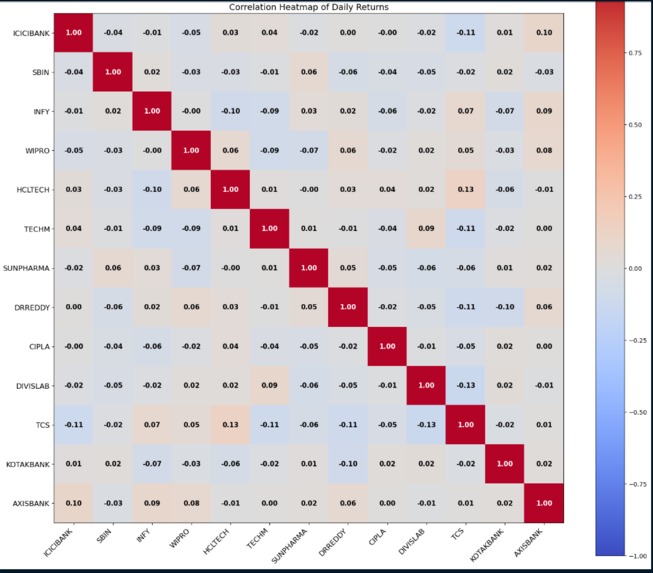
heatmap
-
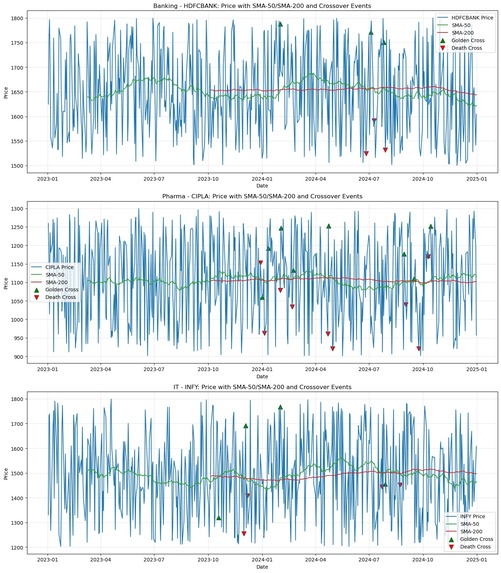
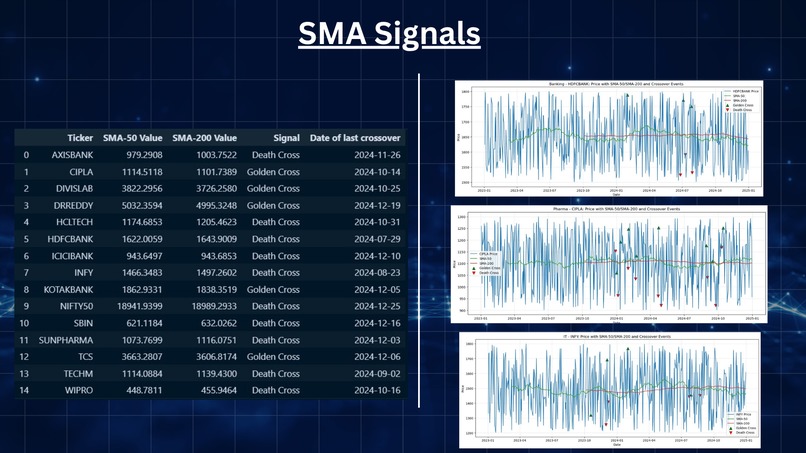
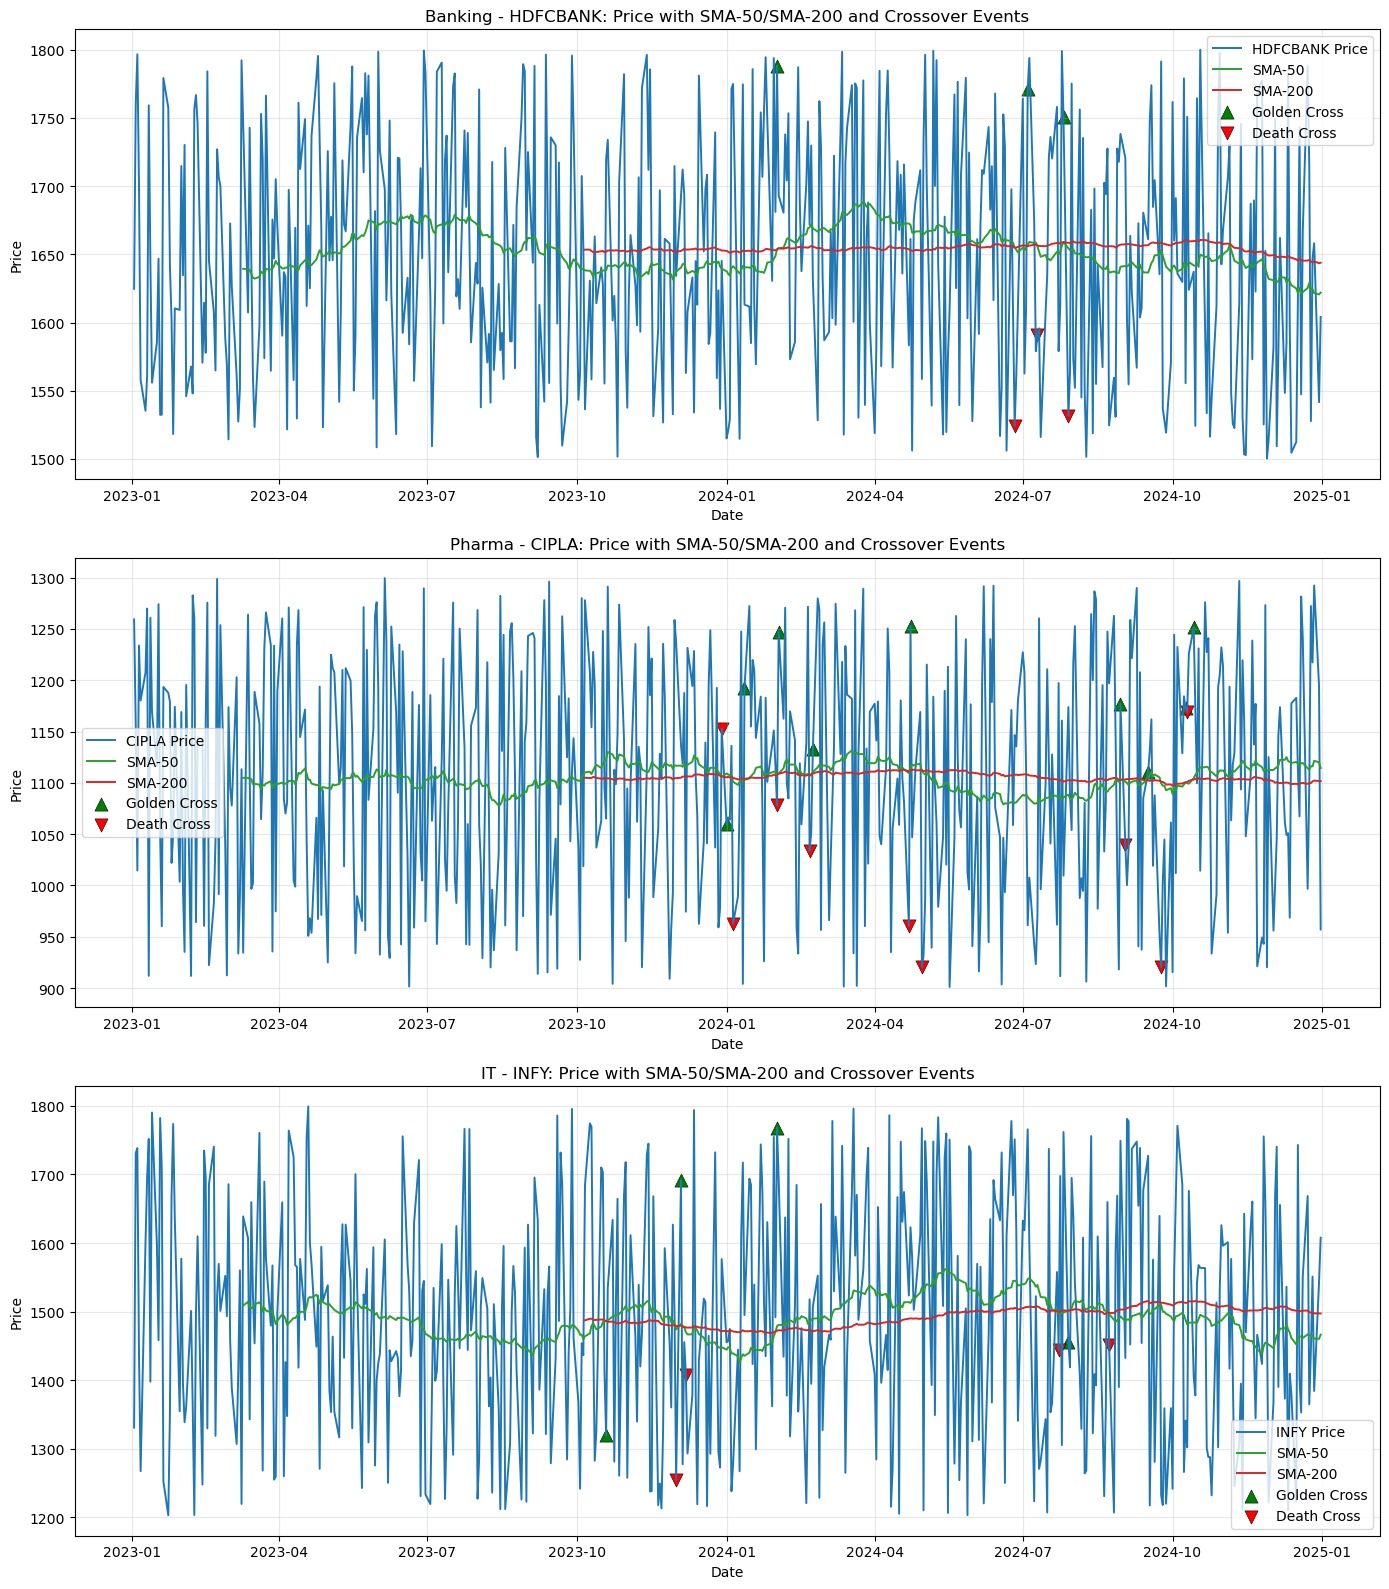
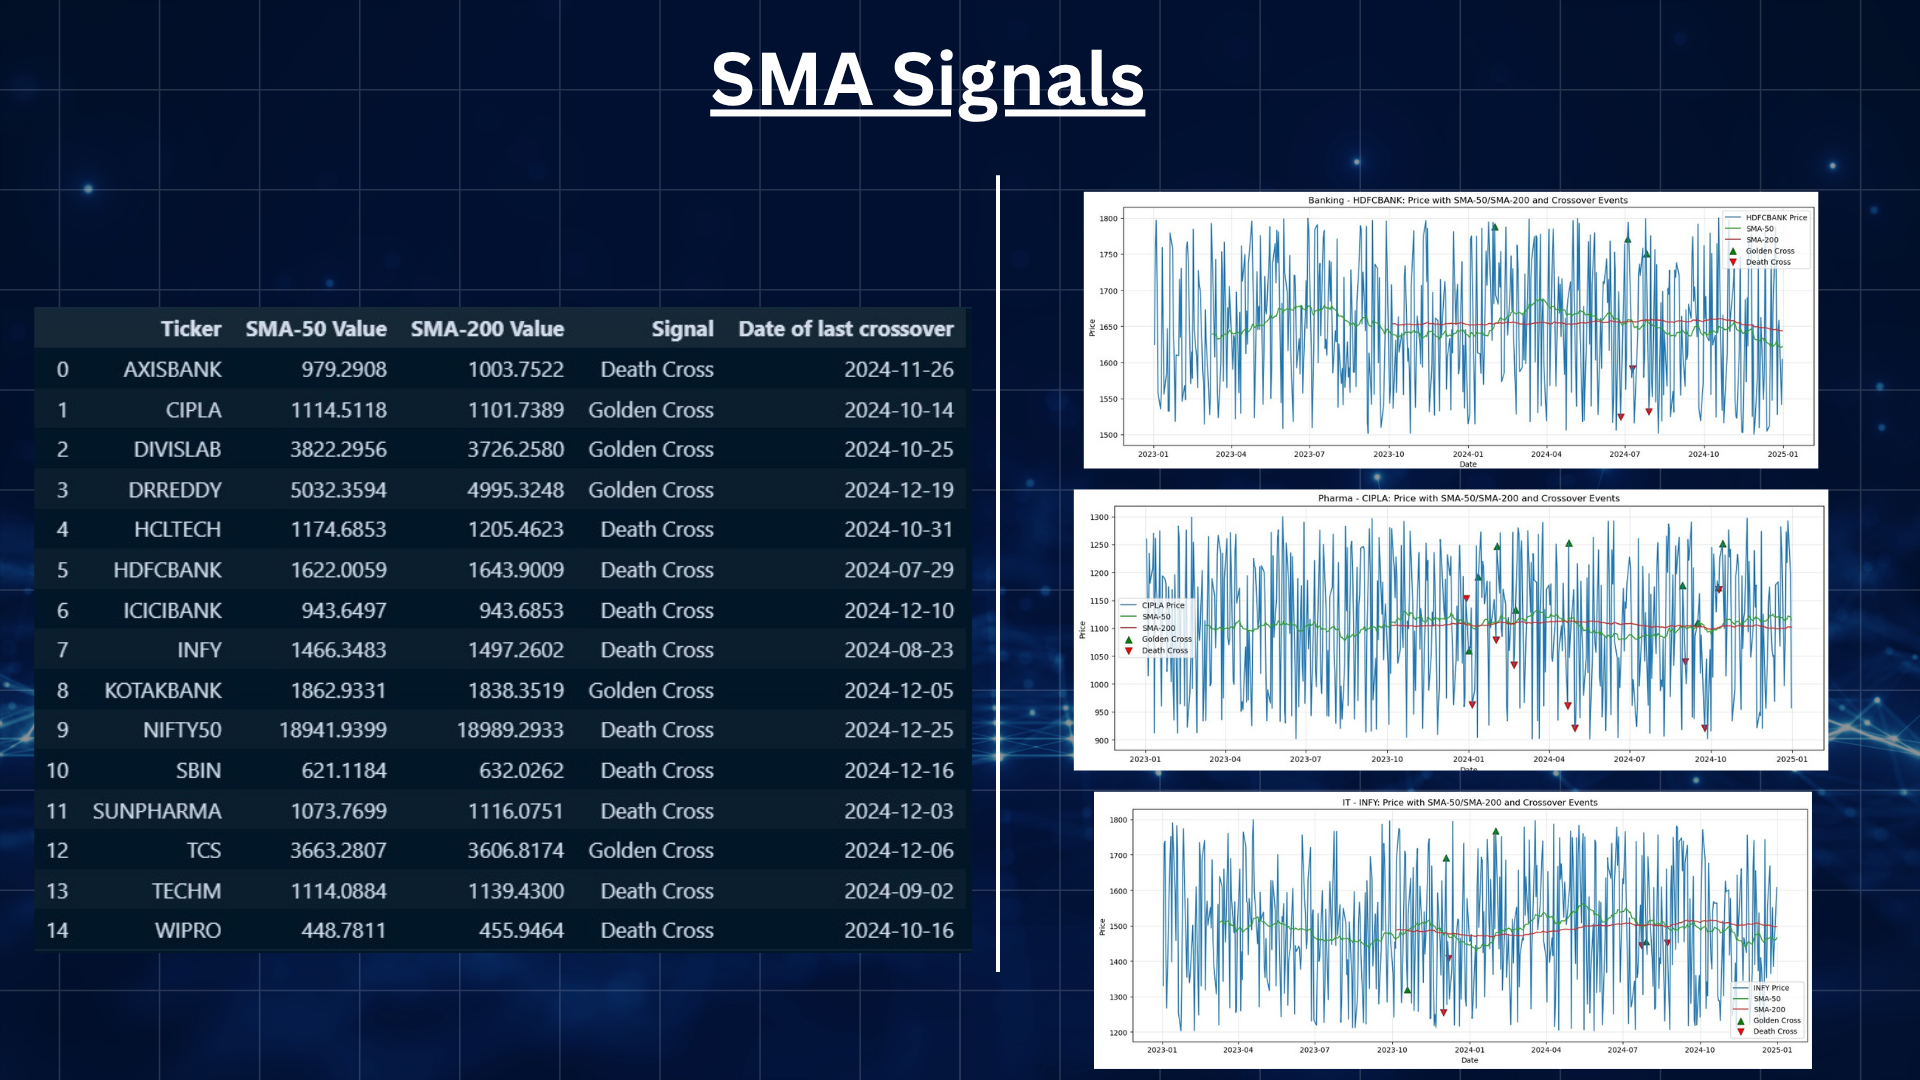
SMA signal
-
-
-

-

-

-
-
-

-


We wanted to build a project that helps people understand how risk and return work in the stock market. Many beginners invest without knowing how risky a stock is. Our inspiration was to create a simple data-driven solution that can help users compare stocks and make smarter decisions.
What it does
The Equity Risk & Return Challenge analyzes stock market data to measure the risk and return of different equities. It helps users identify which stocks are more stable, which are more volatile, and which may provide better returns over time.
How we built it
We built this project using Python, data analysis libraries like Pandas and NumPy, and visualization tools such as Matplotlib/Seaborn. We used historical stock price data to calculate returns, volatility, and compare equity performance through graphs and insights.
Challenges we ran into
One of the main challenges was collecting and cleaning stock market data properly. We also faced difficulty in understanding which financial metrics would best represent risk and return in a simple and meaningful way.
Accomplishments that we're proud of
We are proud that we created a project that turns complex financial concepts into an easy-to-understand analysis tool. We successfully combined finance, data science, and visualization into one practical solution.
What we learned
Through this project, we learned more about equity markets, risk analysis, return calculation, volatility, and financial data visualization. We also improved our skills in Python, data preprocessing, and problem-solving.
What's next for Equity Risk & Returns Challenge
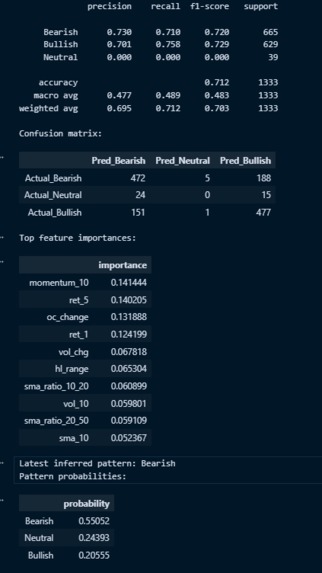
In the future, we want to improve this project by adding real-time stock data, portfolio comparison, risk prediction using machine learning, and a more user-friendly web dashboard for investors.
Built With
- matplotlib
- numpy
- pandas
- python
- scikit-learn

Log in or sign up for Devpost to join the conversation.