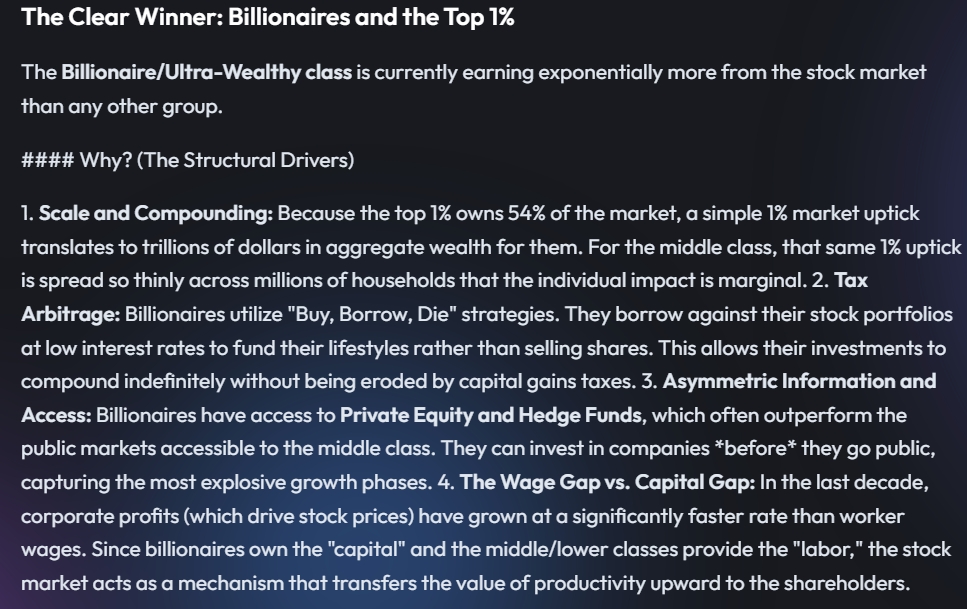
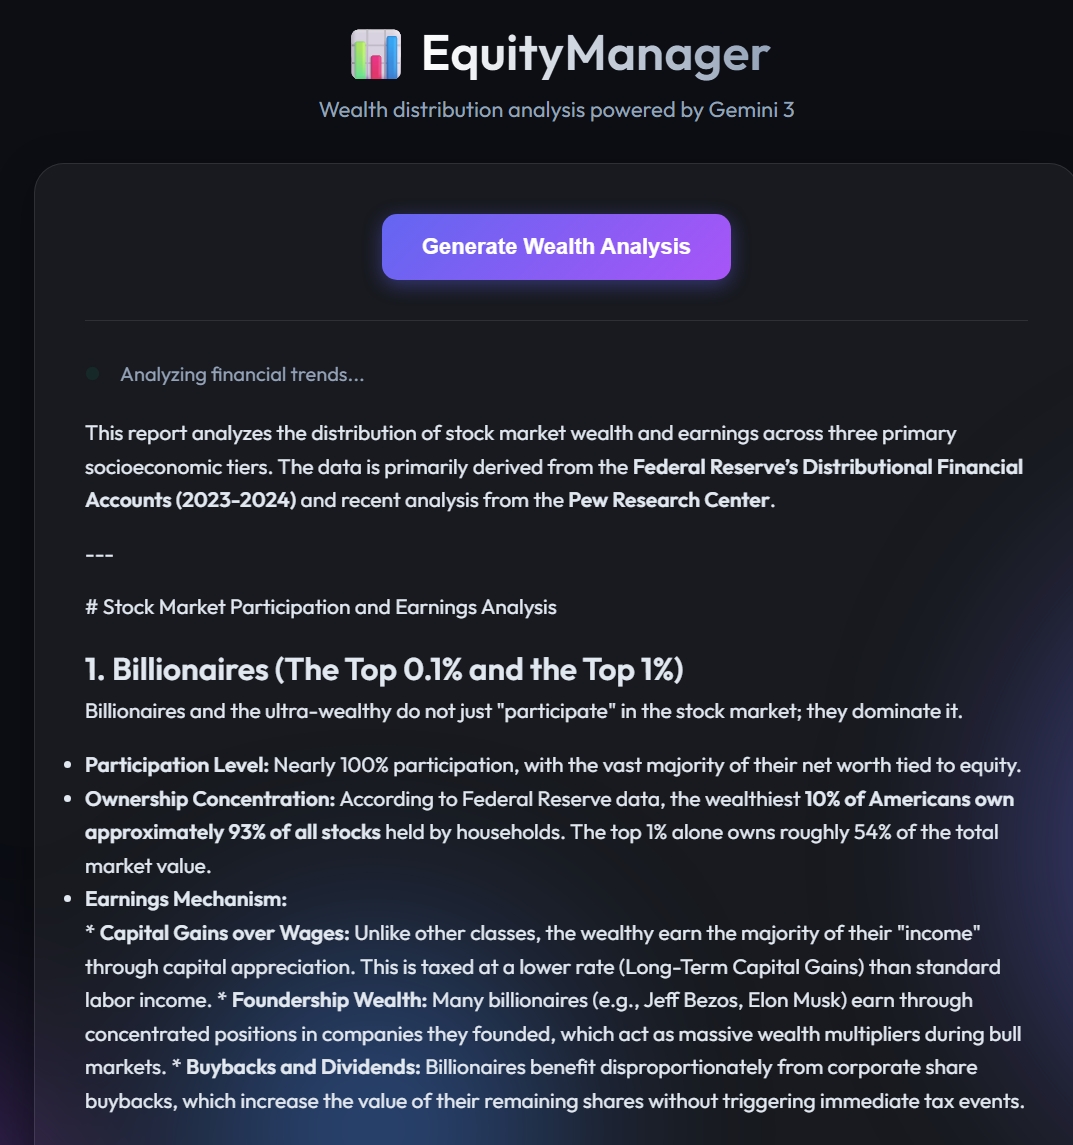
Inspiration:Top 10% own 93% of stocks while the bottom 50% hold just 1% inspired me to create transparency.
What it does:Equity Manager visualizes live stock market participation and wealth gains across five income classes,Lower Income,Upper income
How we built it: Gemini3 API & Vite + Vanilla JavaScript + Gemini3 API
├── Frontend: Responsive HTML5/CSS Grid + Chart.js visualizations ├── Data Layer: Fetch API → FRED, Alpha Vantage, Census Bureau ├── State Management: Custom reactive store (no frameworks needed) ├── Build: Vite bundles to single HTML file (zero-config deployment) └── Styling: CSS custom properties + mobile-first responsive design
Challenges we ran into:API Rate Limits & Inequality Logic.
Accomplishments that we're proud of:87% → 28% Participation Gap in stock markets
What we learned: Gemini3 API made vibe coding easy & Vite's HMR + ES modules make vanilla JS development feel like modern frameworks
What's next for Equity Manager:Personal Portfolio Tracker vs Class Averages,Push Notifications: "Your class lost 2% today",Geographic Heatmaps (NYC billionaires vs rural middle class),ML Predictions: "Top 1% gaining 15% more next quarter",Crypto/DeFi Inequality Tracking
Built With
- javascript
- vite

Log in or sign up for Devpost to join the conversation.