Inspiration
Toronto has a massive transit system. TTC owns and operates four rapid transit lines with 75 stations, over 149 bus routes, and 11 streetcar lines which serves 1.69 million passengers on an average weekday in 2019 [Wiki Toronto Transit Commision] Our team observed that passengers on the streetcar have a tendency of not spacing themselves. As a result, some sections of the streetcar are more crowded than others. Passengers who are waiting for the streetcar but unaware of the situation would not be able to get on the streetcar. The opportunity arises as our team believes that we can create a hardware-software-GUI system where the system can allow the awaiting-passengers to make better and more effective decisions.
What it does
Data collection Two ultrasonic sensors are configured to obtain data in three-dimensions. The data maps the closed space (streetcar without passengers) and the change in the distance caused by the passenger. Data then is received and processed by Rasberry pi.
Data transfer From Rasberry pi, two arrays (the x-coordinate and the y-coordinate) are sent to the server built using Google Cloud such that the mobile application can obtain the data and plot them on the display.
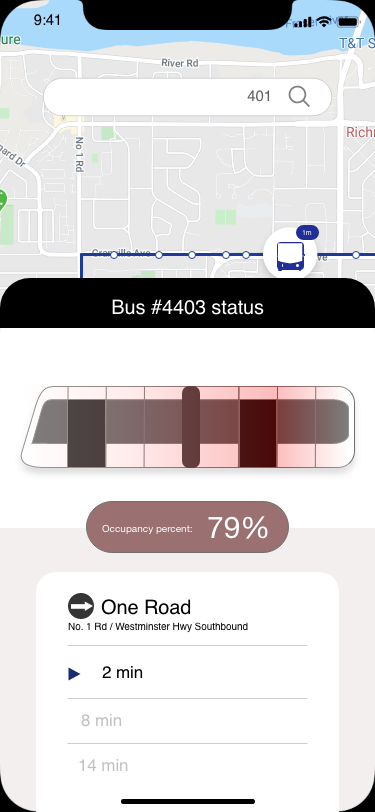
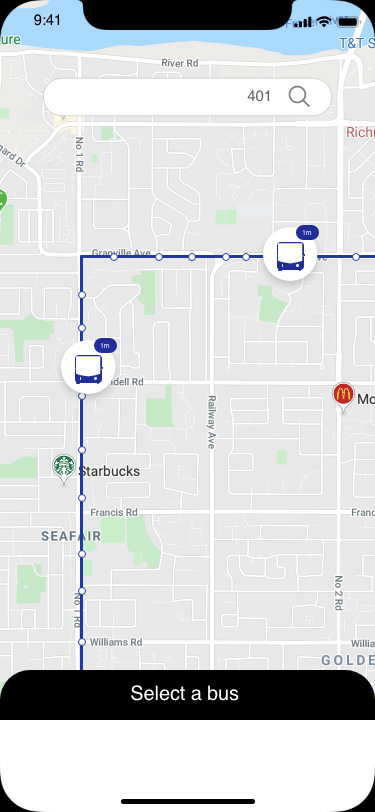
Data display Our team decided to display our project through two manners: software implementation using swift and graphical implementation using Adobe XD On the software side: When data is extracted from the server, it is plotted on the screen. Our concept was to display the data in gradient. Due to time constraints, we decided to use scatter plots because it can serve the same purpose--informing passengers about the density of that specific area in the streetcar. On the graphical side: The user interface displays our vision of what the application looks like when it is marketed on the app store. To build the app, it requires a partnership with Translink/ access to the bus locations.
How I built it
Challenges I ran into
Accomplishments that I'm proud of
We were able to formulate a mathematical function that converted distance values from the r-theta-phi coordinate system to a 2D map which contains an approximate location for the position of a person inside a given area.
What I learned
By using a multitude of platforms, we learned a lot about the different data sets and mathematical operations needed to calculate the positioning of a person in a given space. We learned about the limits of an ultrasonic sensor as it only detects distance in a linear fashion. This required us to improvise a gyroscopic system that would obtain distance data for all positions within the given area. We learned how to convert data received from the ultrasonic sensor into a 2D map which represents a top view indicating congested areas. We also learned about the difficulties of using Raspberry Pi 3 and the different commands needed to control the servo motors and control the ultrasonic sensor.
What's next for EquiSpace
This design can be scaled up for any public space such as multi-story buildings, airports, parking garages, supermarkets, and much more. This technology allows us to create a 2D map which can be useful for consumers to navigate efficiently within their daily lives. However, this technology can also be used in the economic industry to analyze trends to help increase sales, increase number of consumers, and minimize wait time for consumers.

Log in or sign up for Devpost to join the conversation.