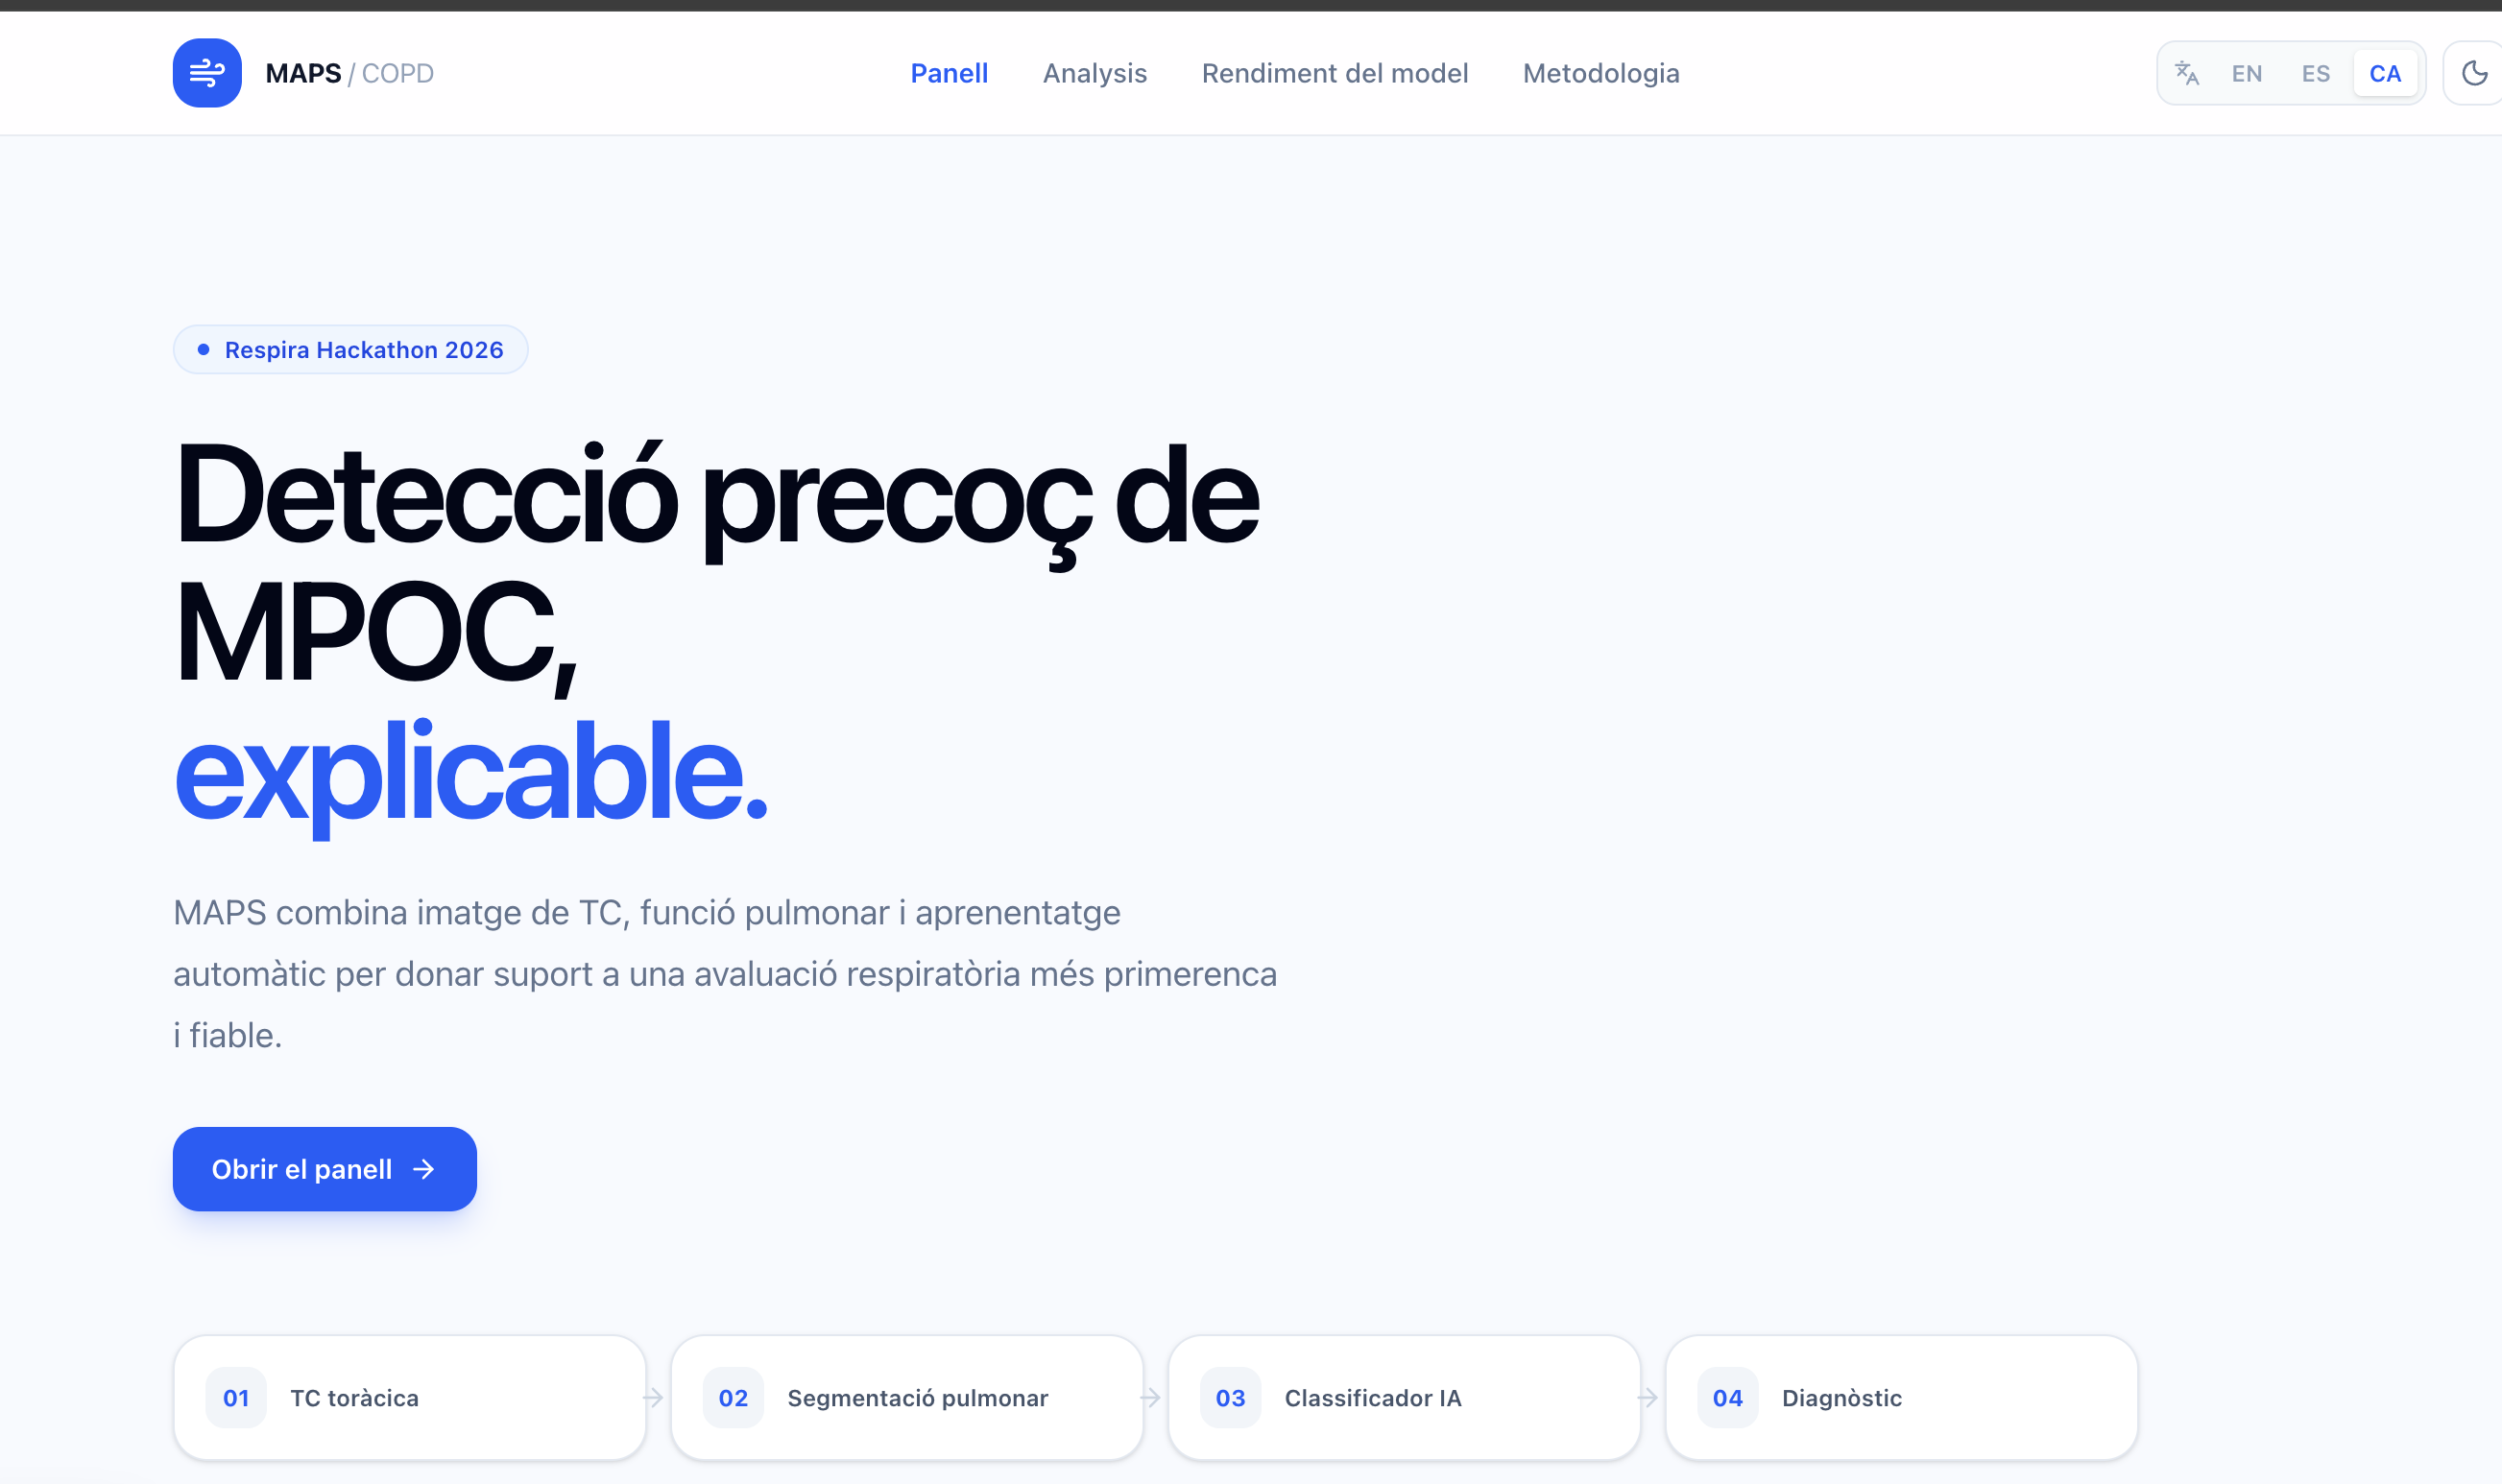
MAPS – Early COPD Detection
Catching COPD before it catches you — explainable AI for earlier, more confident respiratory diagnosis.
Respira Hackathon 2026
Inspiration
Chronic Obstructive Pulmonary Disease (COPD) is one of the leading causes of death worldwide, yet it is dramatically underdiagnosed. By the time most patients receive a diagnosis, significant and irreversible lung damage has already occurred. The existence of a "Pre-COPD" stage — where structural or functional changes are present but spirometric thresholds have not yet been crossed — offers a critical window for intervention.
We were inspired by the challenge of making this window visible. Clinicians have access to rich data — CT scans, spirometry, symptom scores — but no integrated tool to synthesise it into an actionable, explainable signal. MAPS is our answer to that gap.
What it does
MAPS (Multimodal AI Pulmonary Screening) classifies patients into three categories based on GOLD clinical criteria:
- Control — normal lung function, no structural damage
- Pre-COPD — FEV1/FVC ≥ 0.70 but with early symptoms or structural changes (CAT ≥ 10, mMRC ≥ 2, DLCO < 80%, or CT emphysema)
- COPD — post-bronchodilator FEV1/FVC < 0.70
The interactive trilingual dashboard (English, Spanish, Catalan) allows clinicians to:
- Select a patient and view their full clinical profile
- Explore CT scan slices in a lung-windowed viewer
- See the AI classification with per-class probabilities
- Understand which variables drove the prediction (SHAP feature importance)
- Explore cohort-level analysis: box plots, PCA, and correlation matrices grouped by diagnosis
How we built it
Data pipeline (MareNostrum Supercomputer — H100 GPU):
- Extracted and parsed 86 patients from
EARLY_Hackathon_anonymous_definitive.csv, handling mixed decimal formats and visit-1 / visit-2 structures - CT feature extraction using SimpleITK and lungmask (U-Net R231) for automated lung segmentation and LAA%-950 emphysema quantification
- Exploratory analysis: box plots, correlation matrices, eta² effect size ranking and PCA to identify the most discriminative features
Machine learning:
- Eta² feature selection to filter low-discriminability variables before training (inspired by our EDA)
- Random Forest classifier with calibrated probabilities
- Leave-One-Out cross-validation — the statistically correct strategy for N=86
- SHAP TreeExplainer for per-patient explainability
Backend:
- FastAPI serving pre-computed results from a JSON file (no runtime dependency on MareNostrum during the demo)
Frontend:
- Next.js 14 dashboard built with v0 (Vercel), fully trilingual (EN / ES / CA)
- Recharts for model performance and feature importance visualisation
- Live CT slice viewer with lung-window rendering
Challenges we ran into
- No internet access from MareNostrum login nodes — pip and conda both timed out. We worked around this by using pre-loaded system modules (PyTorch/2.4.0 with CUDA) and finding internal package mirrors.
- Small dataset (N=14 miniset, N=86 full dataset) — standard train/test splits are statistically meaningless at this scale. We used Leave-One-Out CV and eta²-based feature selection to avoid overfitting.
- Mixed decimal formats in the clinical CSV — comma vs. dot separators across columns, some fields entirely empty for visit 2. Required careful per-column normalisation.
- CT slice viewer without local DICOM access — the raw DICOM files stay on MareNostrum for privacy. The frontend gracefully degrades to a placeholder when CT images are not available.
- Trilingual UI in a hackathon timeframe — implemented a lightweight dictionary-based i18n approach covering all 3 languages without adding heavy localisation libraries.
Accomplishments that we're proud of
- 94.8% balanced accuracy, Cohen's kappa 0.97 on 86 patients with Leave-One-Out cross-validation — robust metrics for a small medical dataset
- A fully integrated end-to-end pipeline: raw DICOM + CSV → lung segmentation → feature extraction → classifier → explainable dashboard, all running on MareNostrum's H100 GPU
- Eta² feature selection derived from our own exploratory analysis, integrated directly into the training pipeline
- A clinician-friendly dashboard that is trilingual, accessible, and provides explainability at the individual patient level — not just aggregate metrics
- Clean, modular, tested Python code (19 unit tests, all passing) that can be extended beyond the hackathon
What we learned
- Leave-One-Out cross-validation is not optional when N < 30 — it is the only way to get honest performance estimates on small medical datasets
- Eta² is a simple but powerful tool for feature selection in small-N settings, outperforming filter methods based purely on correlation
- Explainability matters as much as accuracy in clinical AI — SHAP values make the model's reasoning transparent to clinicians, which is essential for trust
- The gap between a working prototype and a robust pipeline is mostly data plumbing: decimal formats, missing visit-2 data, DICOM series filtering, label alignment
- Usman, Rohma and Marta bring genuinely complementary skills — supercomputing, clinical domain knowledge and AI engineering — and that combination is what made this possible in a single hackathon
What's next for MAPS
- CT feature integration at scale — now that the pipeline is validated clinically, integrating lungmask-derived LAA%-950 and lung volume for all 86 patients is the natural next step
- Longitudinal analysis — the dataset includes visit 2 data (
_v2columns) for a subset of patients. Tracking progression from Pre-COPD to COPD over time is a high-value clinical application - Validation on external cohorts — testing on datasets beyond the EARLY study to assess generalisability
- Clinical deployment pathway — wrapping the API in a FHIR-compatible interface to integrate with hospital EHR systems
- Active learning — with a small labelled dataset, semi-supervised or active learning approaches could efficiently incorporate new patient data to improve the model over time


Log in or sign up for Devpost to join the conversation.