-
-
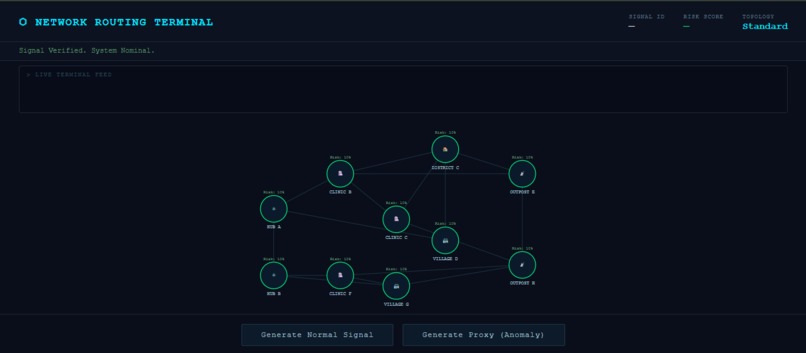
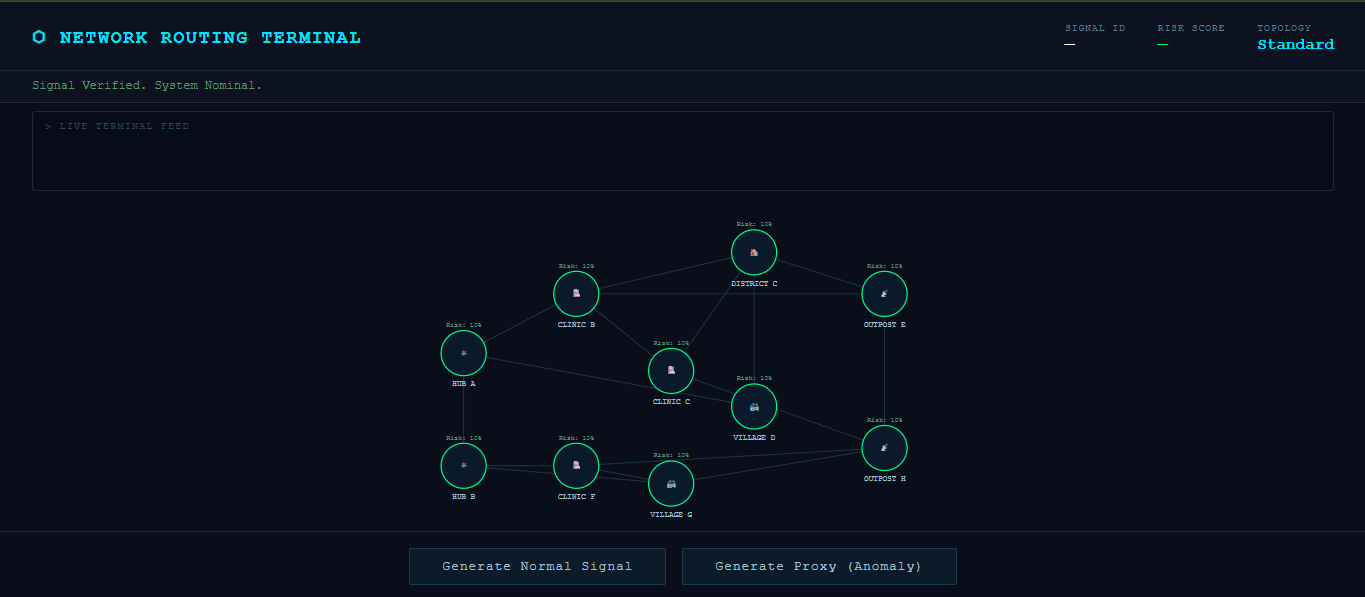
Baseline State: The live D3.js terminal monitoring all 10 medical districts. The network is stable, using standard optimal dispatch routes.
-
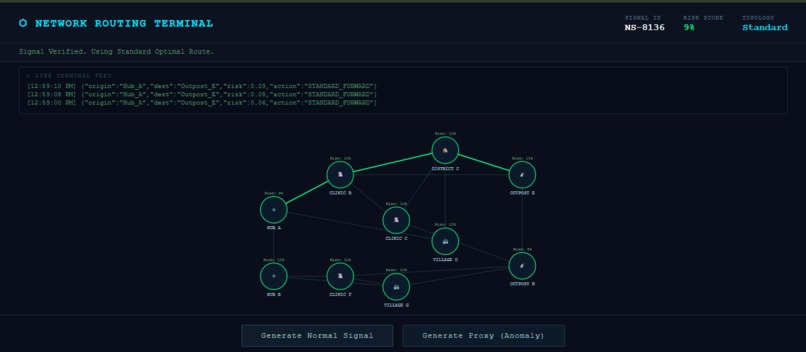
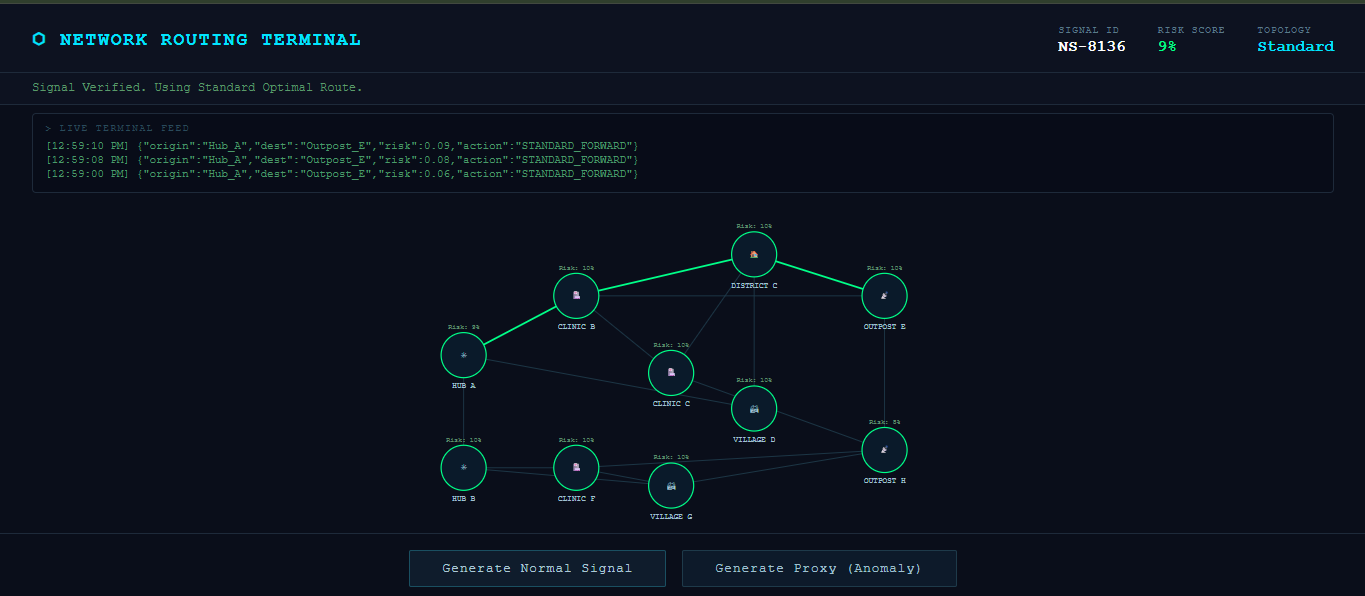
Signal Verified: The live terminal logs stable proxy signals, while the engine highlights the standard optimal dispatch route.
-
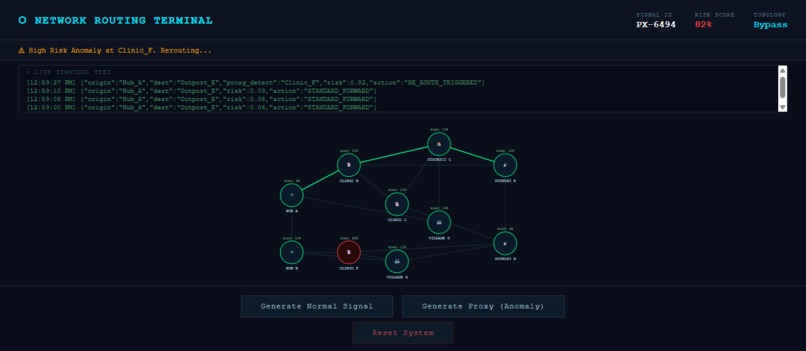
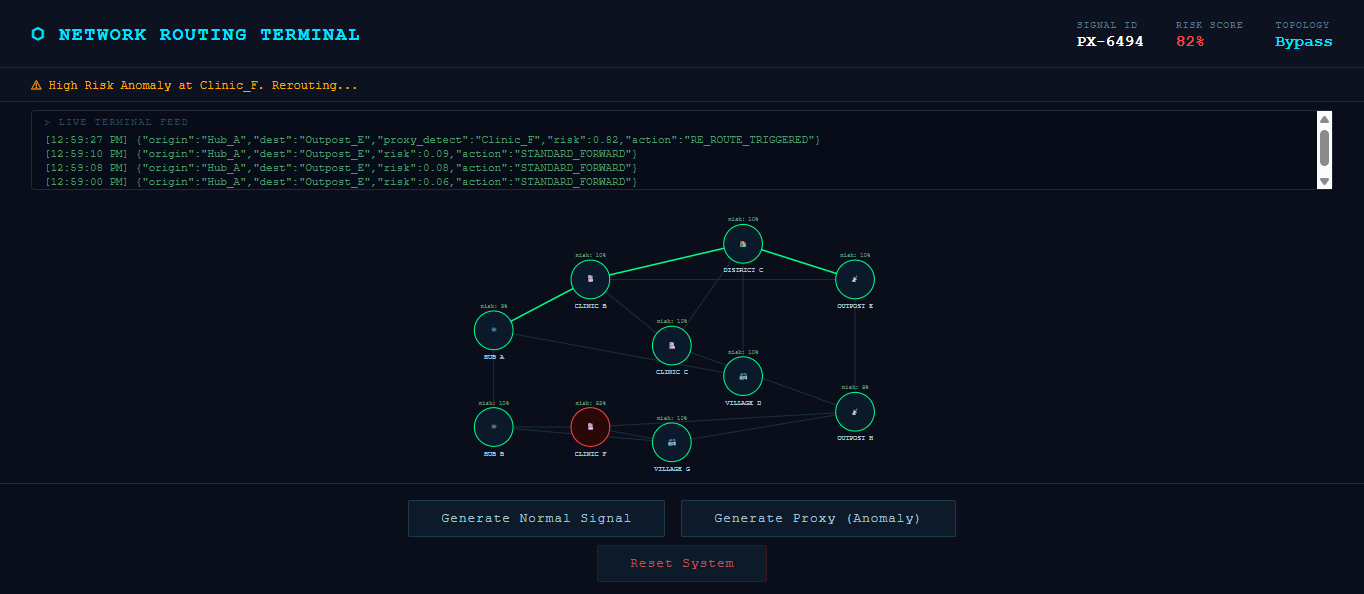
Network Alert: Anomaly hits Clinic_F (82% risk). The engine processes the danger without needing to disrupt the current optimal dispatch.
-
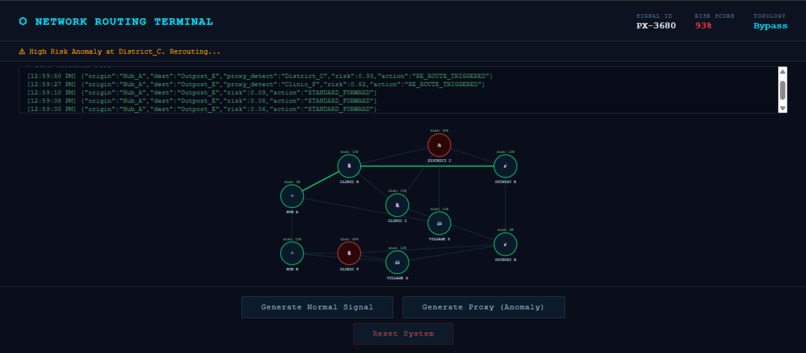
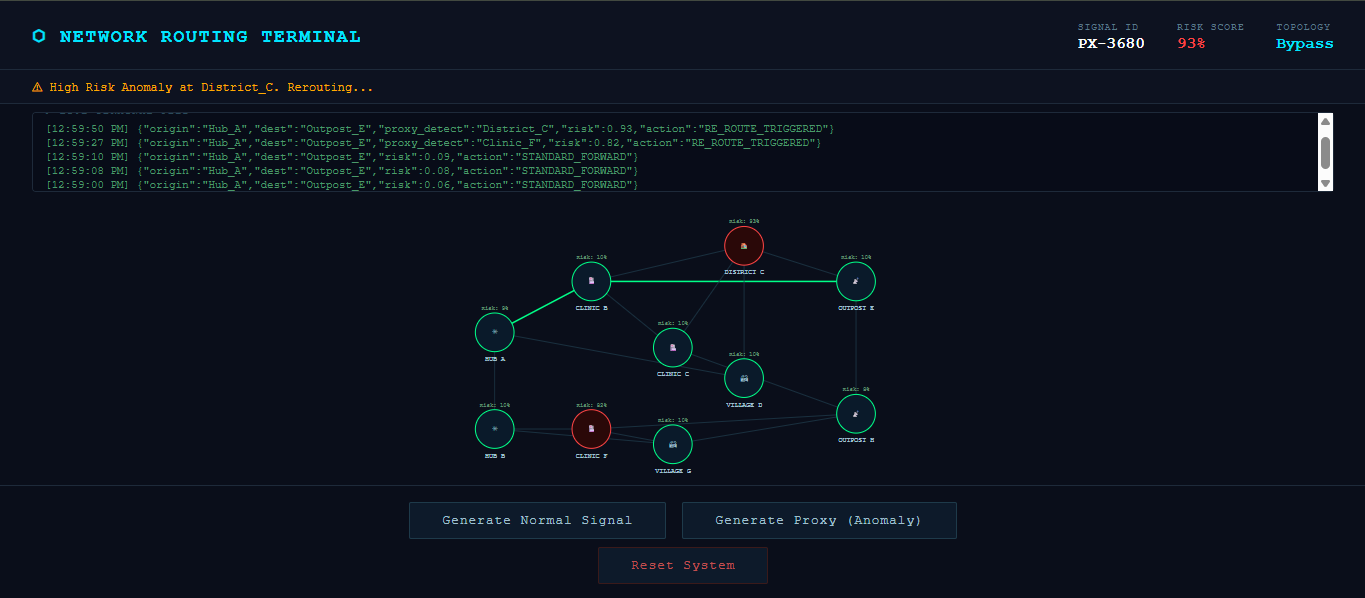
Dynamic Rerouting: District_C risk hits 93%. The algorithm instantly recalculates, bypassing the hazard to keep the supply route safe.
Anticipatory Epidemic Routing Engine
Inspiration
Growing up in South Africa, the reality of under-resourced public health infrastructure is not abstract. It is the queue outside a clinic that starts before sunrise. It is the mobile health unit that arrives at a village three days after a water contamination event. It is the TB patient who stops treatment not out of choice, but because the nearest facility rerouted its resources elsewhere.
The core problem is not a lack of resources , it is timing and logistics. Outbreak response in fragile health systems is almost always reactive. A cluster is confirmed. An alert is issued. A response is dispatched. By then, the window for containment has closed.
We asked one question: what if the routing algorithm could move before the outbreak does?
What We Built
The Anticipatory Epidemic Routing Engine models a city's medical districts as a weighted mathematical graph. Instead of waiting for confirmed case data, the system monitors proxy signals, environmental and behavioural anomalies that historically precede outbreaks:
- Sudden drops in local water quality
- Unusual spikes in pharmacy purchases
- Sanitation system failure logs
- Field reports from community health workers
When a proxy signal fires and a district's risk score spikes, the engine instantly recalculates the optimal dispatch route for mobile clinics and vaccine supplies, routing around high-risk zones for safe dispatch, with the potential to extend the system toward targeted intervention routing in future iterations.
The system is designed to scale from small district networks to larger regional healthcare graphs with minimal changes to the core routing logic.
The Algorithmic Core
The foundation is Dijkstra's Algorithm, modified with a composite dynamic edge weight:
$$ w(u, v) = d(u,v) \times (1 + \text{risk}(v)) $$
Where:
- d(u,v) is the physical distance between districts u and v
- risk(v) is the current infection risk multiplier of the destination node v
This formulation means the algorithm does not just find the shortest path, it finds the safest efficient path. A high-risk district becomes a heavier node. The algorithm naturally avoids it unless no alternative exists.
Concrete Example
Under normal baseline conditions (all districts at *risk = 0.1 * ):
$$ \text{Path: Hub_A} \rightarrow \text{Clinic_B} \rightarrow \text{District_C} \rightarrow \text{Outpost_E} \quad \text{(cost: 33.0)} $$
After a proxy signal spikes District_C to risk = 0.95 :
$$ \text{Path: Hub_A} \rightarrow \text{Clinic_B} \rightarrow \text{Outpost_E} \quad \text{(cost: 44.0)} $$
The algorithm willingly paid 11 extra cost units to avoid the compromised district. That is not just pathfinding, that is risk-aware logistics.
How We Built It
We prioritised a clean separation between the algorithmic core and the presentation layer:
Backend — Python + Flask + NetworkX
graph_logic.pyencapsulates the entire graph model and Dijkstra implementationdata_stream.pysimulates the proxy signal pipeline- Flask serves both the API and the frontend from a single server (no CORS complexity)
Frontend — D3.js v7
- The district graph renders as an interactive SVG
- Active dispatch routes animate in real time when signals fire
- A live terminal feed logs every signal event with timestamps and actions
Testing — Python unittest
- 19 unit tests written TDD-style, covering graph integrity, risk updates, routing correctness, and anomaly bypass verification
Challenges We Faced
1. Dynamic edge weights in NetworkX
NetworkX's dijkstra_path accepts a weight parameter that can be a callable , but the function signature (u, v, edge_data) is not immediately obvious from the docs. Getting the composite weight function to read node-level risk data from within an edge-level calculation required careful scoping.
2. D3.js path re-rendering without duplication
D3's enter/update/exit pattern is powerful but unforgiving. On the first iteration, re-triggering an anomaly caused duplicate SVG elements to stack on top of each other. The fix was using stable key functions in .data() selections so D3 correctly identified existing elements to update rather than appending new ones.
3. Keeping the demo story tight
The hardest challenge was not technical, it was restraint. There were many directions to extend this: real sensor API integration, multiple simultaneous anomalies, probability decay over time. We cut everything that couldn't be demonstrated clearly in a 5-minute demo and focused on making the core algorithm's behaviour visible and undeniable.
What We Learned
- Graph theory is not just academic, modelling a real logistical network as a mathematical structure makes complex routing problems tractable and explainable
- Proxy signal detection is a genuinely underexplored space in public health tech. Most systems wait for confirmed diagnoses; the interesting algorithmic work happens in the ambiguous space before confirmation
- Separation of concerns between algorithm logic and API layer made the codebase testable from day one and dramatically reduced debugging time
What's Next
- Real sensor integration — connecting to municipal water quality APIs and pharmacy point-of-sale anomaly feeds
- Multi-anomaly handling — simultaneously elevated risk across multiple nodes with priority-weighted routing
- Risk decay functions — risk scores that decay over time if no new signals arrive, modelled as:
$$ \text{risk}(v, t) = \text{risk}_{0}(v) \cdot e^{-\lambda t} $$
- Mobile CHW app — a field-facing interface for community health workers to submit proxy observations directly into the routing engine
Built for ALGOfest Hackathon 2026 — HealthTech Track
Live Demo: epidemic-router-demo.onrender.com


Log in or sign up for Devpost to join the conversation.