-
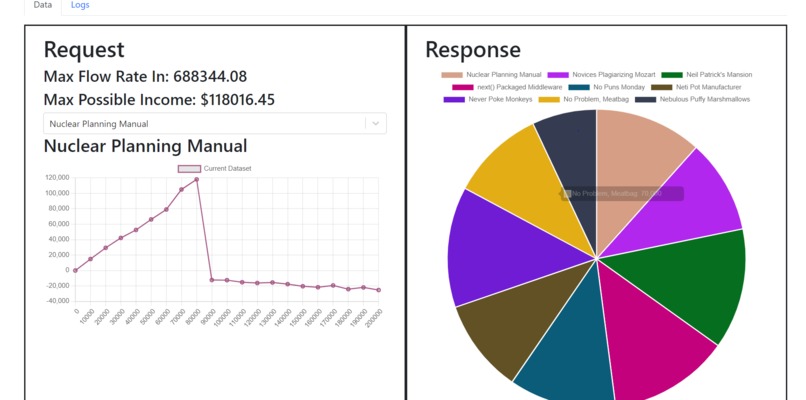
UI

What it is
An application that processes real-time sensor data by optimizing and visualizing the distribution of water for operations.
How we built it
Using React, typescript, chart.js.
Challenges we ran into
CSS styling, optimization of algorithm, creating good UI.
Accomplishments that we're proud of
Working UI changing according to real-time data, optimized algorithm.
What we learned
Typescript, React, chart.js library.


Log in or sign up for Devpost to join the conversation.