-
-
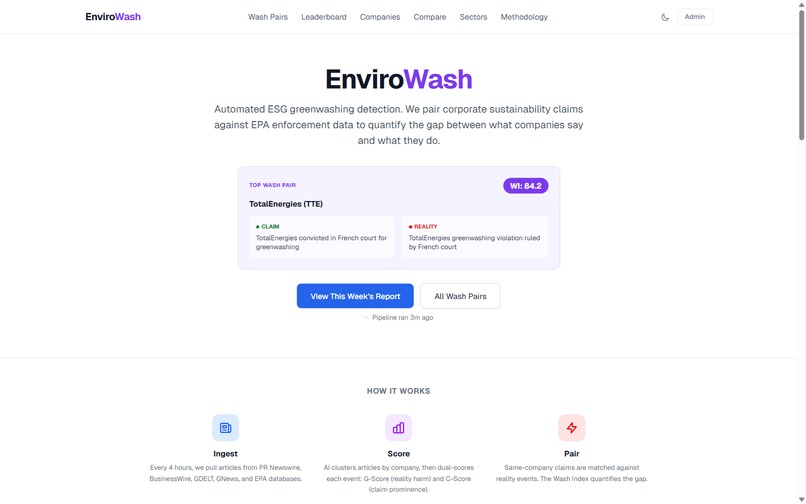
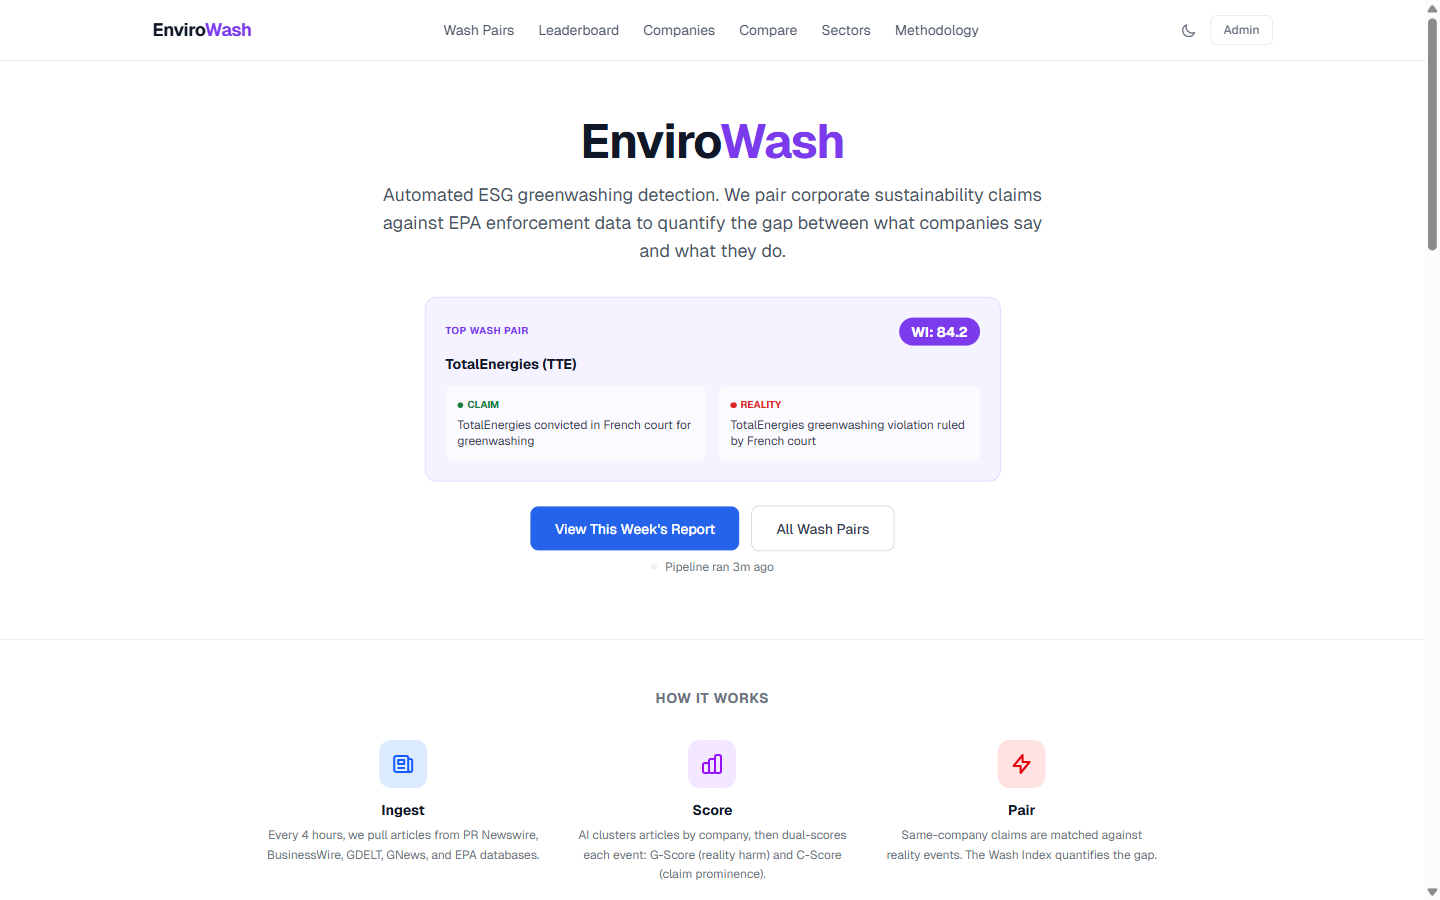
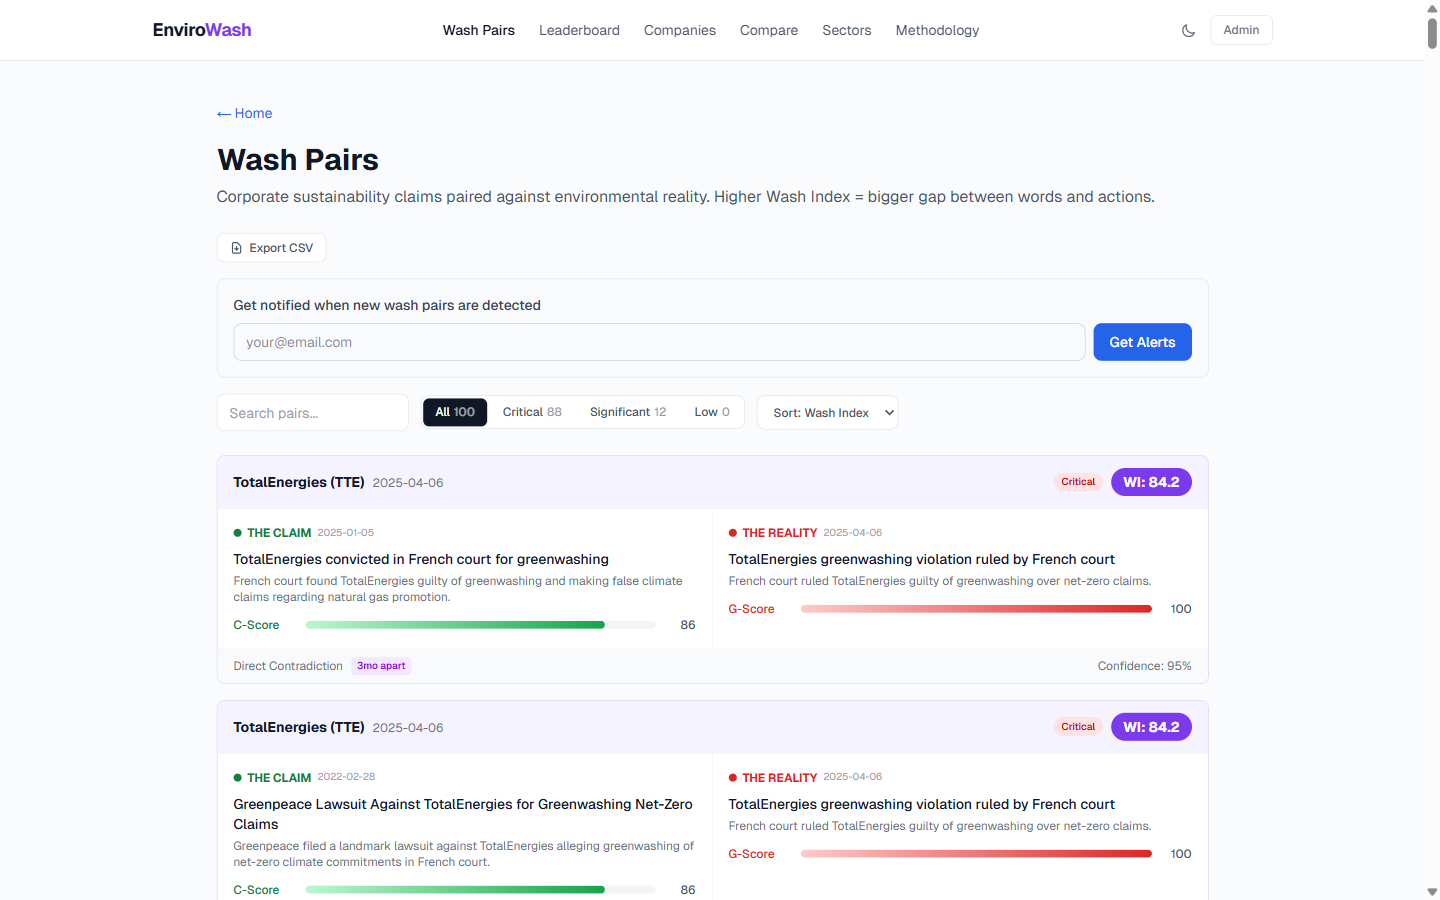
Homepage hero: Featured wash pair (WI: 84.2) with live pipeline status indicator
-
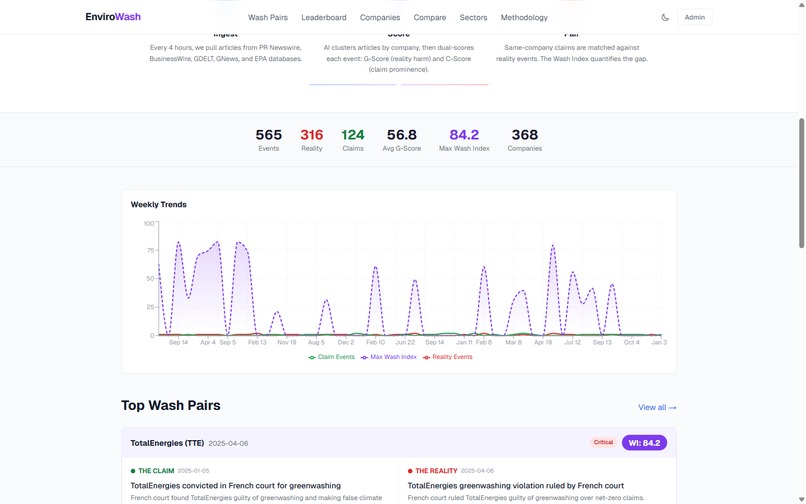
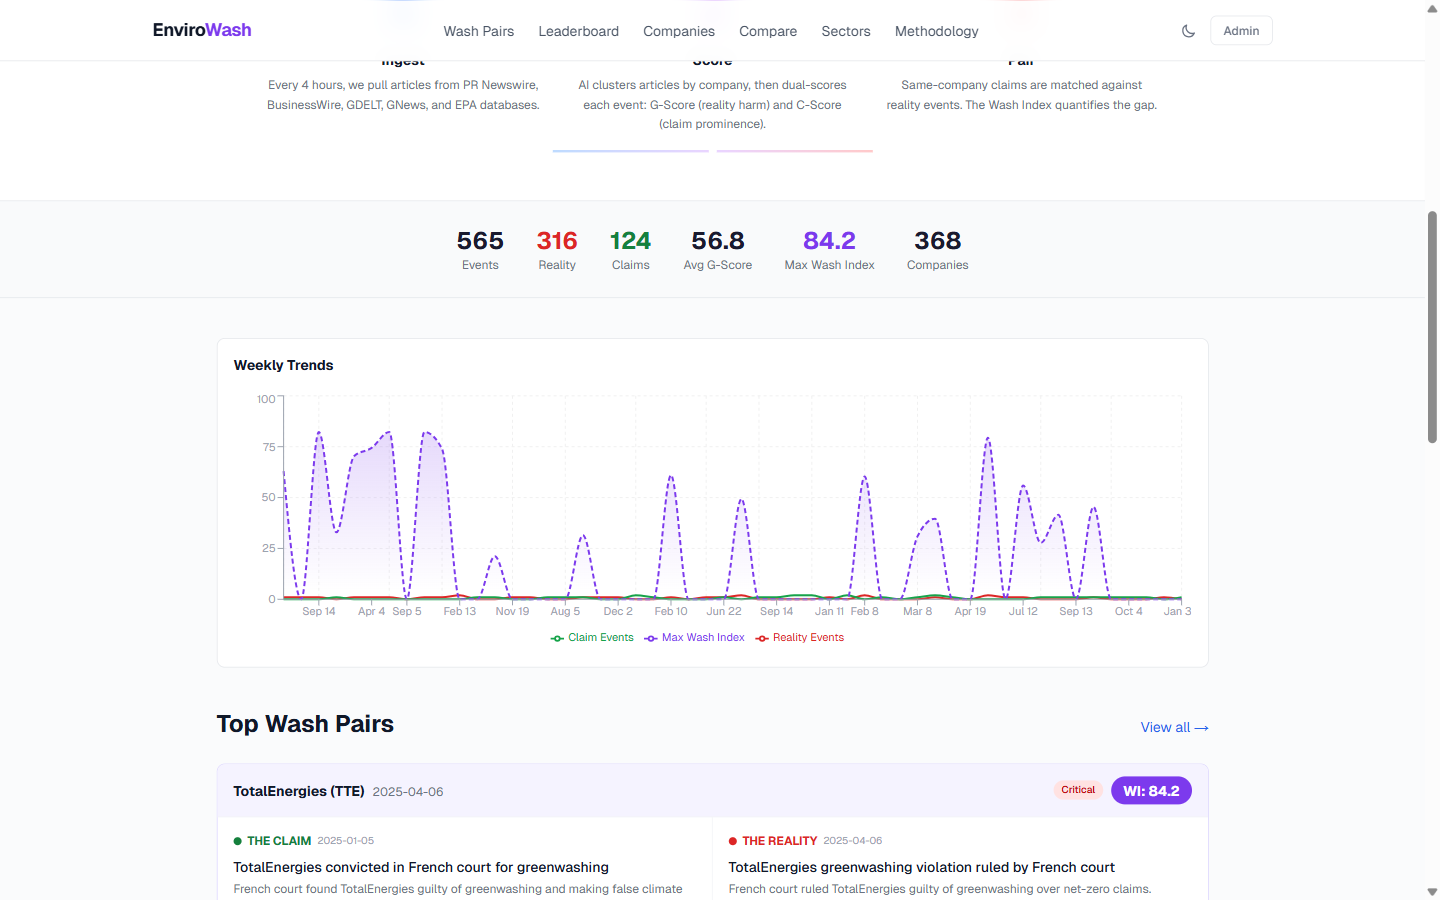
Animated stats (565 events, 368 companies) + Weekly Trends area chart
-
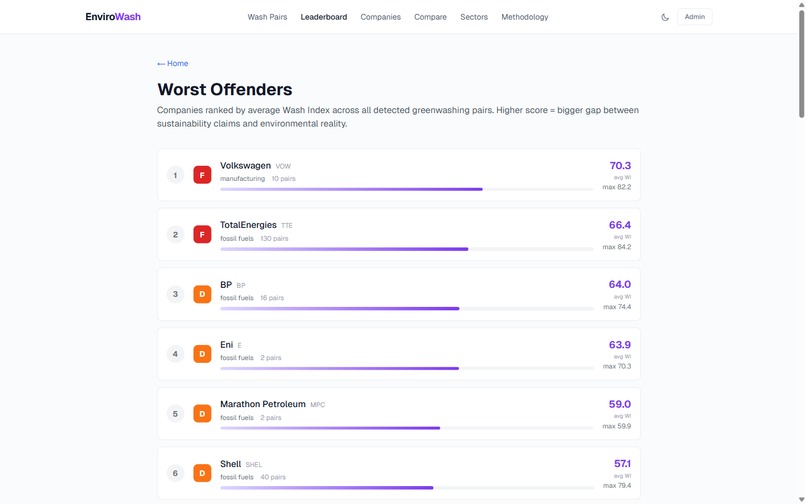
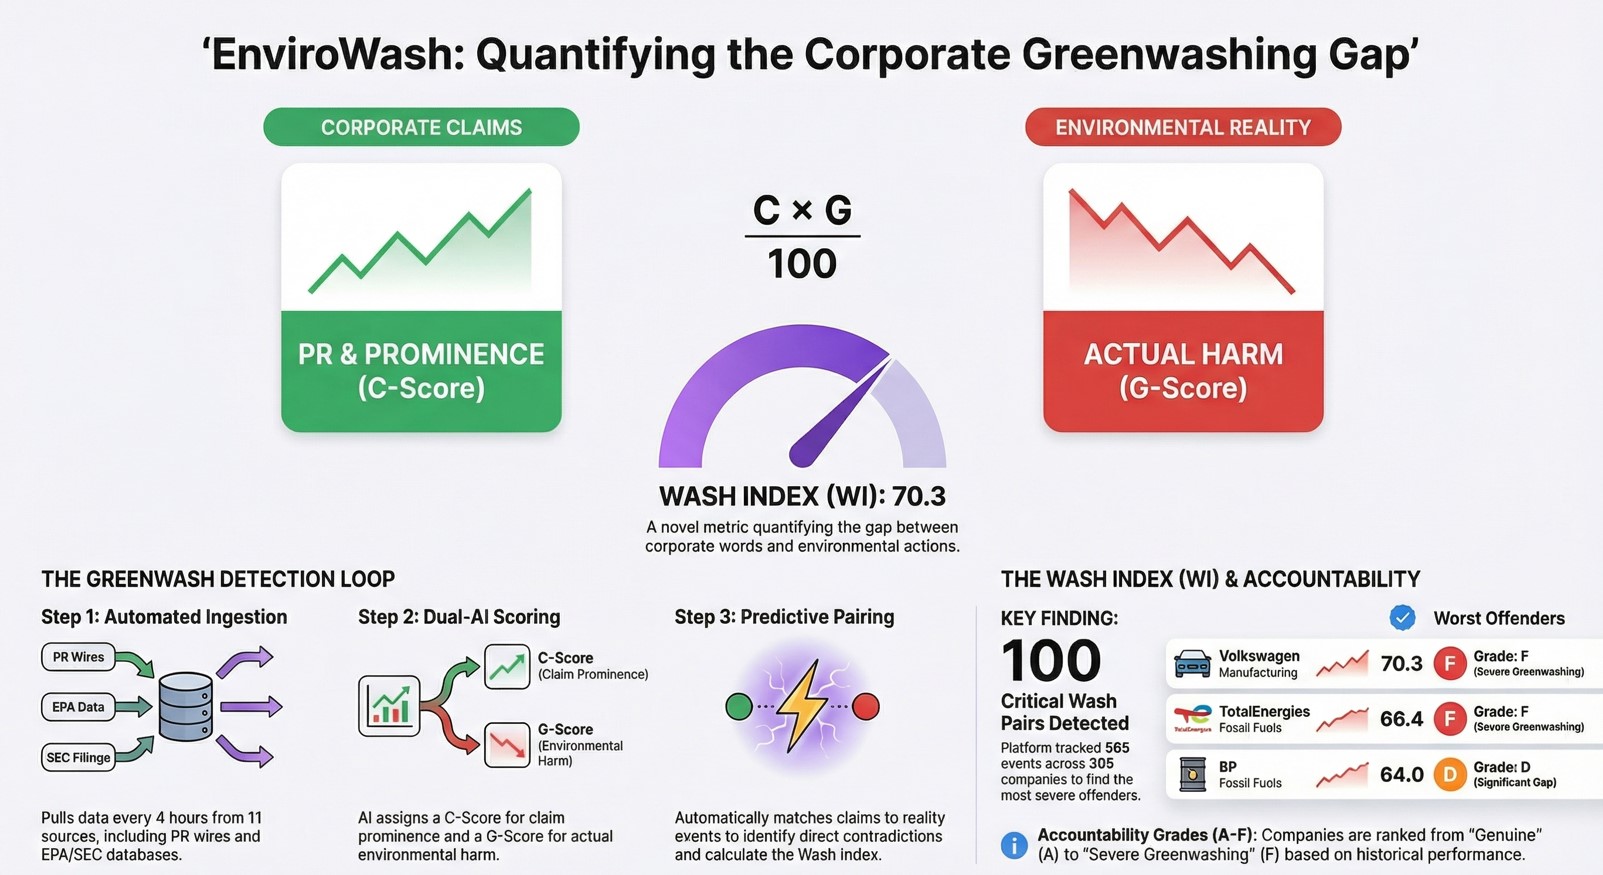
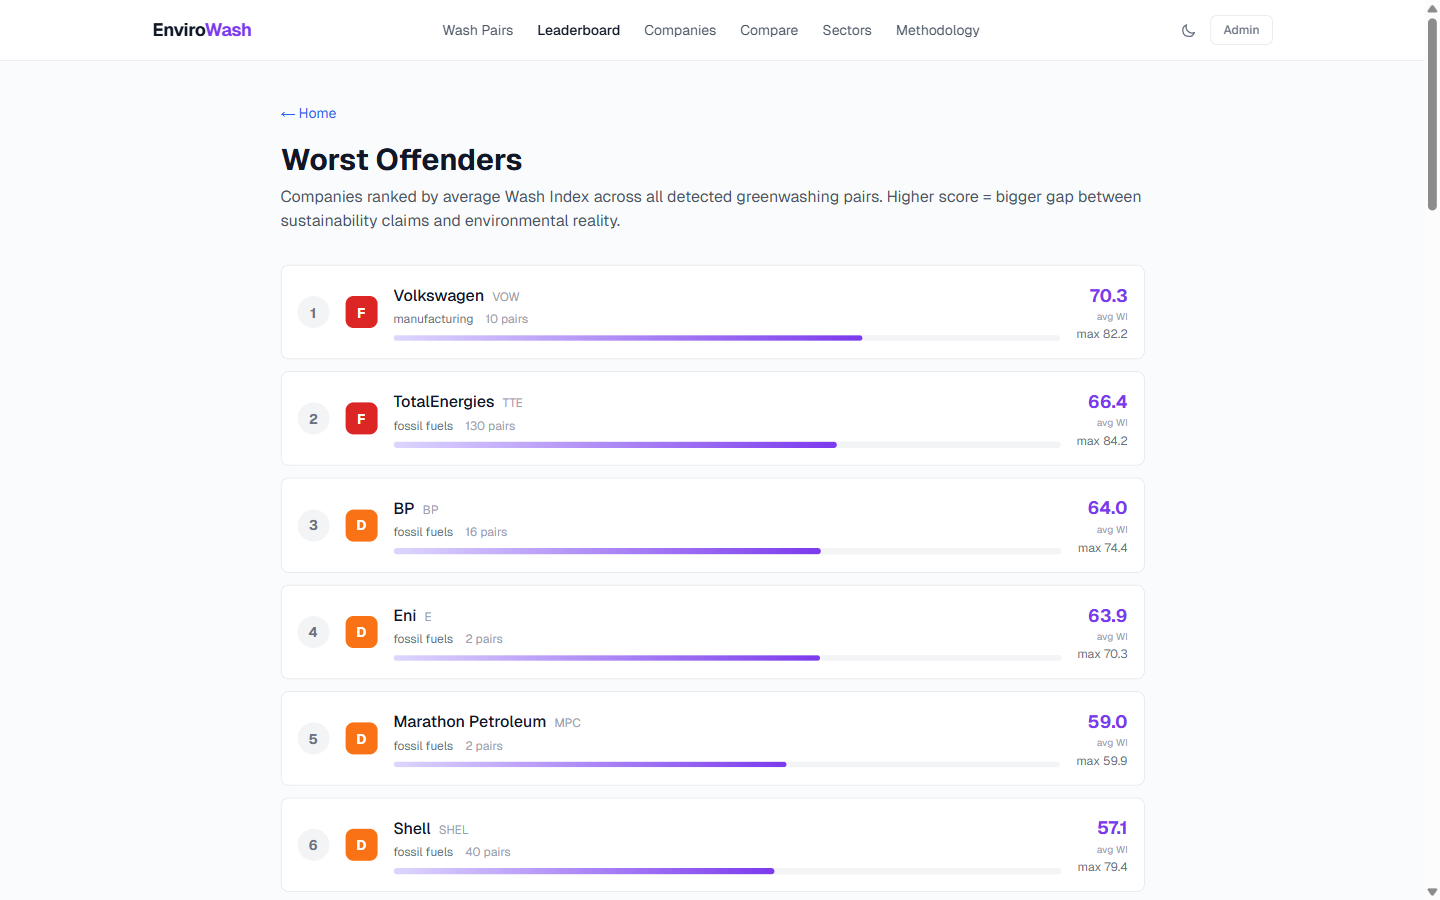
Worst Offenders leaderboard: VW #1 (F, 70.3), TotalEnergies #2, BP #3
-
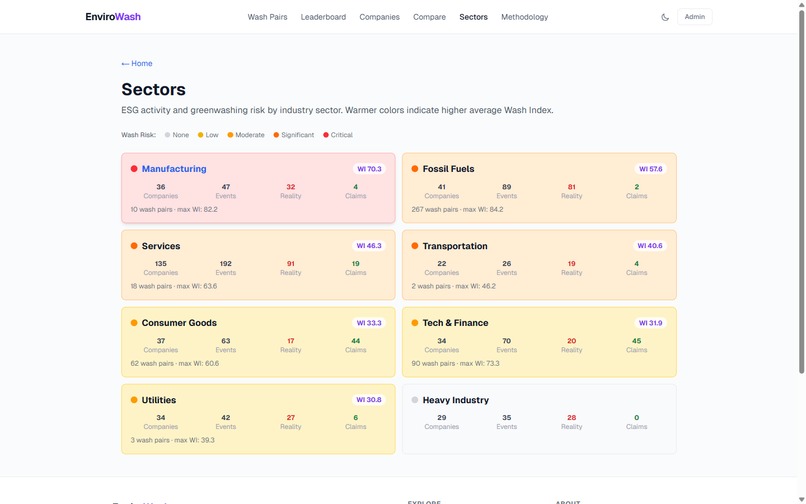
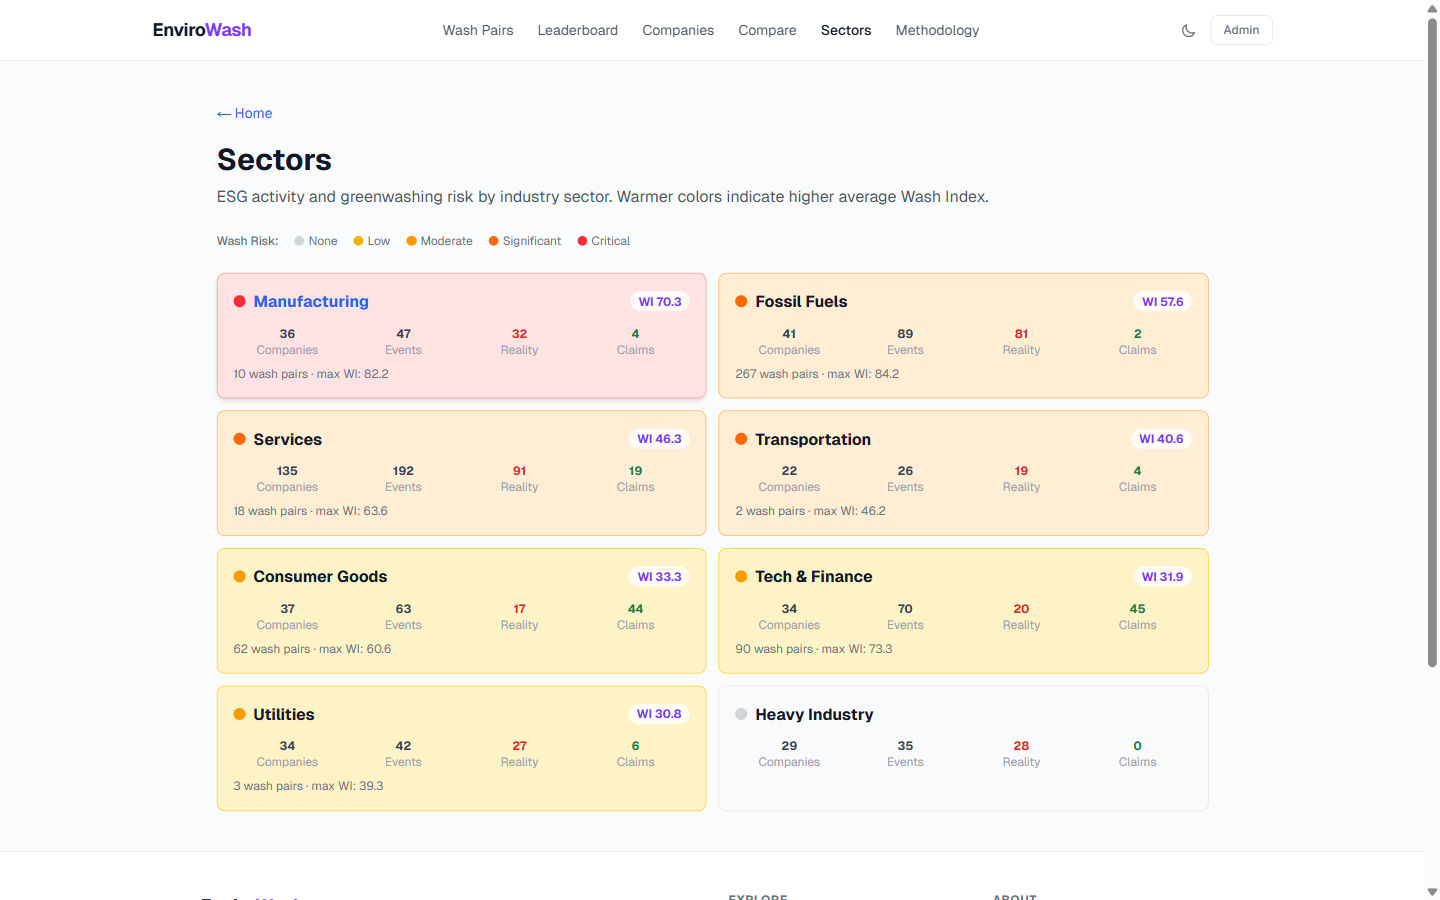
Sector heatmap: 8 industries with wash risk color coding and event counts
-
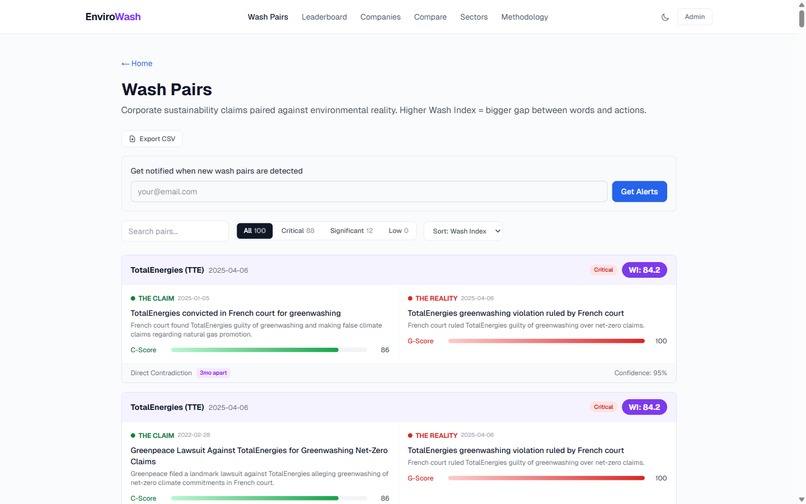
77 deduplicated wash pairs (16 Critical, 28 Significant, 33 Low) + CSV export
-
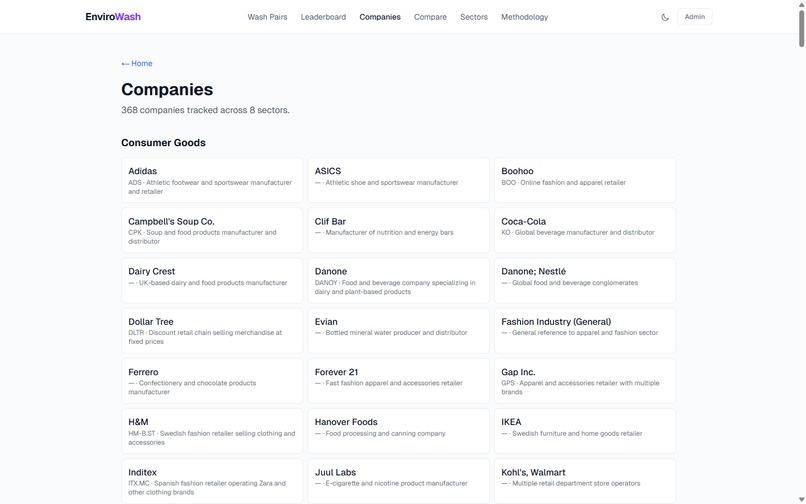
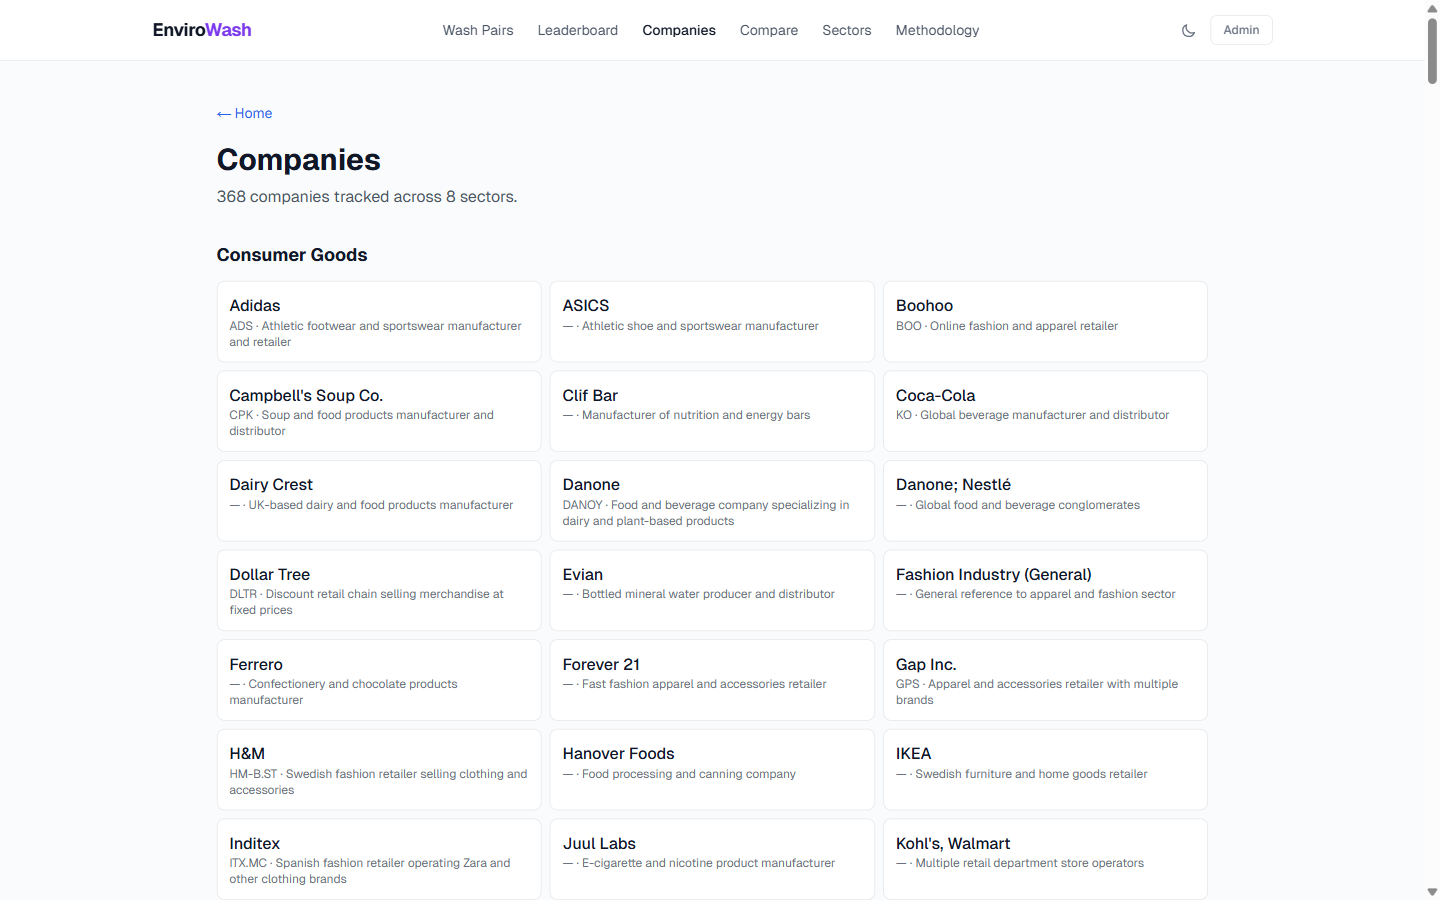
368 companies across 8 sectors with ticker symbols and AI classification
-
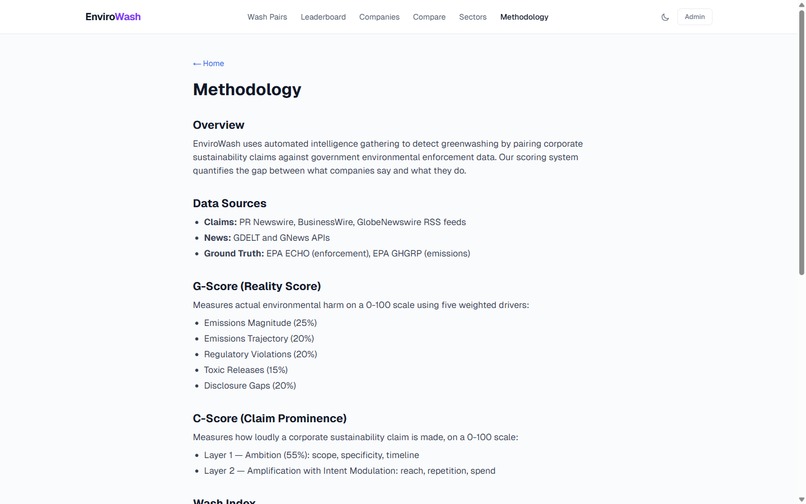
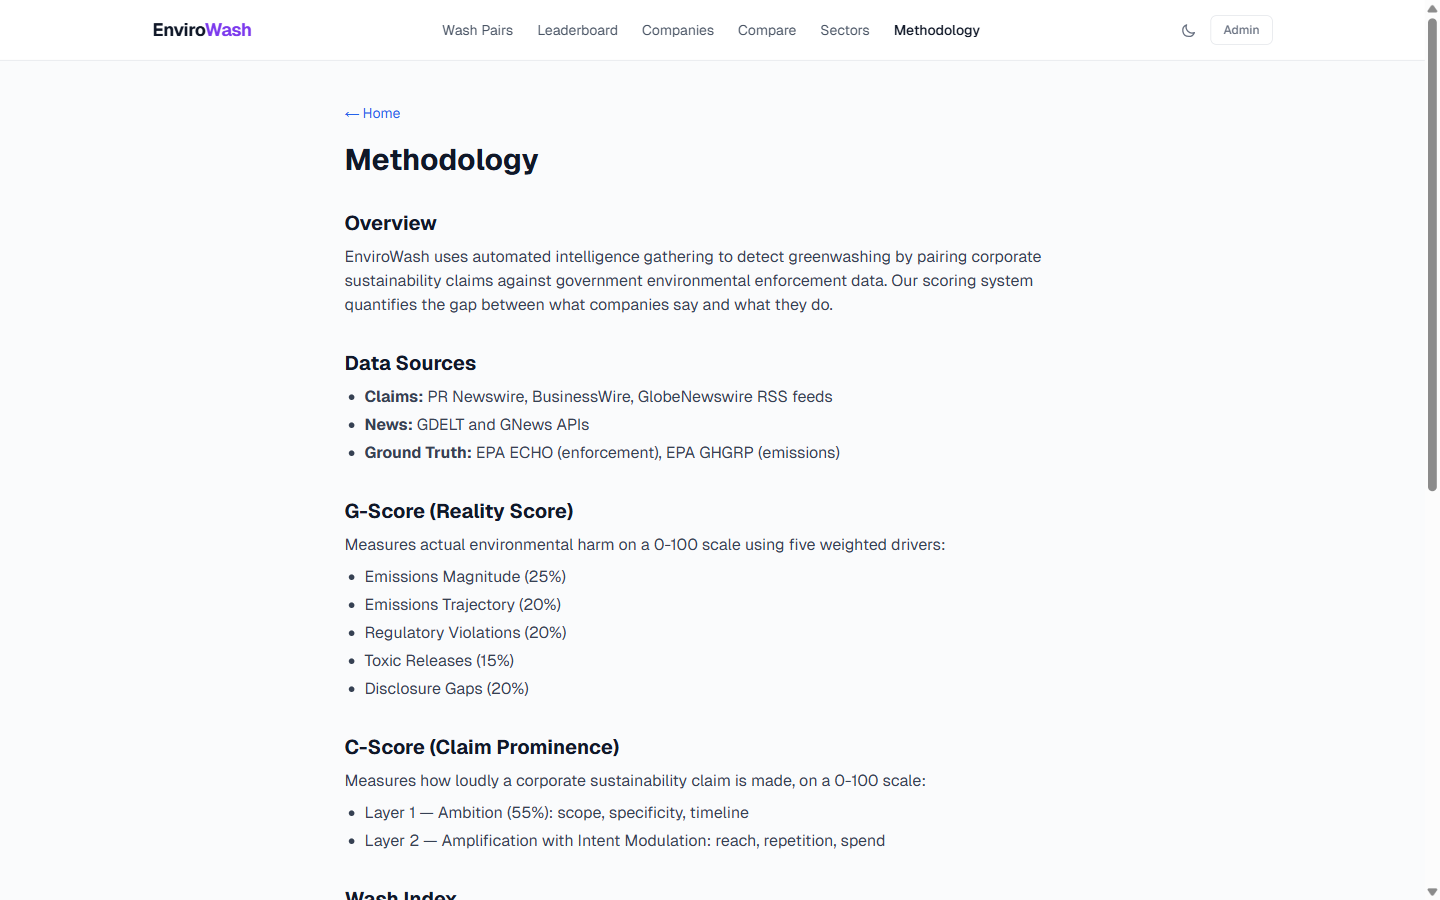
Scoring methodology: G-Score/C-Score formulas and 11 data source breakdown
-
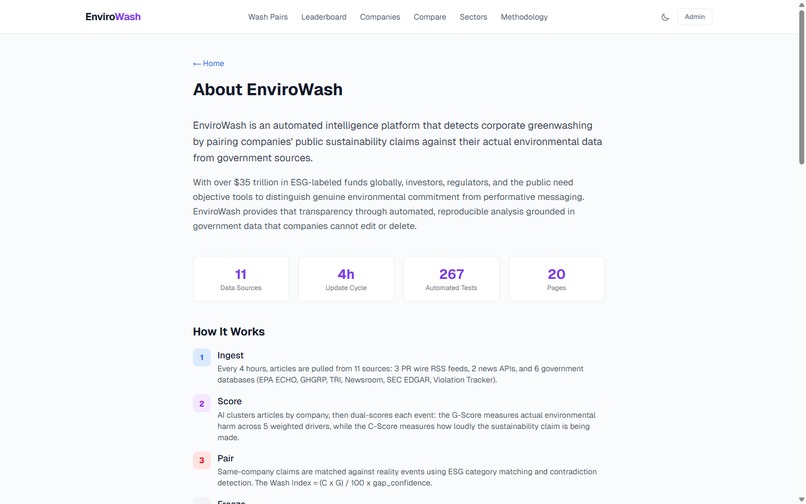
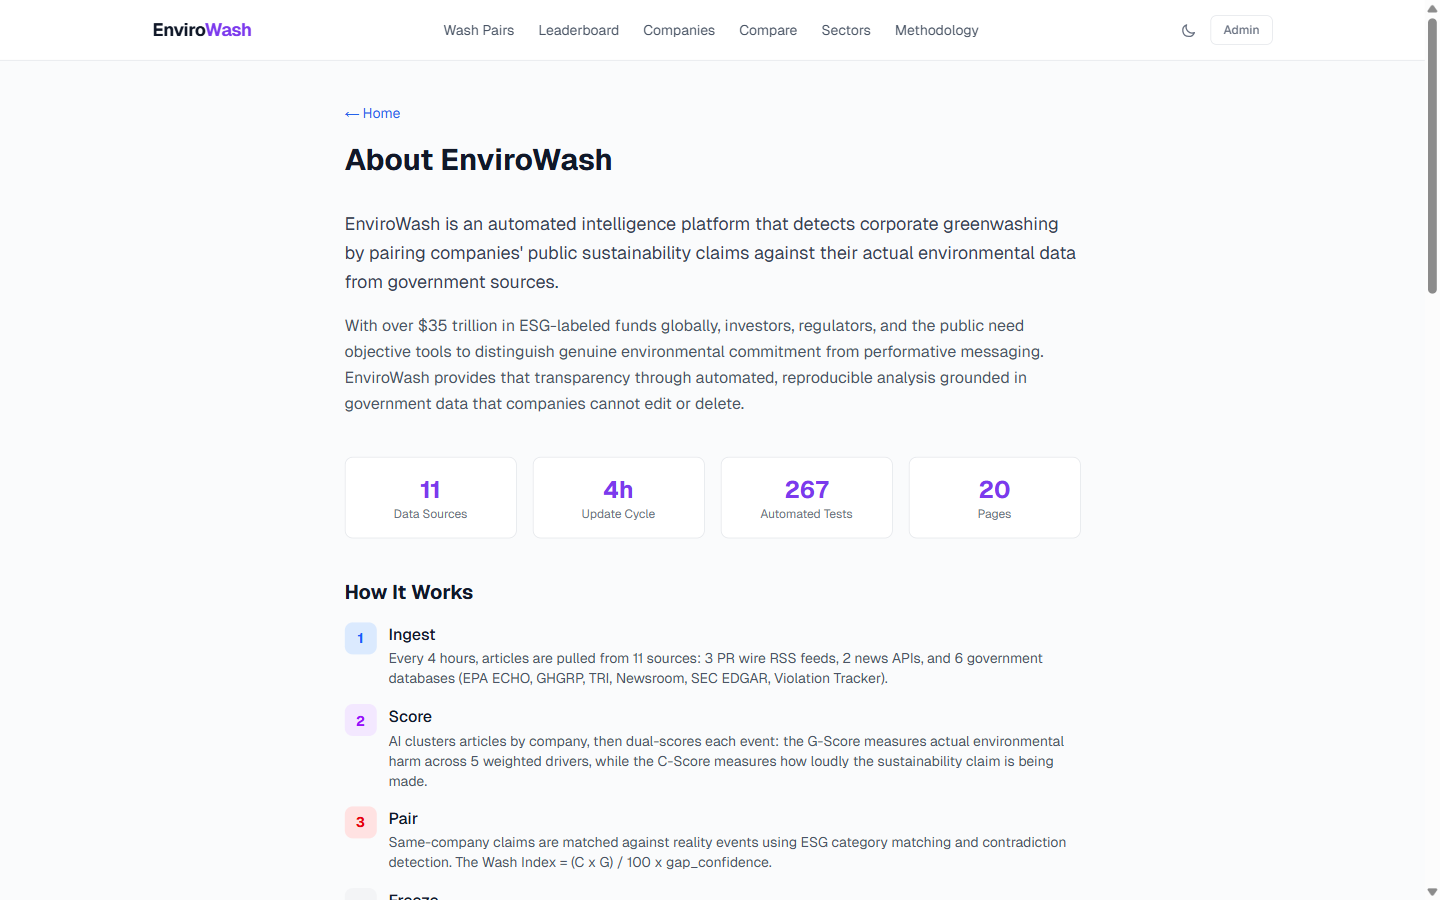
About page: 11 data sources, 267 tests, split pipeline architecture
-
Dark mode: Full theme support with system preference detection
Inspiration
With over $35 trillion in ESG-labeled funds globally, investors, regulators, and the public need objective tools to distinguish genuine environmental commitment from performative messaging. Companies publish sustainability press releases while simultaneously receiving EPA violations — and nobody connects the two at scale.
Manually researching greenwashing for a single company takes an ESG analyst 20-40 hours — searching EPA databases, cross-referencing corporate press releases, and compiling evidence. EnviroWash was built to automate that entire workflow for 368+ companies simultaneously.
What it does
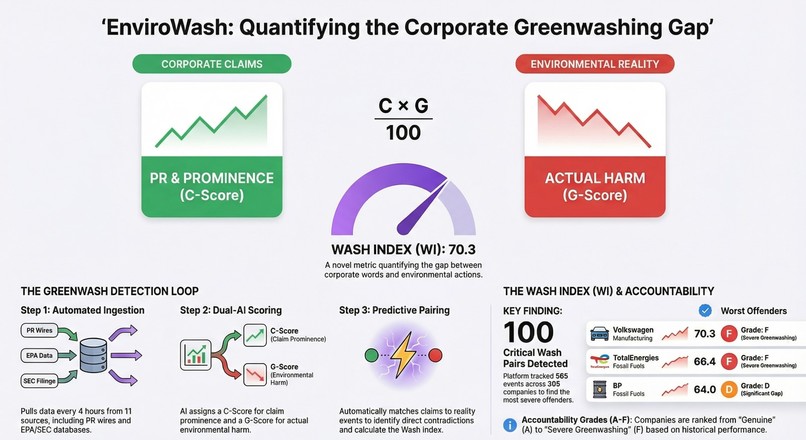
EnviroWash automates the entire corporate greenwashing detection workflow — from ingesting data across 11 sources, to AI-powered scoring, to automated pairing of claims against reality. What would take an ESG analyst 40+ hours per company is done automatically every 4 hours for 368+ companies, running on a free-tier Vercel deployment.
Every 4 hours, the automation pipeline:
- Ingests articles from 11 data sources (3 PR wire RSS feeds, 2 news APIs, 6 government databases)
- Deduplicates and clusters articles by company using AI (Claude Haiku)
- Scores each event with a novel dual-scoring system (Claude Sonnet + deterministic validation)
- Resolves company identities across sources via 5-step matching (exact → alias → EPA parent → fuzzy → create new)
- Pairs corporate claims with environmental reality — both within weeks and across months/years
- Calculates a Wash Index that quantifies the greenwashing gap
Cross-week temporal detection is the key automation innovation: a company's sustainability press release from January is automatically paired with an EPA violation that surfaces in June. The temporal gap increases pairing confidence — greenwashing patterns that span months are more damning than same-week coincidences.
Every Sunday, the week's data is frozen into an immutable snapshot — creating an auditable record that companies cannot retroactively alter.
Who needs this:
- ESG analysts and investors — automated due diligence on $35T+ in ESG-labeled assets
- Investigative journalists — data-backed corporate accountability with verifiable evidence
- Regulators — automated monitoring of ESG disclosure compliance at scale
- NGOs — reproducible greenwashing evidence for advocacy
- Corporate compliance teams — proactive greenwashing risk identification
How we built it
- Frontend: Next.js 16 + React 19 + Tailwind CSS v4 with Recharts for data visualization
- Database: Supabase PostgreSQL with Row Level Security on all 7 tables and isolated
envirowashschema - AI: Claude API — Haiku for clustering (cheap/fast), Sonnet for scoring (accurate)
- Pipeline: 3 independent Vercel cron jobs (Ingest → Process → Freeze), each under 60 seconds
- Scoring: Novel dual-scoring — G-Score (0-100) measures environmental reality across 5 weighted drivers; C-Score (0-100) measures claim prominence. Wash Index = (C × G) / 100 × gap_confidence
- Company Resolution: 5-step resolver — exact match → alias → EPA parent → fuzzy (Jaccard ≥0.8) → create new
- Security: RLS on all tables, CRON_SECRET authentication on pipeline endpoints, auth-protected admin dashboard, service role isolation
- Testing: 267 automated tests with Vitest — scoring formulas (25+ per file), ingestion/dedup (47 tests), company resolution (16 tests), cross-week temporal, API parsing
- Code Quality: TypeScript strict mode throughout, clean separation of ingestion/processing/scoring/display layers, consistent error handling with graceful degradation per source
Key Metrics
- 565 events scored across 143 weeks of data (Dec 2024 – Feb 2026)
- 77 deduplicated wash pairs across 29 ranked companies (max Wash Index: 84.2) — greedy 1:1 matching ensures each event appears in at most one pair
- 368 companies tracked across 8 sectors with AI-powered classification
- 267 automated tests with zero production runtime errors
- 23 pages (14 public + 9 admin dashboard)
- 3 public REST API endpoints with filtering, pagination, and documented response shapes
- Lighthouse: Performance 80 / Accessibility 100 / Best Practices 100 / SEO 100
- CSV export, email alerts, RSS feed, social sharing, dark mode
Challenges we ran into
- Rate limiting: GDELT and GNews APIs have strict rate limits. We implemented batching delays and graceful degradation per data source — if one source fails, the other 10 continue.
- Company resolution: The same company appears under many names ("Volkswagen AG", "VW Group", "Volkswagen"). Our 5-step resolver handles exact, alias, parent company, and fuzzy matching.
- Scoring validation: AI models can hallucinate scores. We never trust Claude's final_score directly — AI provides component inputs, but final G-Score and C-Score are always recomputed locally using deterministic formulas.
- Time budget: All pipeline operations must complete within Vercel's 60-second limit on the free tier. We split into 3 independent cron jobs and maintain a 50-second budget with 10-second buffer.
- Cross-week pairing at scale: Pairing events across 143 weeks required efficient matching with ESG category constraints to avoid false positives while catching genuine months-spanning patterns.
Accomplishments that we're proud of
- First platform to computationally pair corporate sustainability claims against EPA government data at scale
- Cross-week temporal detection catches greenwashing patterns spanning months — not just same-day coincidences
- The Wash Index formula only flags greenwashing when BOTH a loud claim AND significant harm exist — minimizing false positives
- Deterministic validation means every score is reproducible and auditable
- Full admin dashboard with score override, audit trail, and manual pipeline triggers
- Production-quality UX: dark mode, animated charts, company comparison, sector heatmap, social sharing, CSV export, email alerts, RSS feed
- Fully autonomous pipeline running 24/7 on Vercel free tier
What we learned
- Government data is the most powerful tool for accountability — EPA filings can't be edited or deleted by companies
- Dual scoring (reality vs claims) is far more nuanced than simple sentiment analysis
- Cross-week temporal analysis reveals patterns invisible to same-week analysis — some of the most egregious greenwashing spans months
- Deterministic validation of AI outputs is essential for trust and reproducibility
- Split pipeline architecture (separate ingestion from processing) dramatically improves reliability
What's next for EnviroWash
- International expansion: Add EU CSRD reporting data, ESMA filings, UK Environment Agency, and CDP Climate Disclosures to detect greenwashing globally
- Real-time push notifications: Alert subscribers instantly when new wash pairs are detected
- Browser extension: Flag greenwashing claims in articles as users read them, powered by the EnviroWash API
- ESG data provider integrations: Connect with MSCI, Sustainalytics, and Bloomberg ESG data for richer company profiles
- Corporate accountability reports: Auto-generate quarterly PDF reports ranking companies by sector with trend analysis
- Government agency partnerships: Provide bulk API access for regulators to integrate EnviroWash data into enforcement workflows
Built With
- anthropic
- api
- claude
- css
- next.js
- postgresql
- react
- recharts
- supabase
- tailwind
- typescript
- vercel
- vitest
Log in or sign up for Devpost to join the conversation.