-
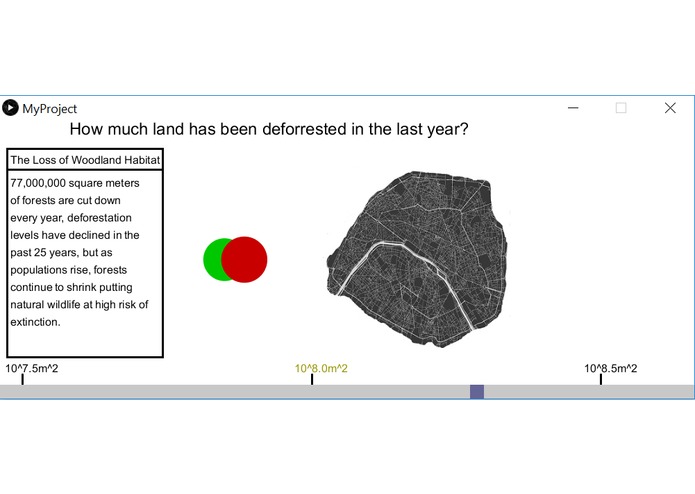
Add context to sometimes arbitrary sounding environmental data
-
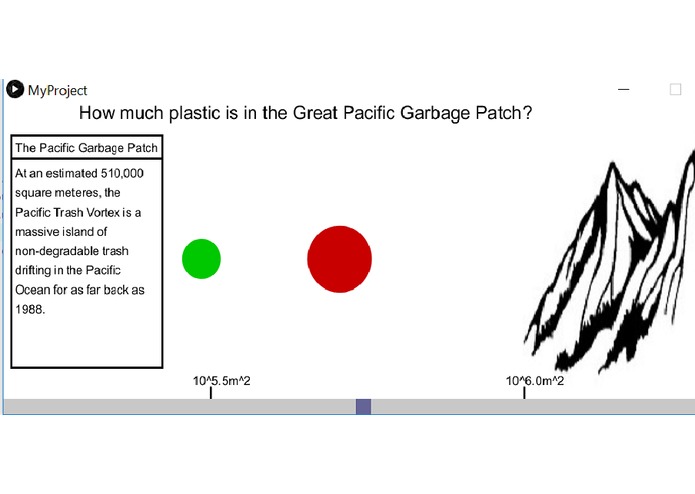
Try to guess the size of common environmental data
-
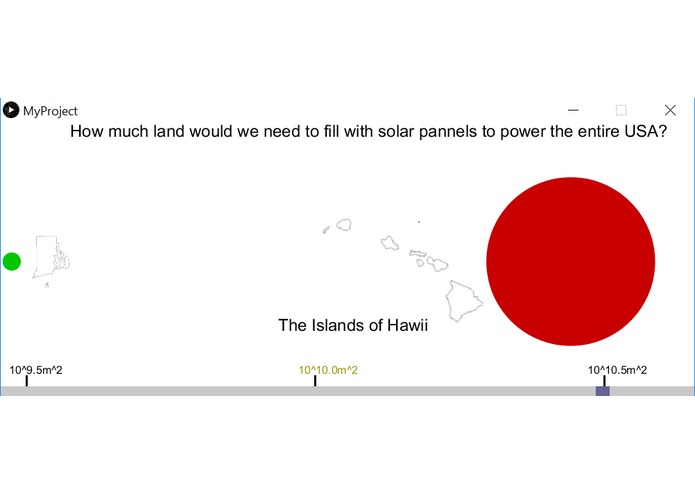
Compare sizes to real life benchmarks
-
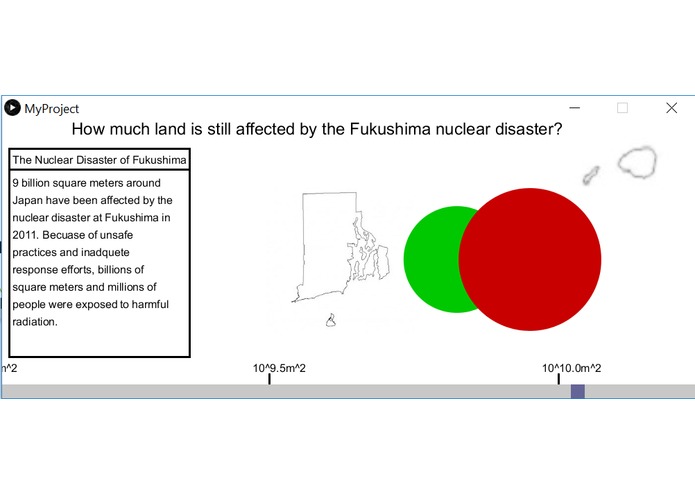
Helpful text box information about each real value
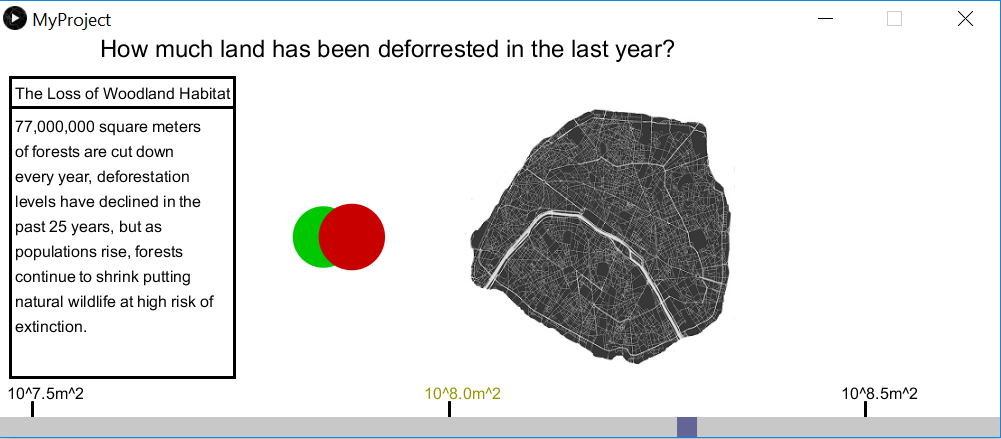
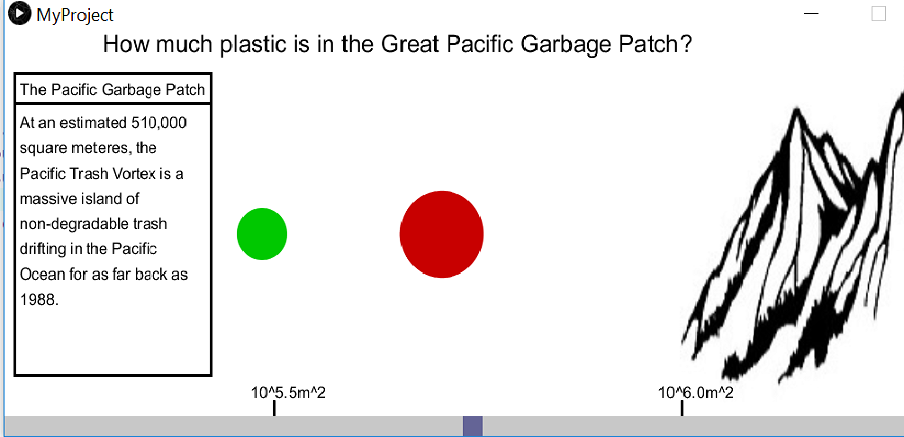
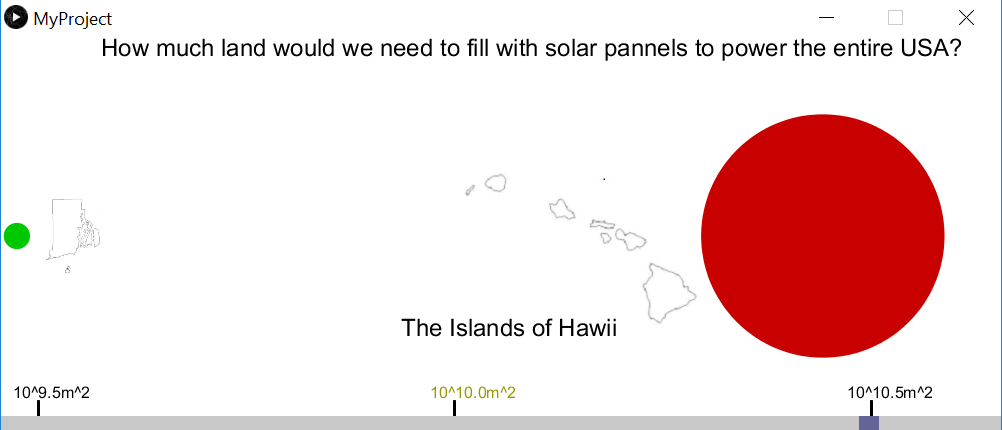
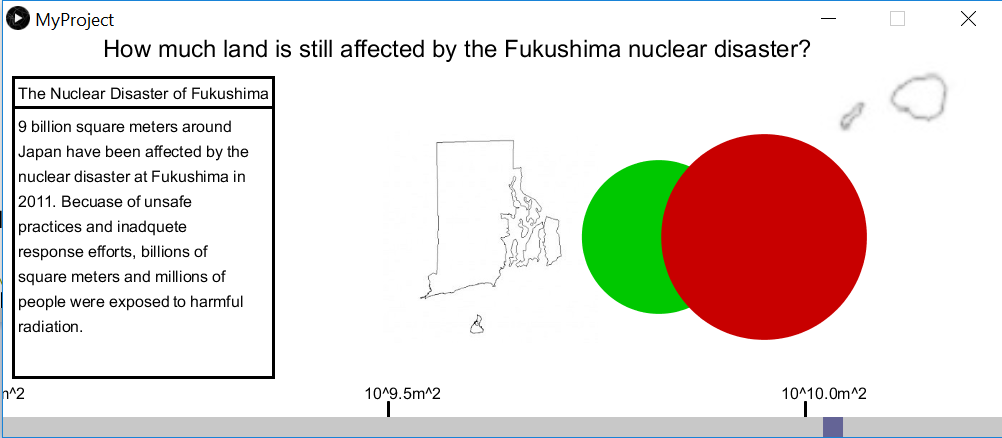
Inspiration
Often when learning about environmental issues and what is happening to our planet, numbers are thrown out about how much trash is produced or how many trees are being cut down without providing any context for those numbers. We wanted to give an easy and interactive way to add that context back in.
What it does
Environmentalism Visualized is a short interactive guessing game where users are prompted with questions and asked to pick a size they think is closest to the answer. The actual answer is then given and compared with real life objects while providing a short description of what's going on in the real world about this. This creates a fun and insightful dynamic where users try to get their guess as close as possible while finally getting a grounded comparison of what these values mean.
How I built it
This was built in Processing 3 with public domain jpeg images.
Challenges I ran into
Finding accurate values for sizes and representative images that maintain the art style was the most challenging aspect because of our limited experience in this area. This was also our fist time developing in Processing so that we had to pick up a lot of syntax on the fly.
Accomplishments that I'm proud of
Creating an accurate scrolling and scaling system for 1:1 comparisons of objects is the most reusable and unique aspects of this project.
What I learned
We learned how to make Processing scripts. We also learned best practices for scrollbars and how scale images dynamically.
What's next for Environmentalism Visualized
A more publicly available format to enlighten and inspire others.


Log in or sign up for Devpost to join the conversation.