-
-
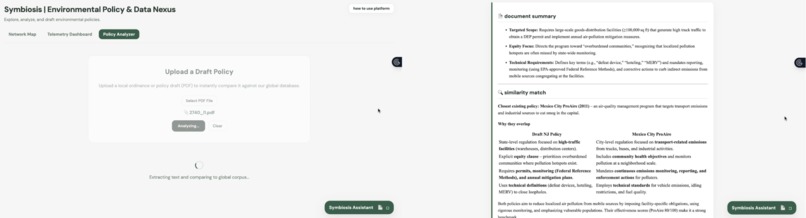
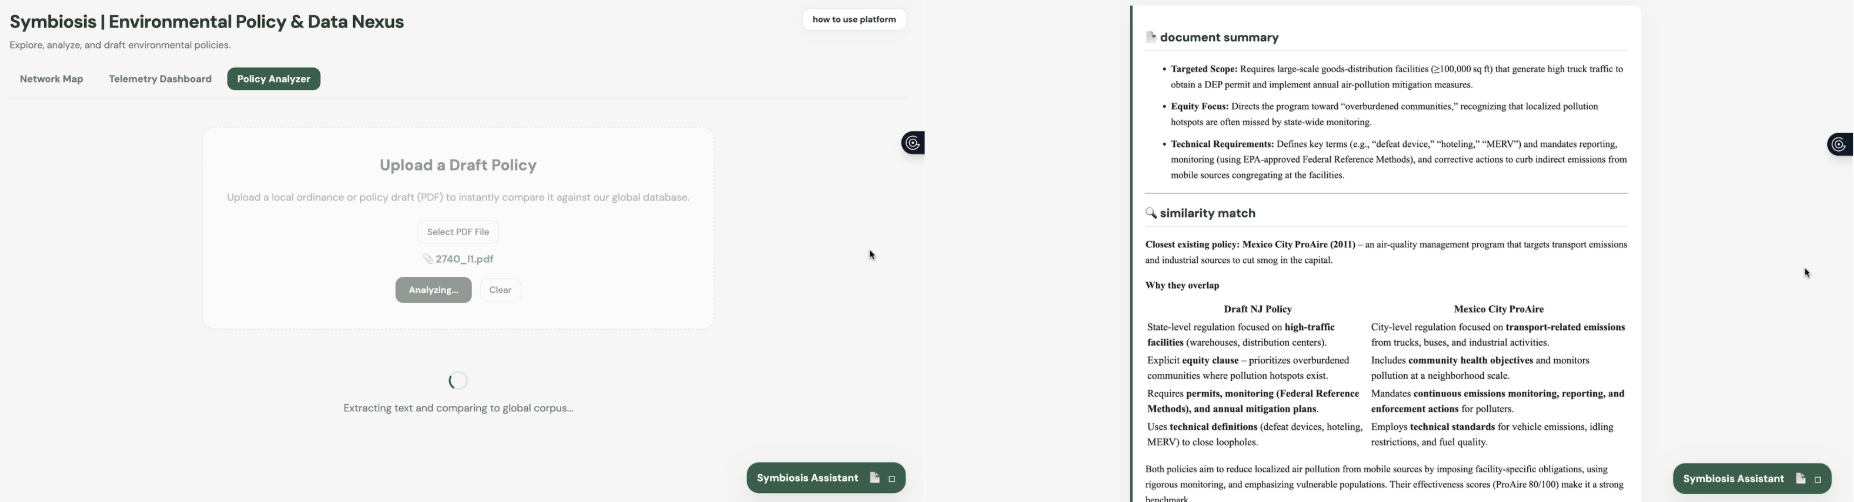
policy analyzer
-
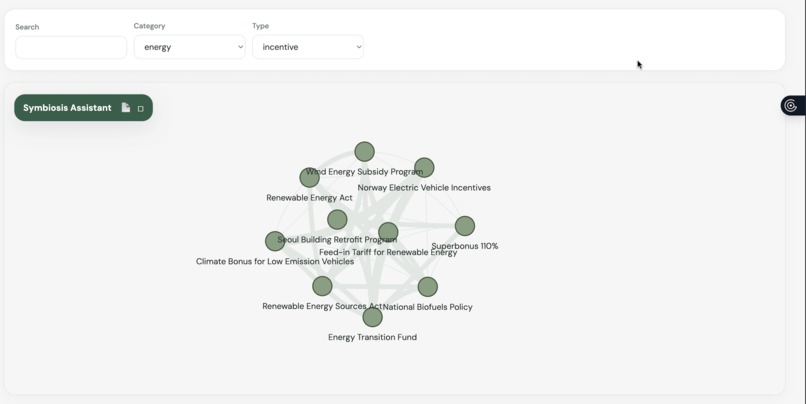
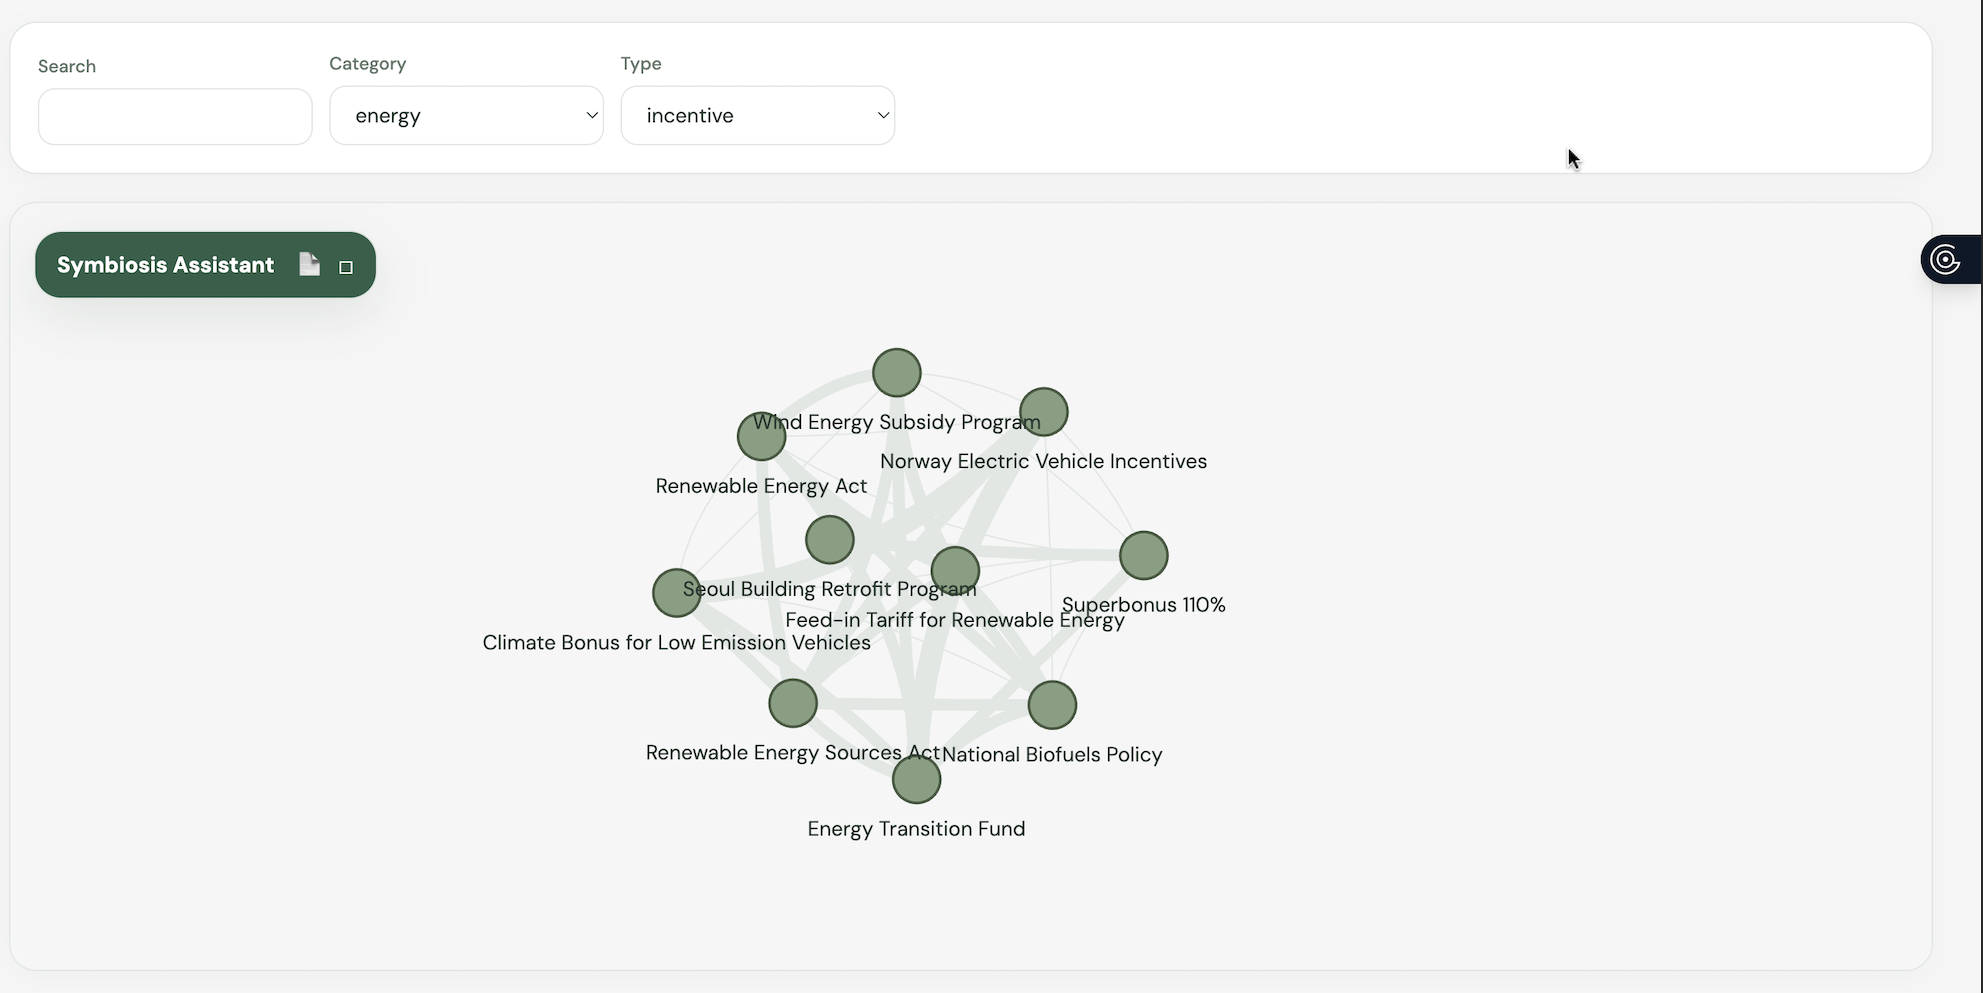
the network map
-
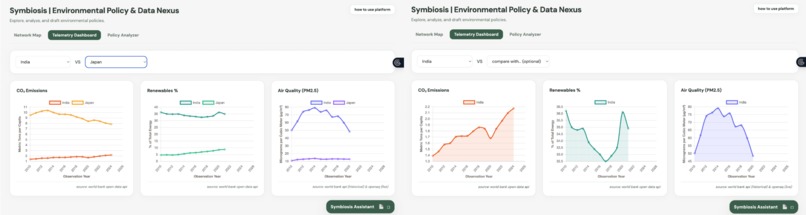
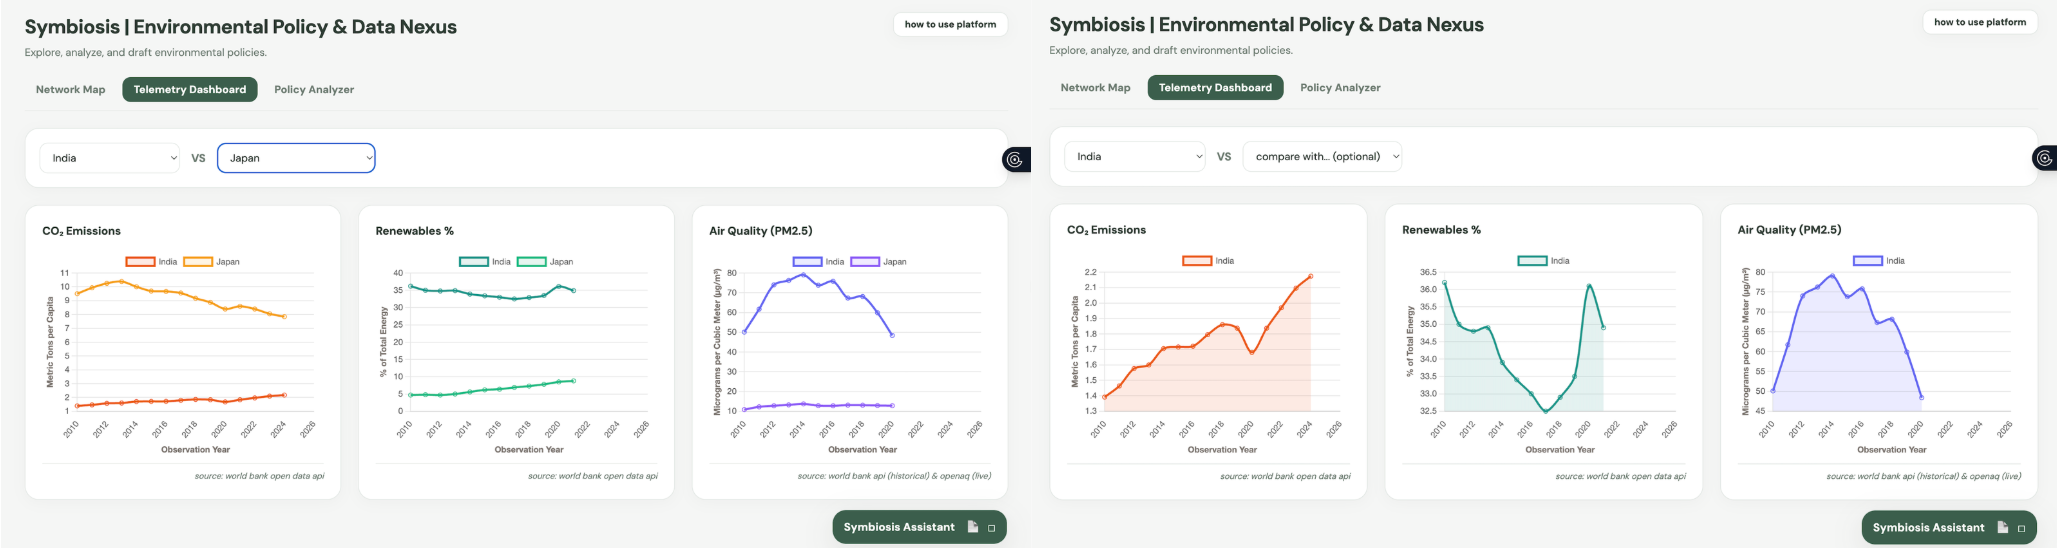
telemetry dashboard
-
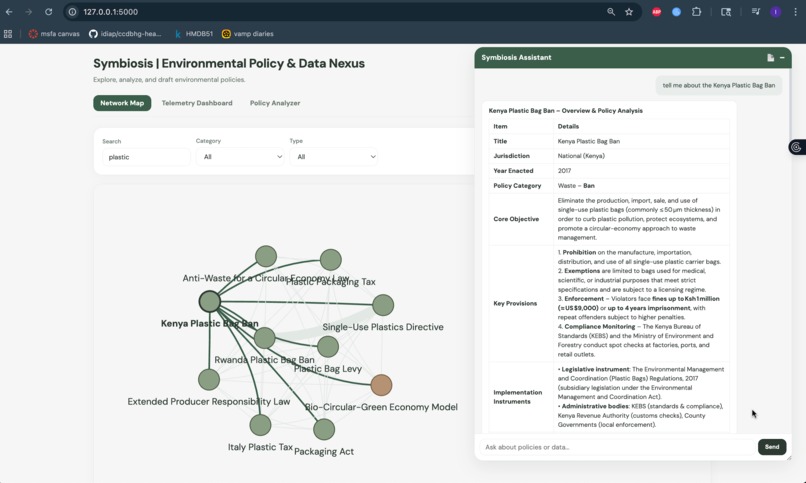
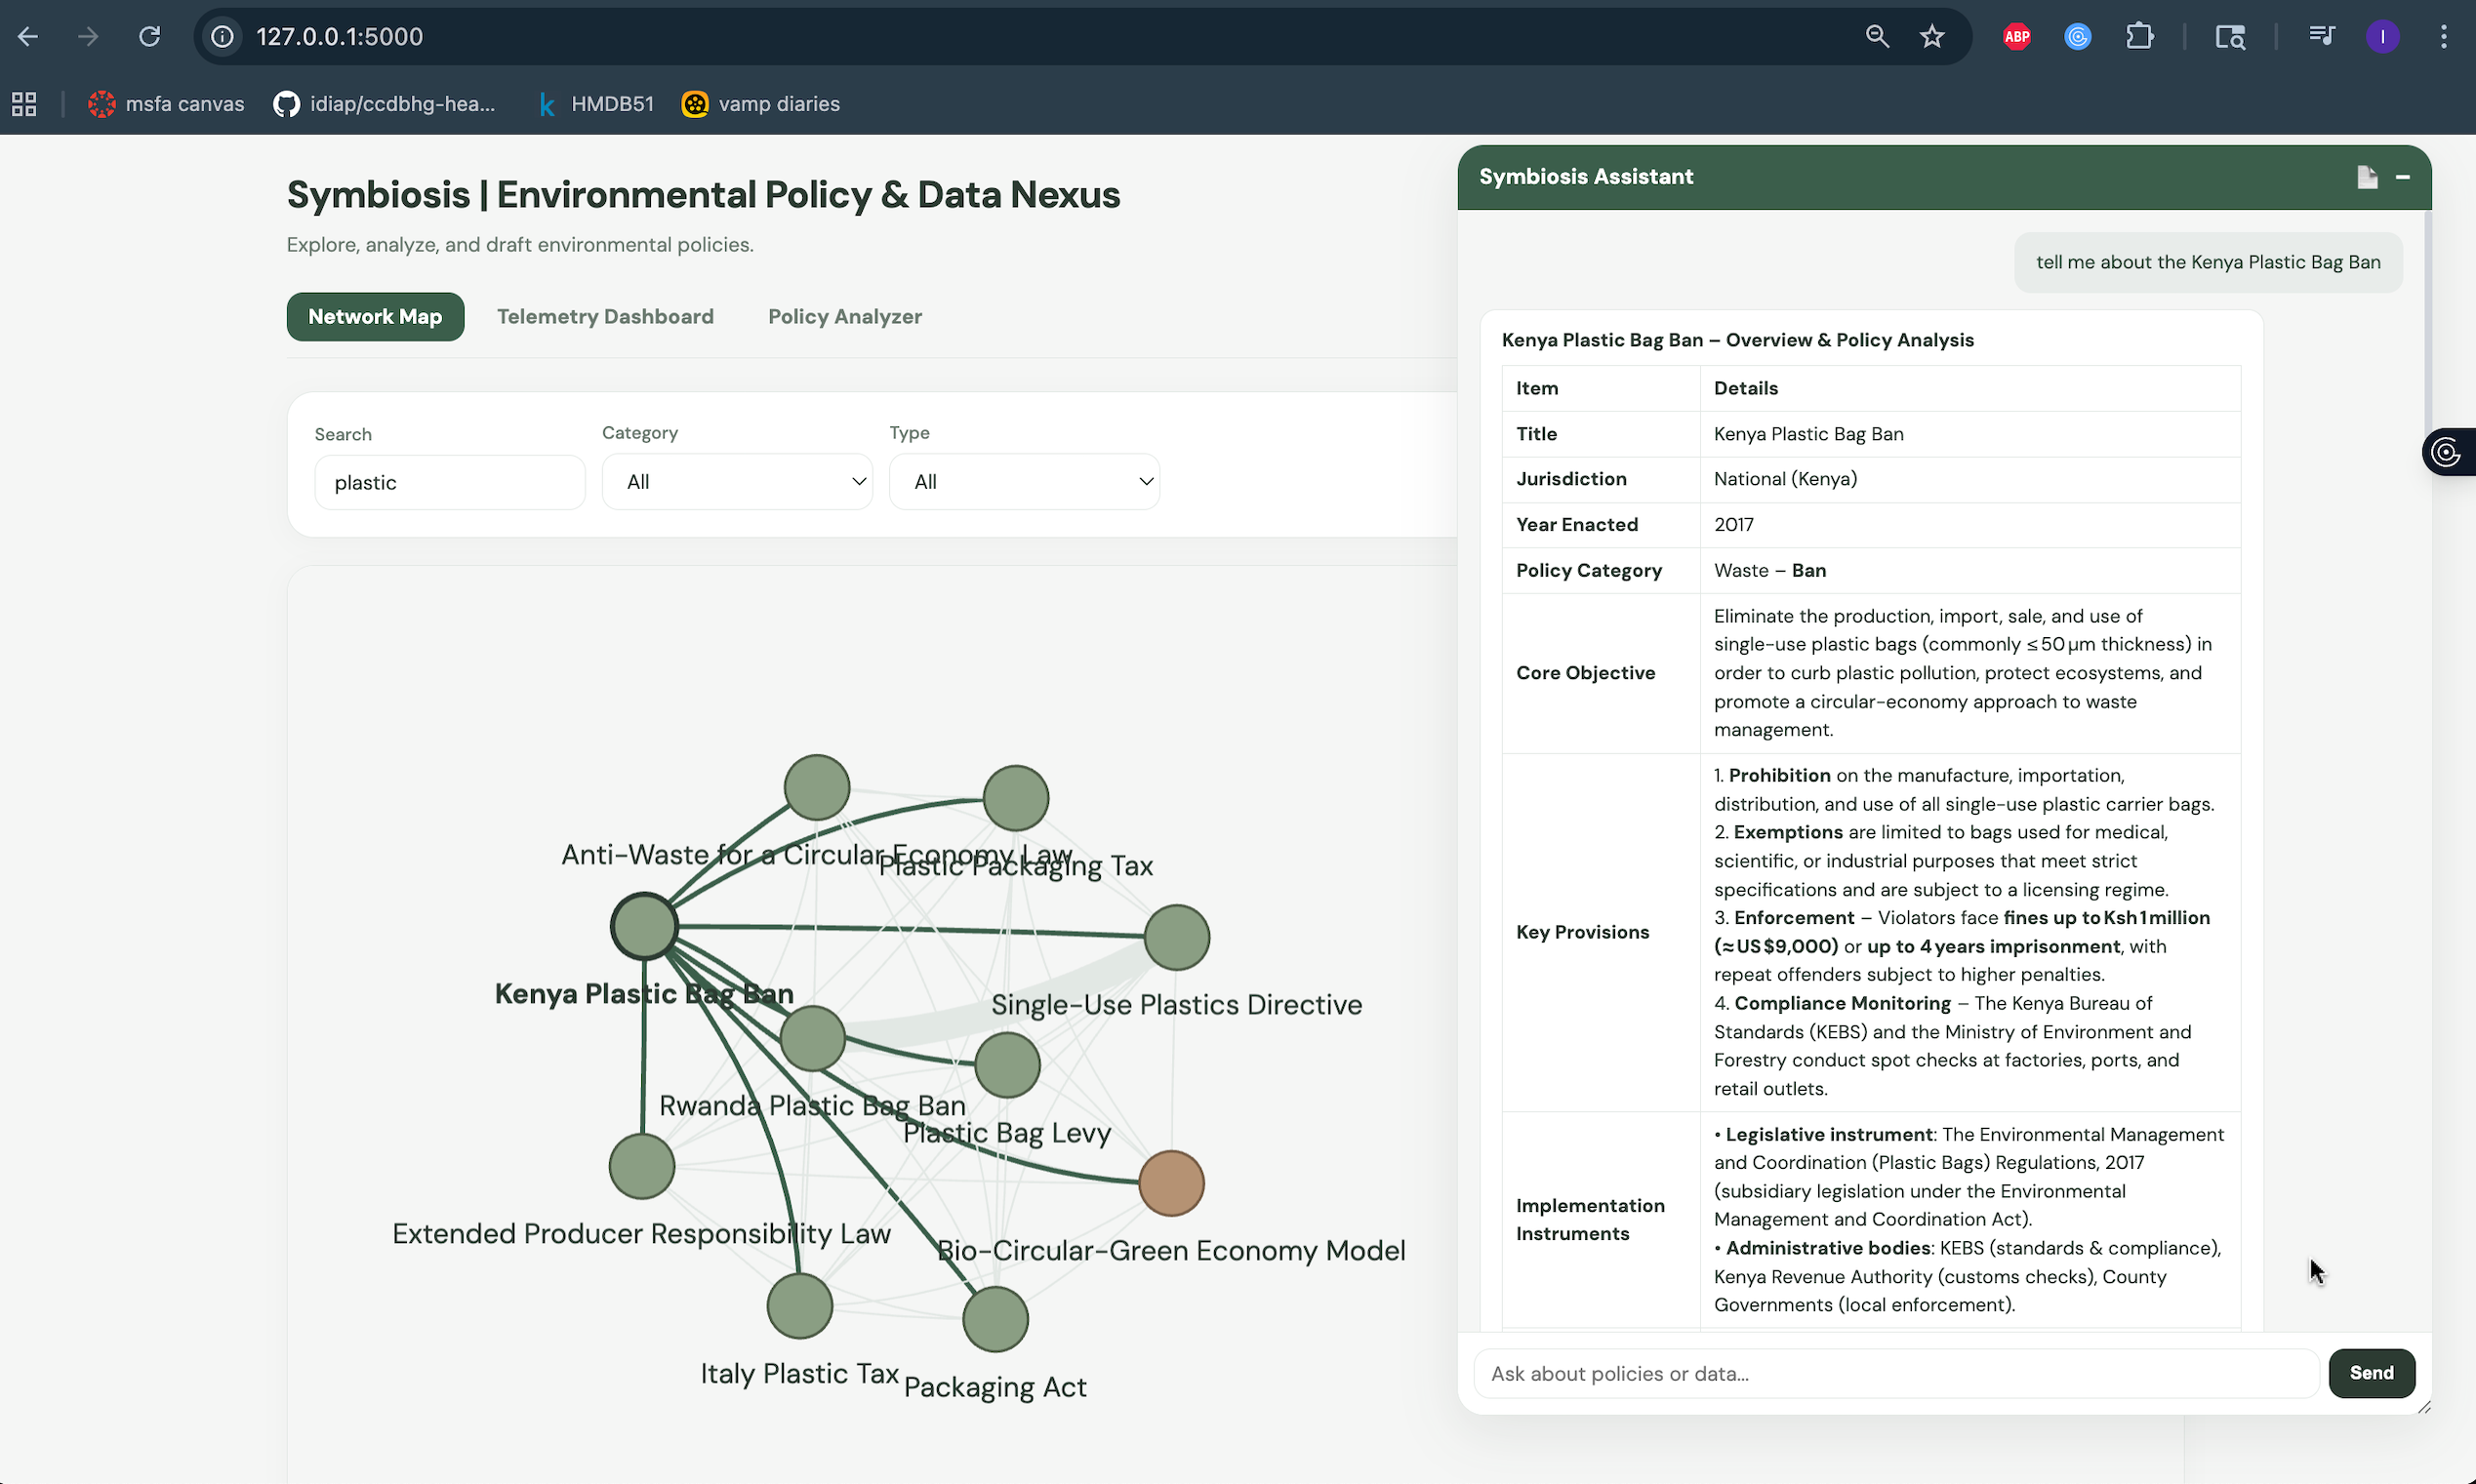
ai analyst feature
Inspiration
For the past four years, I have worked at the NJ Food Democracy Collaborative. Through my time there, I have worked on policy briefs that compared different regional organic farming routes and even created literature reviews synthesizing biodigestion policies across the Globe. While I loved the work I was doing, I had to admit: global environmental policy was full of confusing jargon, oftentimes contradictory, and poorly organized
This gave way to the larger issue: global environmental rules are incredibly scattered. Instead of a united effort, we have a messy, disconnected web of different institutions and methods. This makes it hard to create policies that actually work and makes it difficult to understand the computer models we use to predict climate outcomes.
This problem is made much worse by corporate lobbying. Large companies, especially in the petroleum and utility sectors, spend hundreds of millions of dollars to block, delay, or water down climate regulations. They often hide this lobbying by using obscure legislative codes so the public doesn't notice, creating a huge gap between their public "green" promises and what they actually push for behind closed doors.
On top of this, decades of corporate-funded misinformation have created deep political divides and confused the public about climate science. As a result, most people do not know much about their regional environmental policies or how those local laws impact the global climate. This widespread confusion makes it extremely hard for lawmakers to build and sustain public support for strong environmental rules, especially if those rules seem expensive upfront. When you add up the cost of this scattered system, the aggressive lobbying, and our failure to act, the results are devastating. When factoring in the damage to our ecosystems, climate-fueled disasters cost the world over $2.3 trillion every single year.
To stop the planet from crossing dangerous, irreversible tipping points, we have to carefully manage our "carbon budget," the total amount of greenhouse gases we can still emit before we lock in a certain amount of warming. If we want to keep global warming to the safer limit of 1.5 C , our remaining budget is very small, which means we have to cut global emissions drastically by 55% by the year 2035.
Recognizing the huge gap between abstract environmental laws, public awareness, and the actual numbers we need to hit, Symbiosis was conceptualized to serve as a digital bridge. It is designed to help users clearly see and analyze how international and local policies actually affect real-world environmental outcomes.
What it does
Symbiosis is a platform that connects abstract environmental laws with real-world data. It helps make sense of our scattered global environmental rules by offering four main features:
Interactive Network Map This feature creates a visual web of global environmental laws. Using a physics-based graphing tool, it automatically groups policies together based on shared traits like whether they use carbon taxes, ban plastics, or target specific regions. This helps researchers and lawmakers easily see how different rules connect and spot areas where policies might overlap or duplicate each other.
Live Data Dashboard We want to know if policies actually work. This dashboard takes 60 years of historical data (like CO2 emissions per person and renewable energy use) and live air quality readings, then plots them on easy-to-read charts. It overlays vertical lines showing exactly when major policies were passed in a specific country. This lets users visually track the timeline and see if a new law actually led to a drop in pollution in the years that followed.
AI Policy Analyzer Think of this as a digital workshop for writing better environmental rules. Users can upload a draft of a local policy or ordinance as a PDF. The system quickly reads the document and compares it against our database of major global laws. It finds the closest matching historical policies and gives actionable advice on how to improve the draft based on what has worked (or failed) in the past.
Intelligent AI Assistant & Report Generator I built a chat assistant that only pulls answers from our specific database of laws and real-world data, which prevents it from guessing or making things up. Even better, with a click of a button, the assistant can take all the live data and policy history for a specific country and instantly write a professional, easy-to-read executive report summarizing that region's progress.
How I built it
1. Research and Development Before writing any code, I needed to understand the core problems in global environmental governance. I fed dense academic papers and reports into NotebookLM. This allowed me to rapidly synthesize complex concepts, such as the mathematical differences between temperature target carbon budgets and the mechanics of regulatory arbitrage. This research phase directly informed the features I needed to build to solve these real-world problems.
2. Curating the Policy Database The foundation of this platform is a custom database containing over 80 major environmental laws, taxes, and mandates from around the world. I compiled this into a structured CSV file, manually tagging each policy with specific mechanisms (such as carbon pricing, circular economy, or biodiversity protection). This structured dataset acts as the single source of truth for both the visual map and the AI assistant.
3. Frontend Visualization with Vanilla JavaScript To keep the application highly responsive and avoid unnecessary framework bloat, I built the frontend using vanilla JavaScript, HTML, and CSS. I utilized the vis.js library to build the interactive policy map. I specifically tuned the forceAtlas2Based physics solver, adjusting the gravitational constants and spring lengths so that policies sharing multiple tags would organically pull together into biological-looking clusters. For the country-based charts, I used Chart.js alongside an annotation plugin to render the data.
4. RAG Pipeline and GreenPT Integration I wanted an AI assistant that was strictly grounded in environmental reality. To achieve this, I built a Retrieval-Augmented Generation (RAG) pipeline. I used LangChain to process our policy database and FAISS to build a high-speed, local vector index. I connected to the GreenPT API (an OpenAI-compatible provider focused on environmental data) to generate the vector embeddings for every policy. When a user asks a question, the system converts the query into a vector and performs a similarity search against the FAISS database to find the 15 most relevant policies. The matched policies are injected into a strict prompt template alongside the user's question. The GreenPT large language model then reads this specific context and generates an answer grounded entirely in our curated dataset.
5. Integrating World Bank and OpenAQ APIs To measure whether these policies actually worked, I built a dynamic data ingestion layer in the Flask backend using the requests library. I asynchronously queried the World Bank Open Data API to fetch 60-year historical timelines for CO2 emissions per capita and renewable energy adoption rates. Because official government data often lags by a few years, I also integrated the OpenAQ API. This allows us to fetch absolute real-time particulate matter (PM2.5) measurements from live air quality sensors. Our backend mathematically stitches these disparate historical and live data arrays together into a single, cohesive timeline so the frontend charts render perfectly without X-axis misalignment.
6. In-Memory Document Parsing with PyPDF2 To make the platform actionable for lawmakers and researchers, I built the Policy Analyzer. When a user uploads a draft ordinance as a PDF, the Flask backend intercepts the file and uses the PyPDF2 library to extract the raw text page by page. This extraction happens entirely in-memory on the server, meaning, we never save the user's file to a hard drive, which prevents disk bloat and maintains strict data security. Once the text is extracted, it is truncated to fit the token window and passed directly into our RAG pipeline, which compares the draft against historical laws to output a structured critique and similarity match.
Challenges I ran into
Building a reliable Retrieval-Augmented Generation (RAG) pipeline from scratch presented a steep learning curve, particularly when integrating LangChain and FAISS with the specialized GreenPT API. The primary challenge was managing the context window and token limits during the document analysis phase. When extracting text from user-uploaded PDFs via PyPDF2, I had to implement hard truncation constraints (capping searches at 2000 characters and full context at 4000 characters) to avoid overflowing the embedding models. Furthermore, designing the prompt templates required rigorous structuring to force the LLM to strictly rely on the injected vector context rather than its pre-trained weights, effectively neutralizing hallucination risks.
Additionally, while the vis.js library is powerful, its default physics engine is highly volatile. Translating my raw CSV data into an organic, biological-looking network required extensive mathematical tuning of the forceAtlas2Based solver. I had to balance the repulsive and attractive forces to prevent the policy nodes from either collapsing into an unreadable cluster or endlessly repelling each other off the canvas. This required locking in specific parameters: a negative gravitational constant, a weak central gravity, and precise spring lengths to ensure policies with shared tags grouped together cleanly without chaotic continuous movement.
Furthermore, relying on external datasets for the telemetry dashboard introduced major synchronization and performance hurdles. Fetching 60 years of historical data across multiple indicators for simultaneous country comparisons caused noticeable latency. I had to wrap these requests in asynchronous Promise.all functions on the frontend so the UI would not freeze while waiting for the network payloads.
I also spent a significant amount of time debugging silent failures caused by outdated World Bank API documentation. For example, the legacy CO2 per capita indicator I initially queried had been quietly deprecated and was returning empty arrays without throwing standard HTTP errors. I had to dig through the data catalogs to identify and map the modern AR5 CO2 indicator and manually expand the pagination limits to 60 items because recent years frequently returned null values, which was cutting off the usable historical timeline.
Accomplishments that I'm proud of
Automated Policy Comparison & Workshopping: I am incredibly proud of the RAG-driven Policy Analyzer. I successfully took a dense, static database of global environmental laws and turned it into an active tool that can instantly read a draft ordinance, pinpoint its closest historical matches, and offer concrete, data-backed improvement recommendations.
Instant Executive Brief Generation: I engineered a robust reporting feature that bridges the gap between raw data and professional analysis. The system can synthesize live telemetry (like current PM2.5 levels and 60-year CO2 trends) with a country's legislative history to automatically draft highly structured, professional policy reports on demand.
Organic Data Visualization: Transforming rigid CSV data into a fluid, physics-based network map that visually proves how global policies intersect and overlap was a major design win that makes complex governance architectures instantly understandable.
What I learned
Building Symbiosis provided an intensive crash course in both full-stack data engineering and global climate policy. From a technical perspective, I learned the intricacies of managing token limits and context windows within a Retrieval-Augmented Generation (RAG) architecture. Forcing an AI model to behave deterministically when handling sensitive legal frameworks taught me how to write strict prompt templates and rely entirely on vectorized context.
On the policy side, digging into the research highlighted the severe impact of regulatory arbitrage and corporate lobbying. I learned that the lack of standardized environmental metrics across different jurisdictions directly allows companies to exploit legal loopholes, leading to carbon leakage. Building the telemetry dashboard made it clear that without uniform data reporting and cohesive, cross-border legislation, tracking our progress against the shrinking global carbon budget is nearly impossible.
What's next for Symbiosis
The next major evolution for Symbiosis is transforming it from a static analytical tool into an interactive, social policy network. I plan to build a dedicated social layer directly into the platform where researchers, local lawmakers, and citizens can post, discuss, and annotate specific environmental policies.
This social expansion will include:
Node-Based Discourse: Users will be able to click on any policy node in the network map and open a dedicated discussion thread, allowing for real-time debate on the efficacy or flaws of that specific legislation.
Crowdsourced Policy Proposals: A feature allowing users to publicly share the draft ordinances they run through the AI Analyzer, enabling community review and version tracking before those policies are formally proposed to local governments.
Automated Data Ingestion: Replacing our static CSV database with an automated scraping pipeline that pulls freshly passed legislation from global government databases, automatically vectorizing new laws and updating the FAISS index and network graph in real-time.
Built With
- chart.js
- css
- faiss
- flask
- greenpt
- html
- javascript
- langchain
- marked.js
- numpy
- openaq
- pandas
- pypdf2
- python
- requests
- vis.js
- world-bank-climate


Log in or sign up for Devpost to join the conversation.