-
-

PiedPiper - Website
-

Cluster2
-

Cluster0
-

Cluster1
Inspiration
In the face of escalating environmental challenges and an environmentally aware society where most people moving towards the world of environmental sustainability, there is a crucial lack of comprehensive, transparent information regarding the sustainability of consumer products and the ability to make informed decisions about the sustainability of products is more critical than ever. Yet, consumers and businesses alike are often in the dark about the true environmental impact of the products they produce, sell, or purchase. This information gap undermines efforts to adopt more sustainable practices and make environmentally conscious choices. The existing methods to evaluate product sustainability are scattered, non-standardized, lack transparency, and are especially limited.
Our target industry, e-commerce, thrives on rapid data processing and requires seamless integration of detailed product information to enhance user experience and operational efficiency. However, the lack of integration of environmental data into e-commerce platforms means that consumers often lack the context needed to make eco-friendly choices, while businesses miss out on opportunities to highlight their commitment to sustainability.
By addressing these challenges, our solution not only supports individual decision-making but also drives industry-wide changes, promoting transparency, accountability, and a shift towards a greener economy. This is essential as both regulatory environments and consumer expectations evolve to demand higher environmental consciousness and more responsible business practices.
What it does
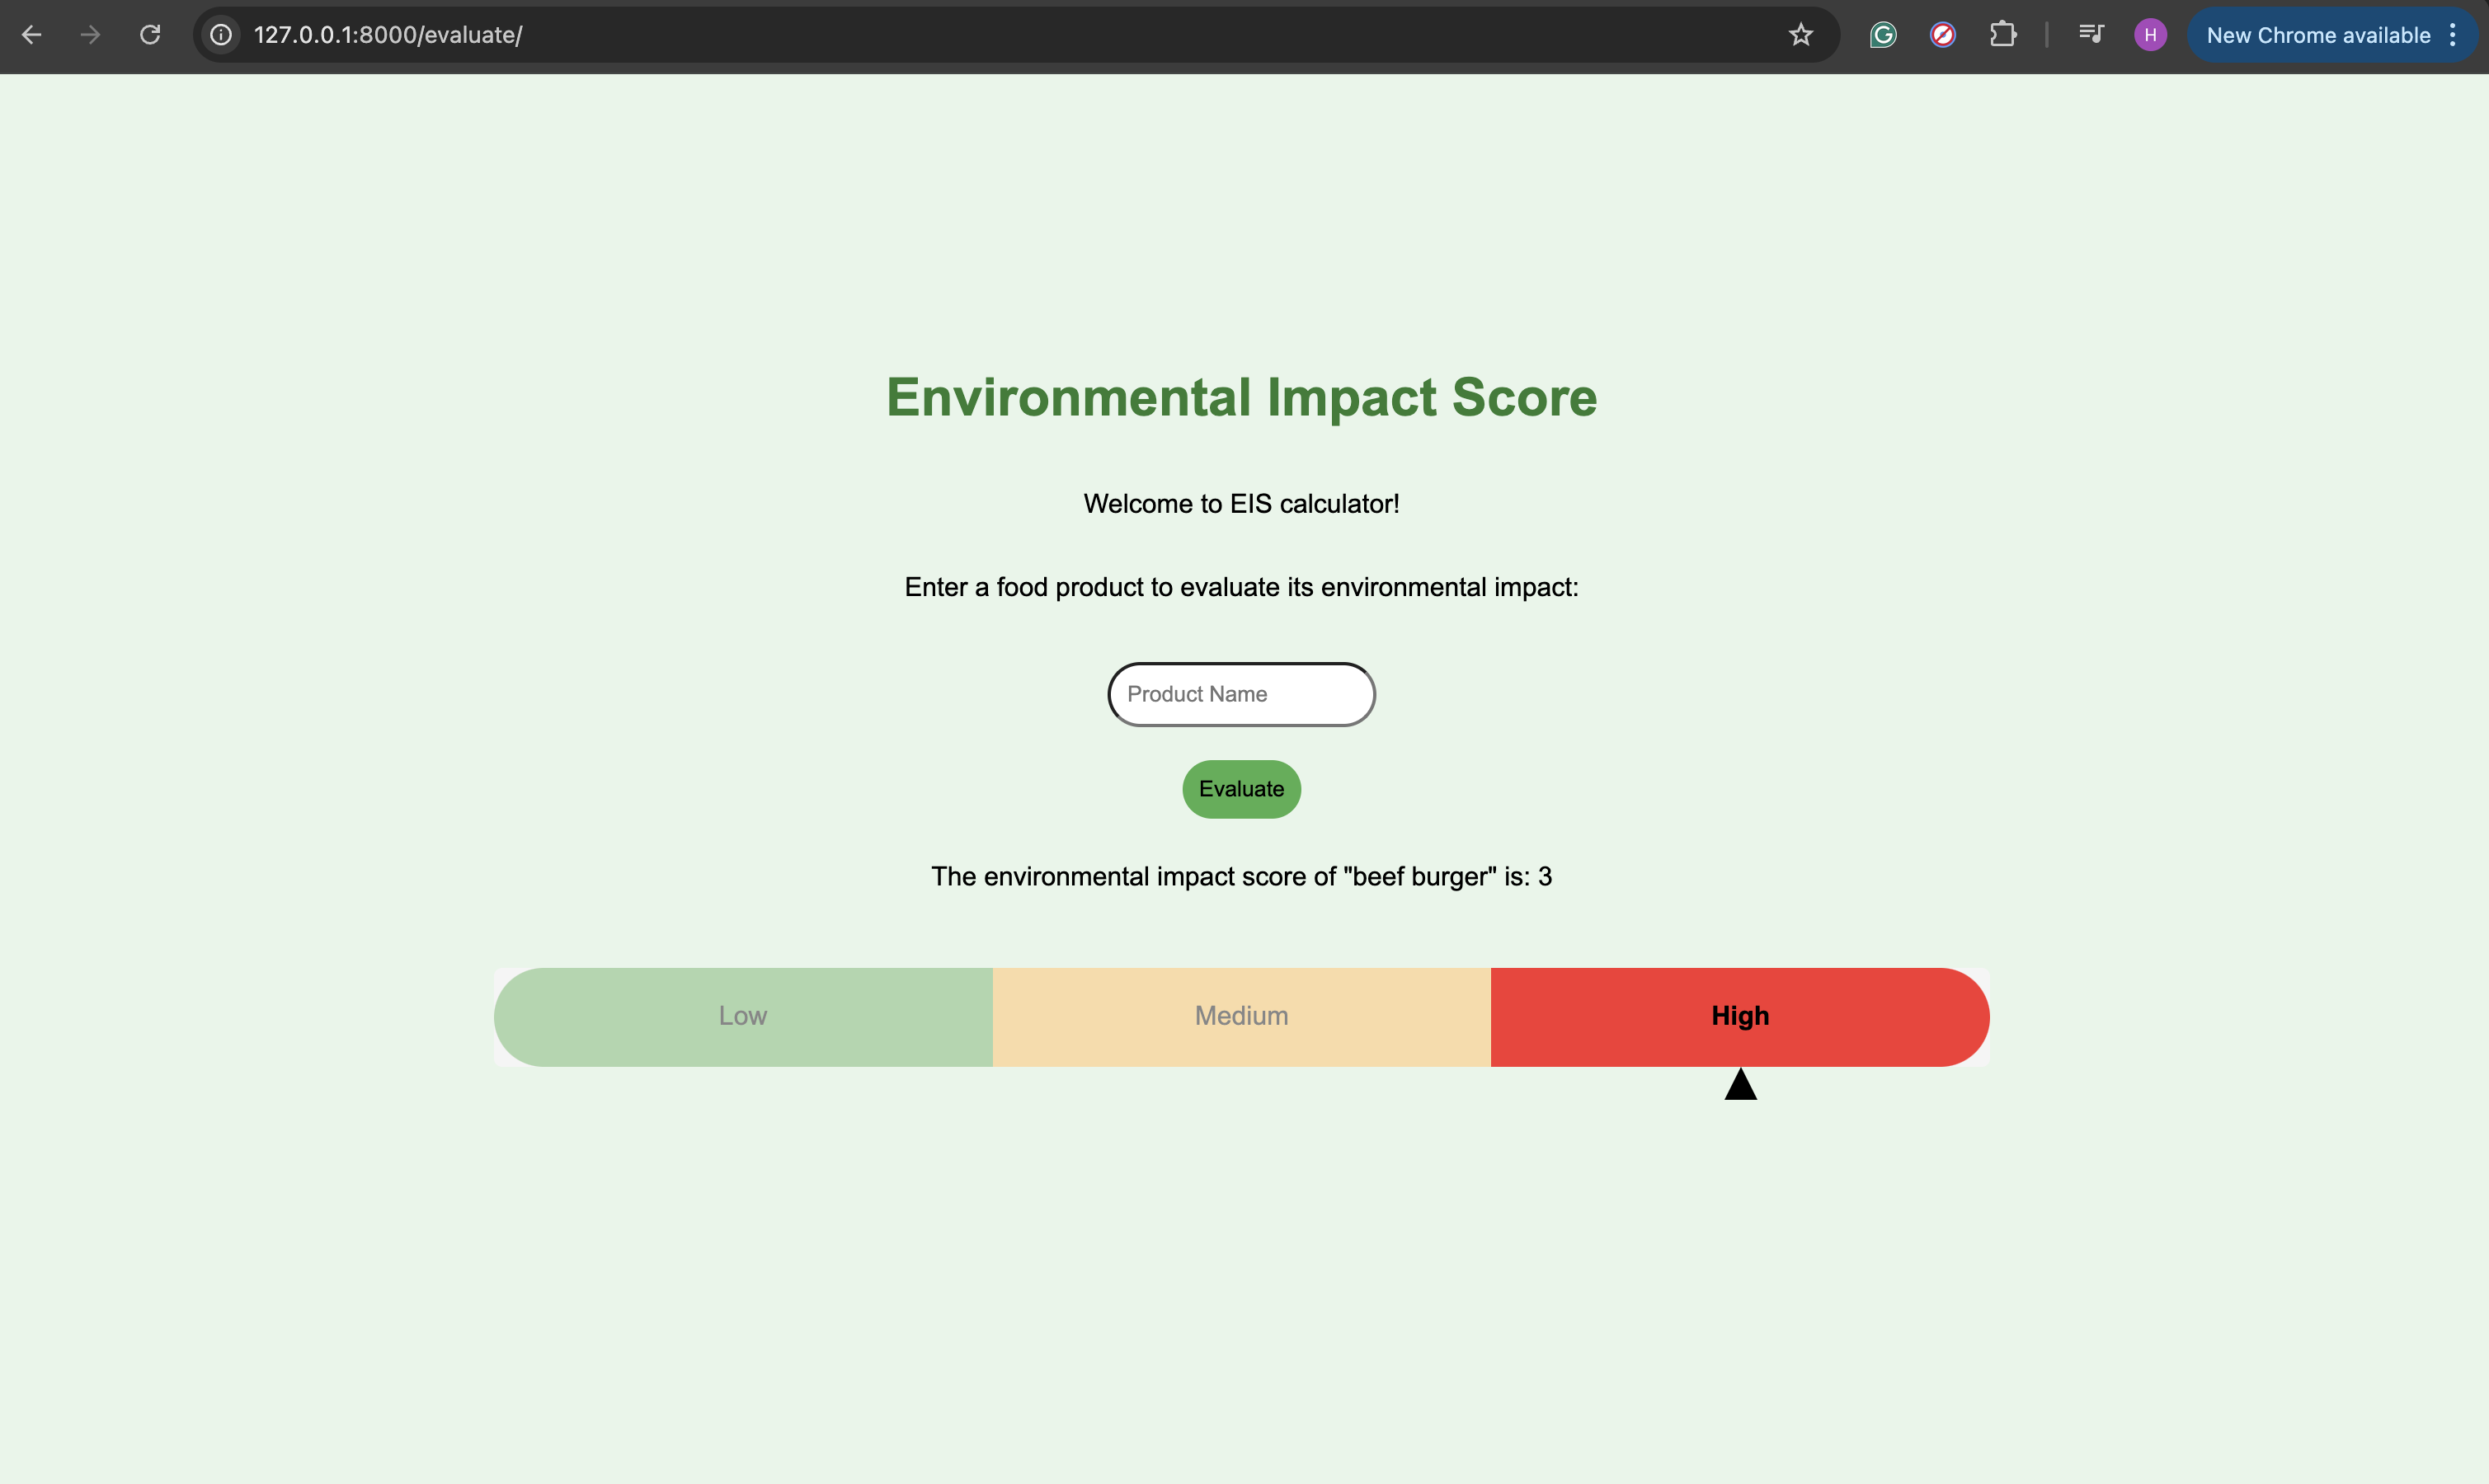
The Environmental Impact Score for Products provides users with a comprehensive score that reflects the ecological footprint of a product. By inputting the product name, users receive a score based on various factors like carbon emissions, water usage, and waste produced during the product's lifecycle. This enables them to compare products and make eco-friendly decisions.
How we built it
Data Flow:
- Data Collection: Raw data is collected from ourworldindata.org and for experimental purposes we used OpenAI’s API for the collection of some data
- Data Processing: Data is cleansed and transformed using Python packages such as NumPy, Pandas, and Scikit Learn.
- Feature engineering: Filter out specific columns from the dataset, focusing on environmental metrics like greenhouse gas emissions, water use, land use, water scarcity, and eutrophication values.
- Normalization: The selected data is normalized using MinMaxScaler. This step is crucial for clustering algorithms like K-means, which are sensitive to the scale of the data. Normalization ensures that each feature contributes equally to the distance calculations.
- Model Training: The processed data is fitted to a K-means clustering algorithm with the k set to 3.
- Cluster Analysis and score calculation: Analyzing and visualizing the clusters using HiPlot and ranking them based on their behavior gives us the EIS.
- LLM fine-tuning: The processed data is transformed into a conversational chat format, and used to fine-tune the gpt-4o-mini-2024-07-18 model from OpenAI.
- Data Presentation: Scores are retrieved by the Django server and displayed to the user through an animated slider.
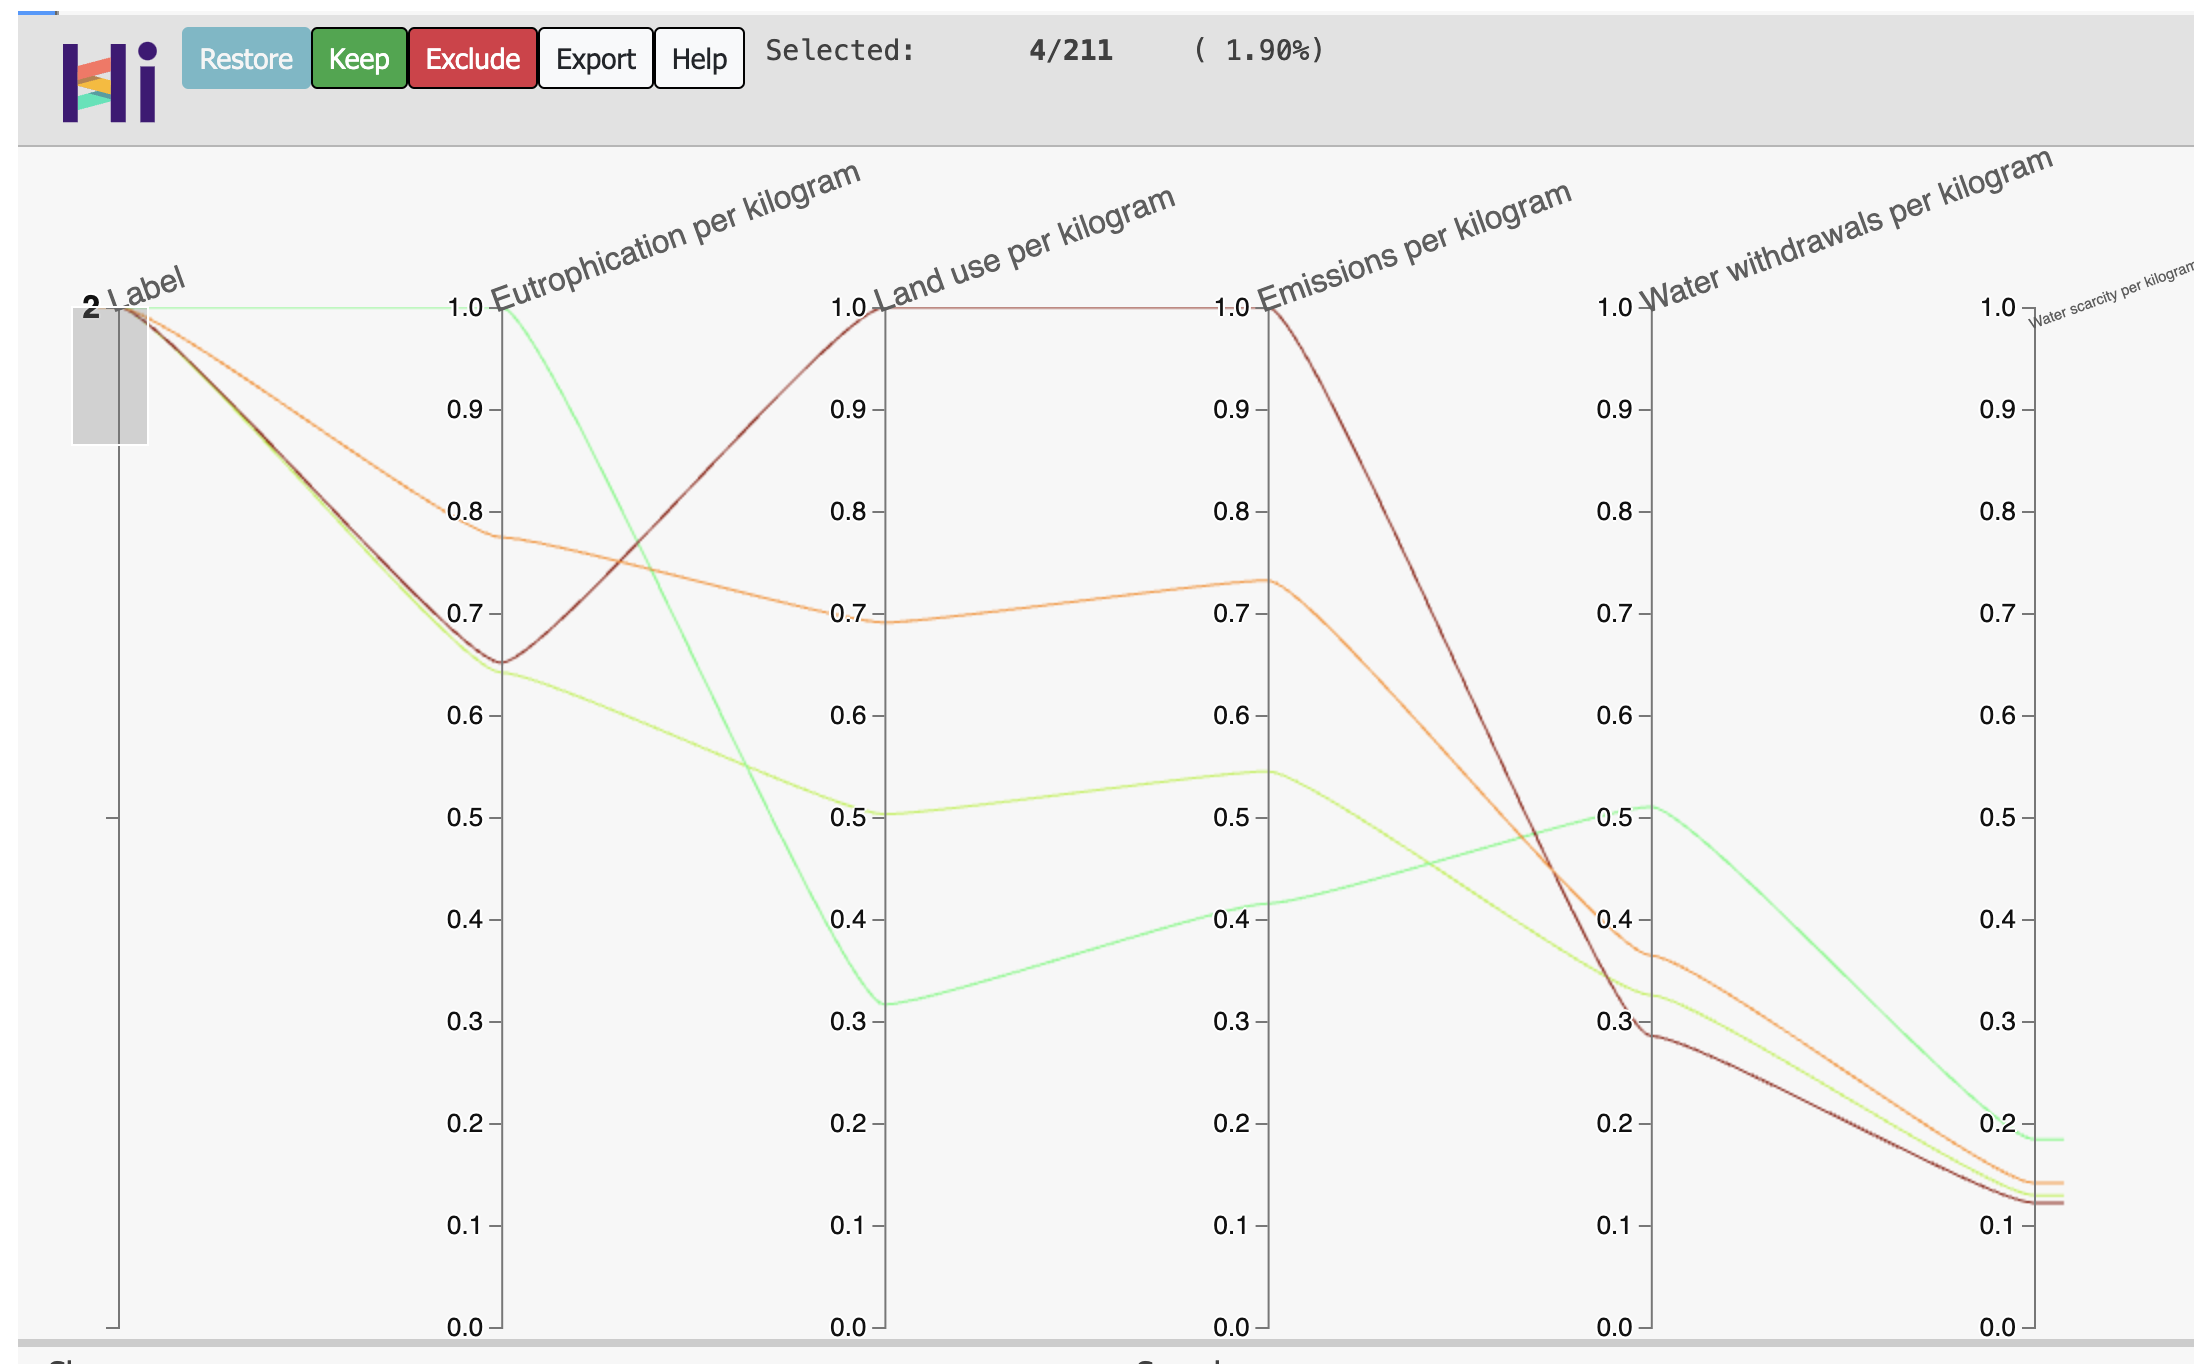
Clustering with K-Means K-Means Algorithm Setup: The code configures the K-means clustering algorithm with three clusters (n_clusters=3). This is based on the assumption that food items can be categorized into three distinct environmental impact levels (low, medium, high). Model Training: The K-means model is trained on the normalized data. The algorithm partitions the data into three clusters by minimizing the variance within each cluster. Label Assignment: After training, each data point (food item) is assigned a cluster label (0, 1, or 2), which is then appended to the dataset. Visualization and Further Analysis HiPlot Experiment: The hiplot library is used to visualize the high-dimensional data in an interactive experiment. This visualization helps in understanding the distribution and separation of clusters.
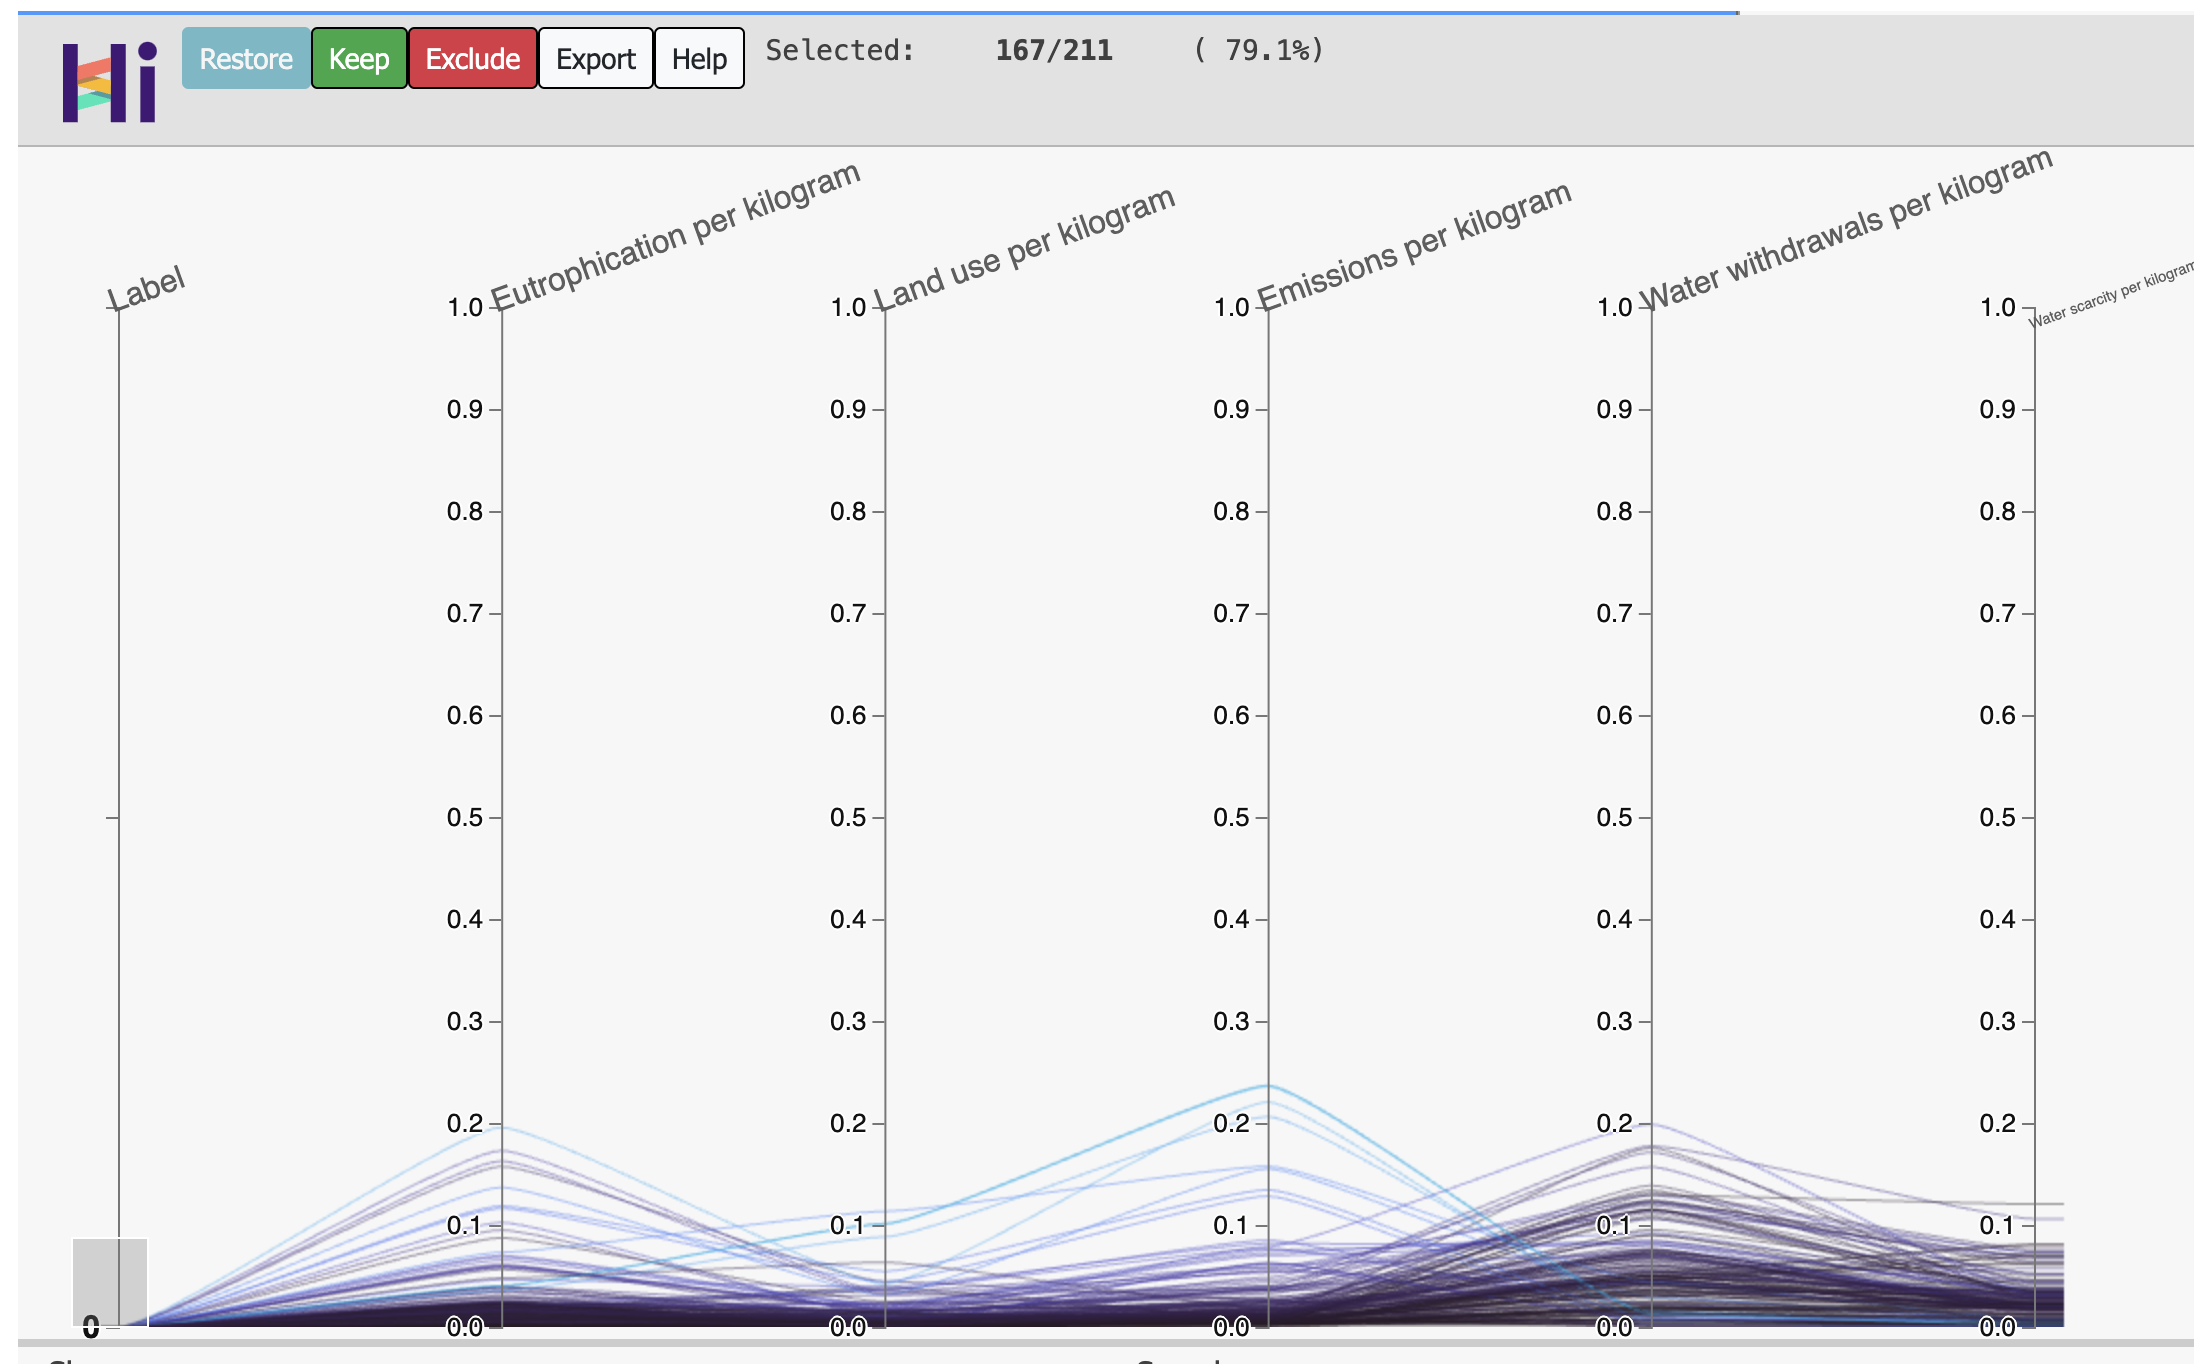
Parallel Plot for cluster-0
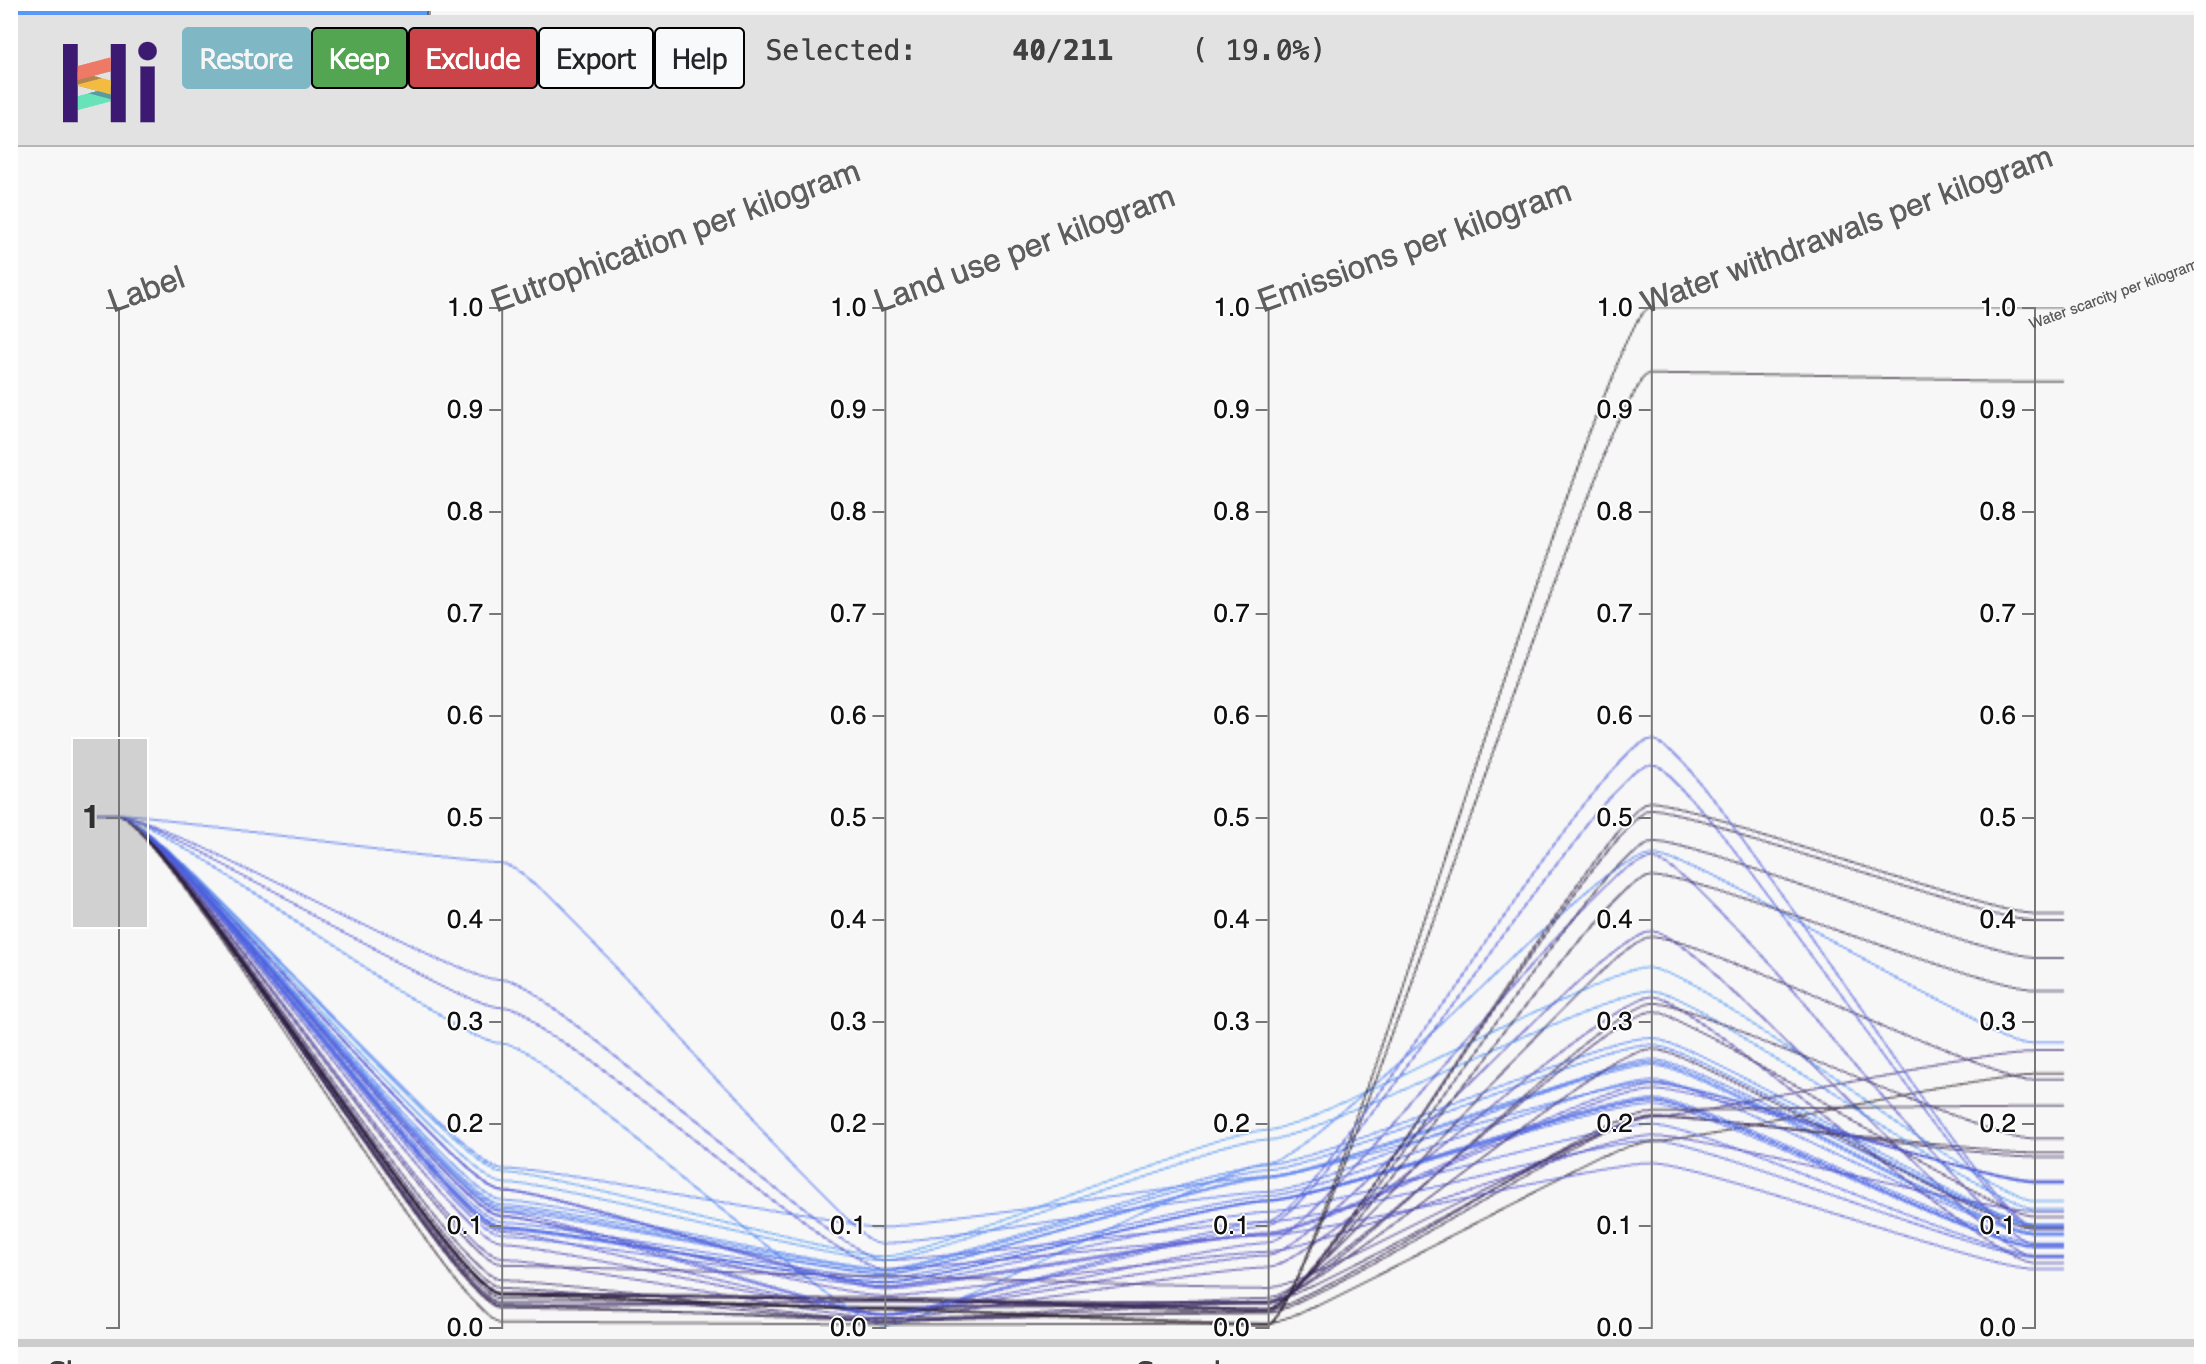
Parallel Plot for cluster-1
Parallel Plot for cluster-2 Prediction: The model predicts the cluster for a specific food item (“strawberry milkshake”) by first checking if it exists in the dataset. If not, it uses the OpenAI API to fetch the environmental metrics, which are then normalized and fed into the trained K-means model to predict the cluster.
Challenges we ran into
Implementing a solution at such a scale involved overcoming challenges like data variability and model scalability. We struggled to find datasets with the required data on the food products for the initial stage of development. With Informatica’s robust data management capabilities, we managed to streamline data ingestion and integration, enhancing our model’s accuracy and performance.
Accomplishments that we're proud of
Developing an innovative solution: We successfully created a comprehensive platform that calculates and displays the Environmental Impact Score (EIS) for food products. This solution provides consumers with a clear, data-driven view of the environmental footprint of their choices.
Seamless data integration: Utilizing Informatica's IDMC — ModelServe, we integrated diverse data sources, including environmental databases and product information APIs, ensuring accurate and up-to-date scores for each product.
Machine learning implementation: We applied K-means clustering to categorize food products into low, medium, and high environmental impact clusters. Our model achieves precise, actionable insights that help drive eco-conscious decisions.
User-friendly interface: We developed a responsive frontend using HTML, CSS, and JavaScript, ensuring that the Environmental Impact Score is easy to access and understand, influencing consumer behavior in real-time.
Scalability and robustness: With the use of advanced data management tools, our platform is scalable and capable of handling large datasets while maintaining high accuracy and performance.
What we learned
The complexity of environmental data: We gained a deep understanding of how to work with environmental metrics such as greenhouse gas emissions, water use, and land use, and how they contribute to sustainability analysis.
Data normalization and clustering challenges: Through our journey with machine learning, we learned how crucial data preprocessing is, especially in normalizing data for clustering algorithms like K-means, and ensuring meaningful groupings of environmental impact scores.
Importance of user experience: It became clear that to drive eco-conscious consumer behavior, presenting the Environmental Impact Score in a simple, engaging manner is just as important as the accuracy of the data itself.
Cross-disciplinary collaboration: We learned the value of combining data engineering, machine learning, and web development expertise to create a solution that bridges the gap between technology and environmental sustainability.
Iterative development: As we faced various challenges such as limited datasets and scalability concerns, we learned the importance of flexibility and iterative improvement in project development.
What's next for Environmental Impact Score for Products
Expanding data sources: We plan to incorporate additional environmental data from more regions and product categories to enhance the accuracy and scope of the Environmental Impact Score.
Integration with major e-commerce platforms: Our goal is to collaborate with leading e-commerce platforms to integrate the EIS into product listings, making it easier for consumers to factor sustainability into their purchasing decisions.
Real-time updates: We aim to enhance our platform’s ability to provide real-time updates on environmental impacts, considering factors like changes in supply chains or new sustainability practices adopted by companies.
Personalized recommendations: We are looking to develop a feature that offers personalized, eco-friendly product suggestions based on a user's purchasing habits and environmental preferences.
Global expansion and regulations: In the long term, we hope to work alongside governments and regulatory bodies to establish EIS as a standard for evaluating product sustainability, promoting global accountability and transparency.
Built With
- clustering
- django
- k-means
- llm
- machine-learning
- openai
- python


Log in or sign up for Devpost to join the conversation.