-
-
Chrome Extension Overview
-
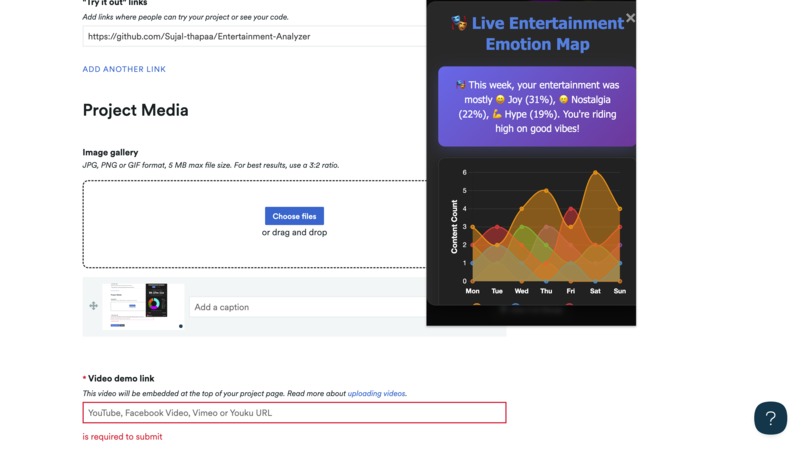
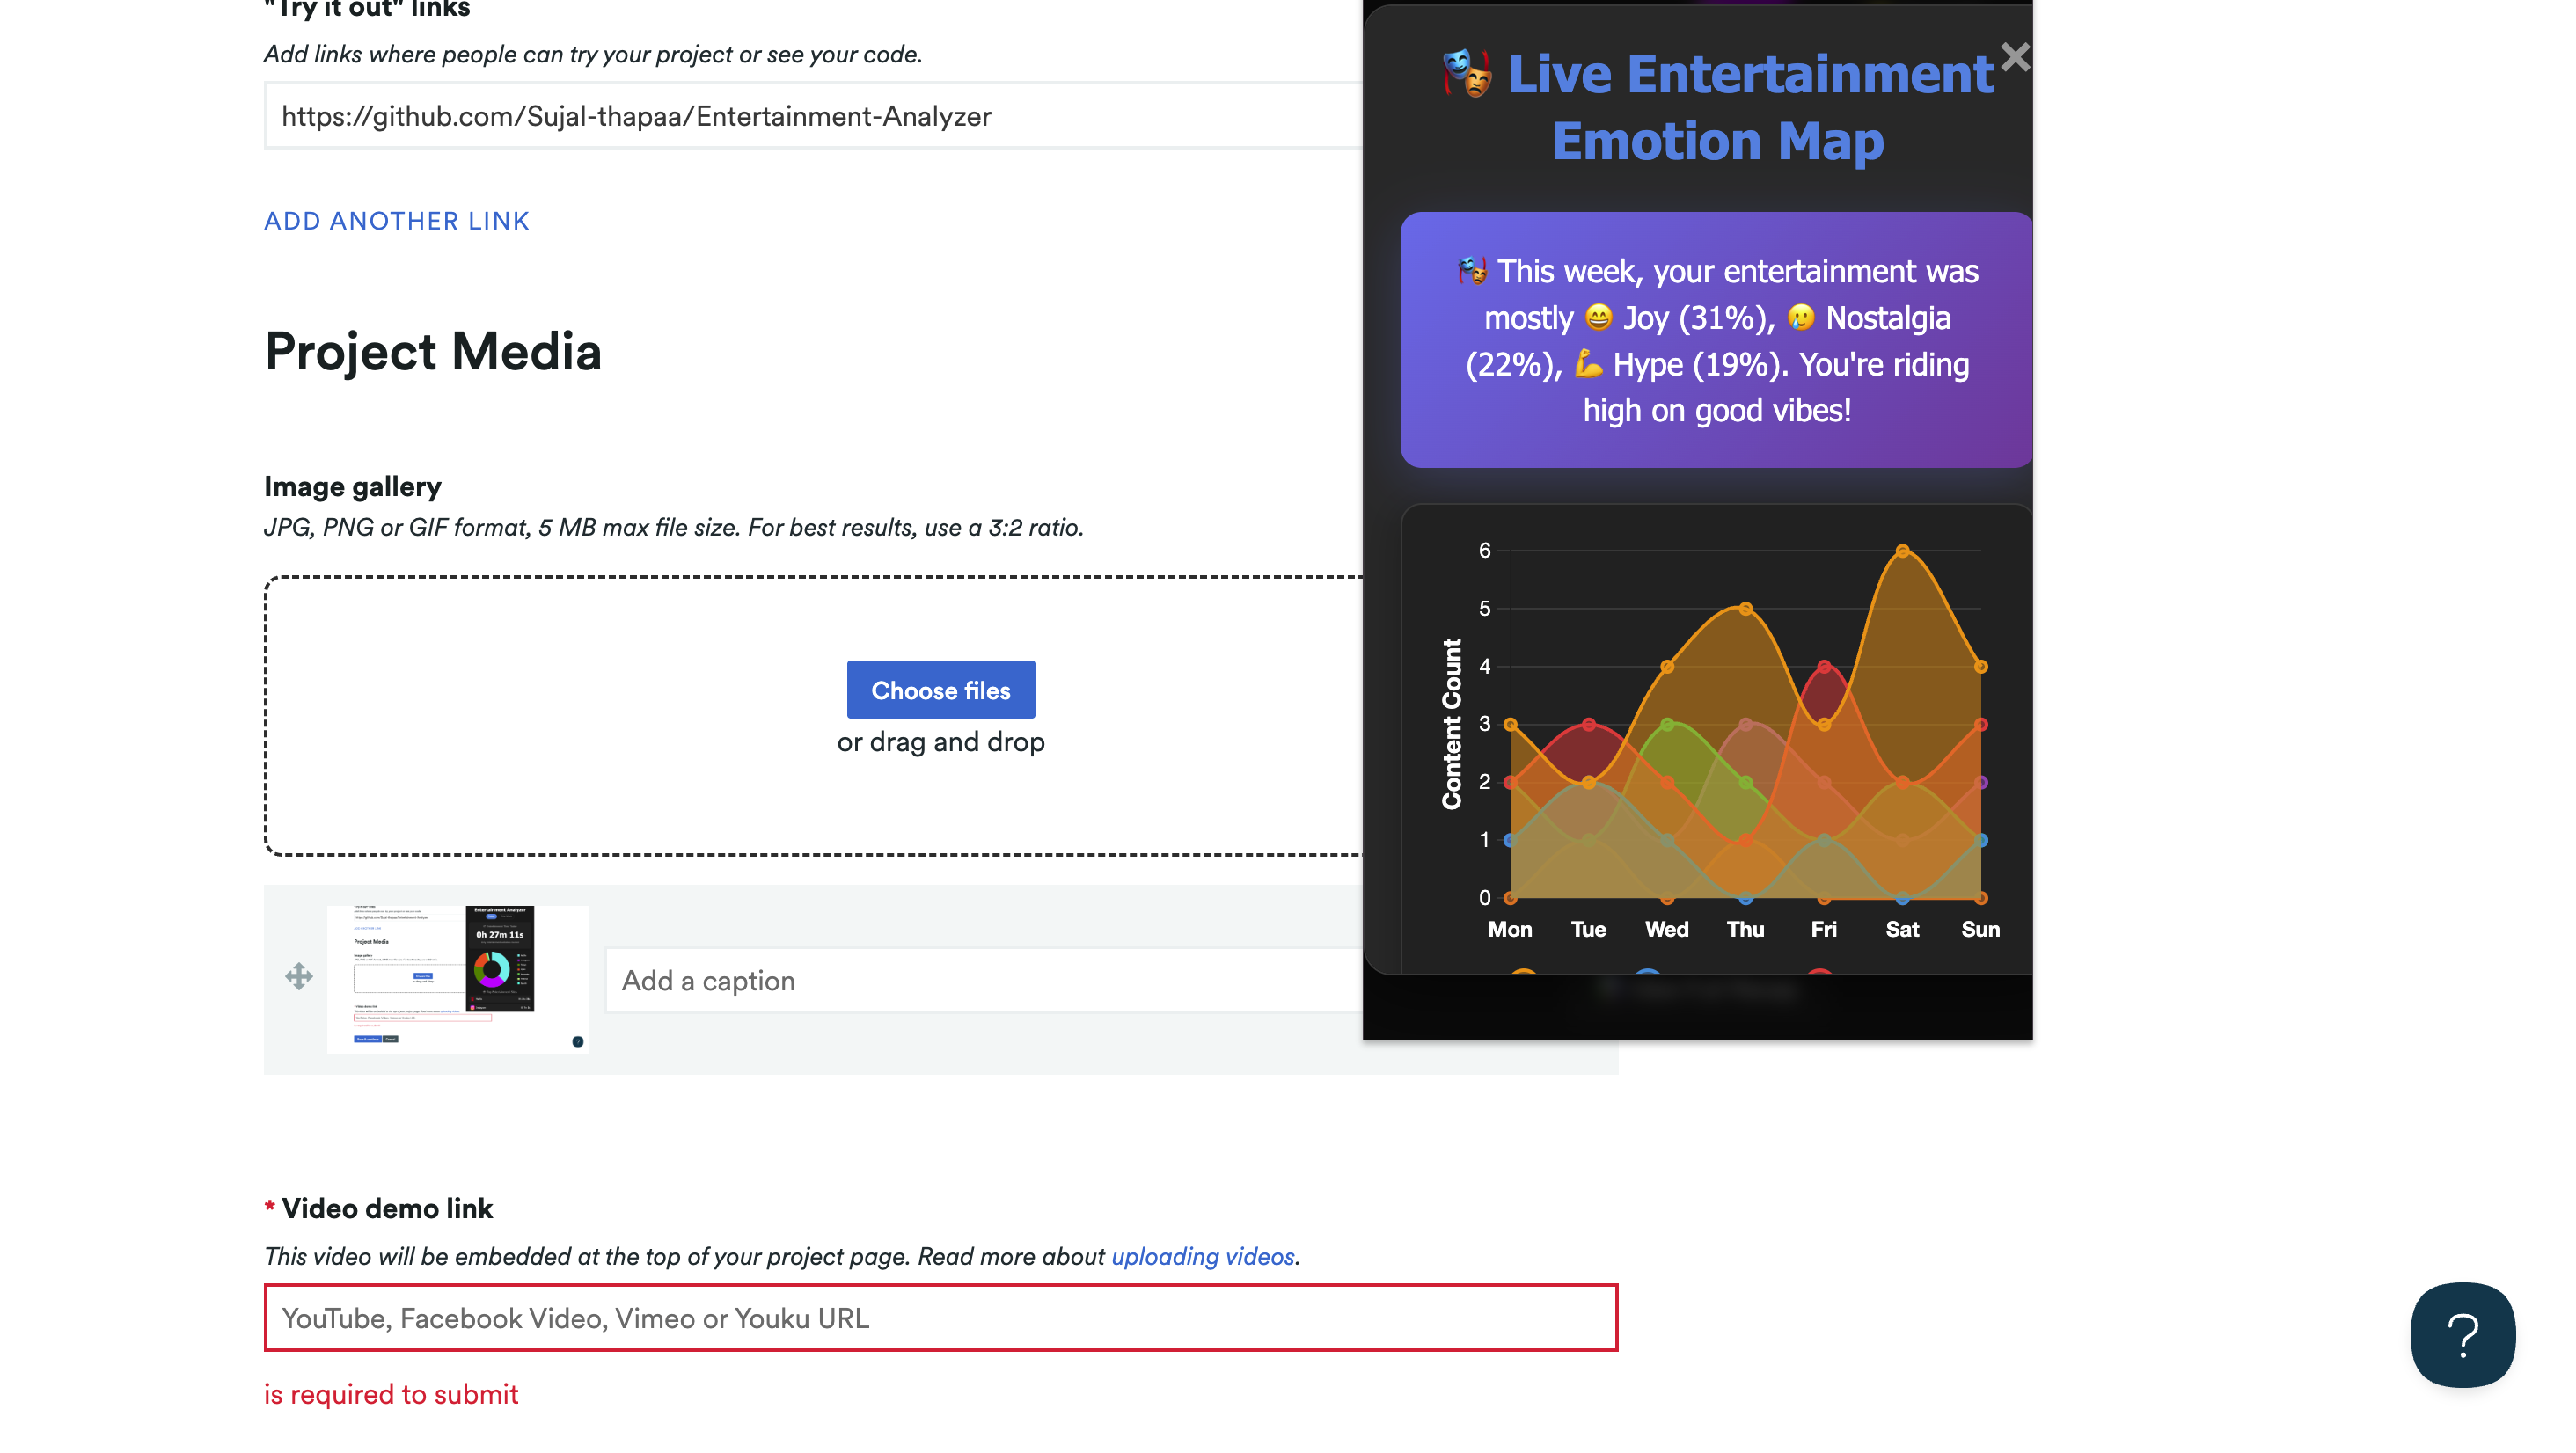
Live Entertainment Emotion Map (Chrome Extension)
-
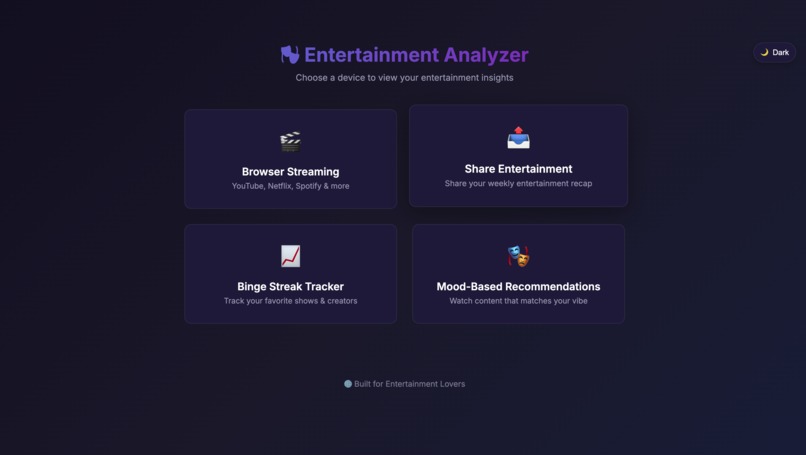
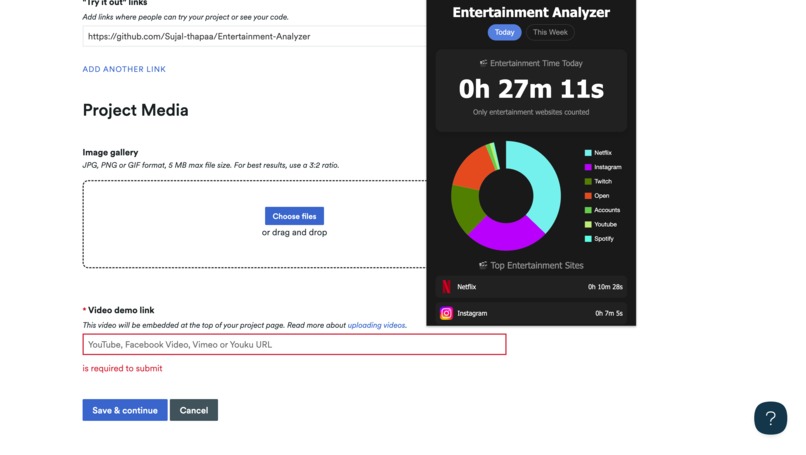
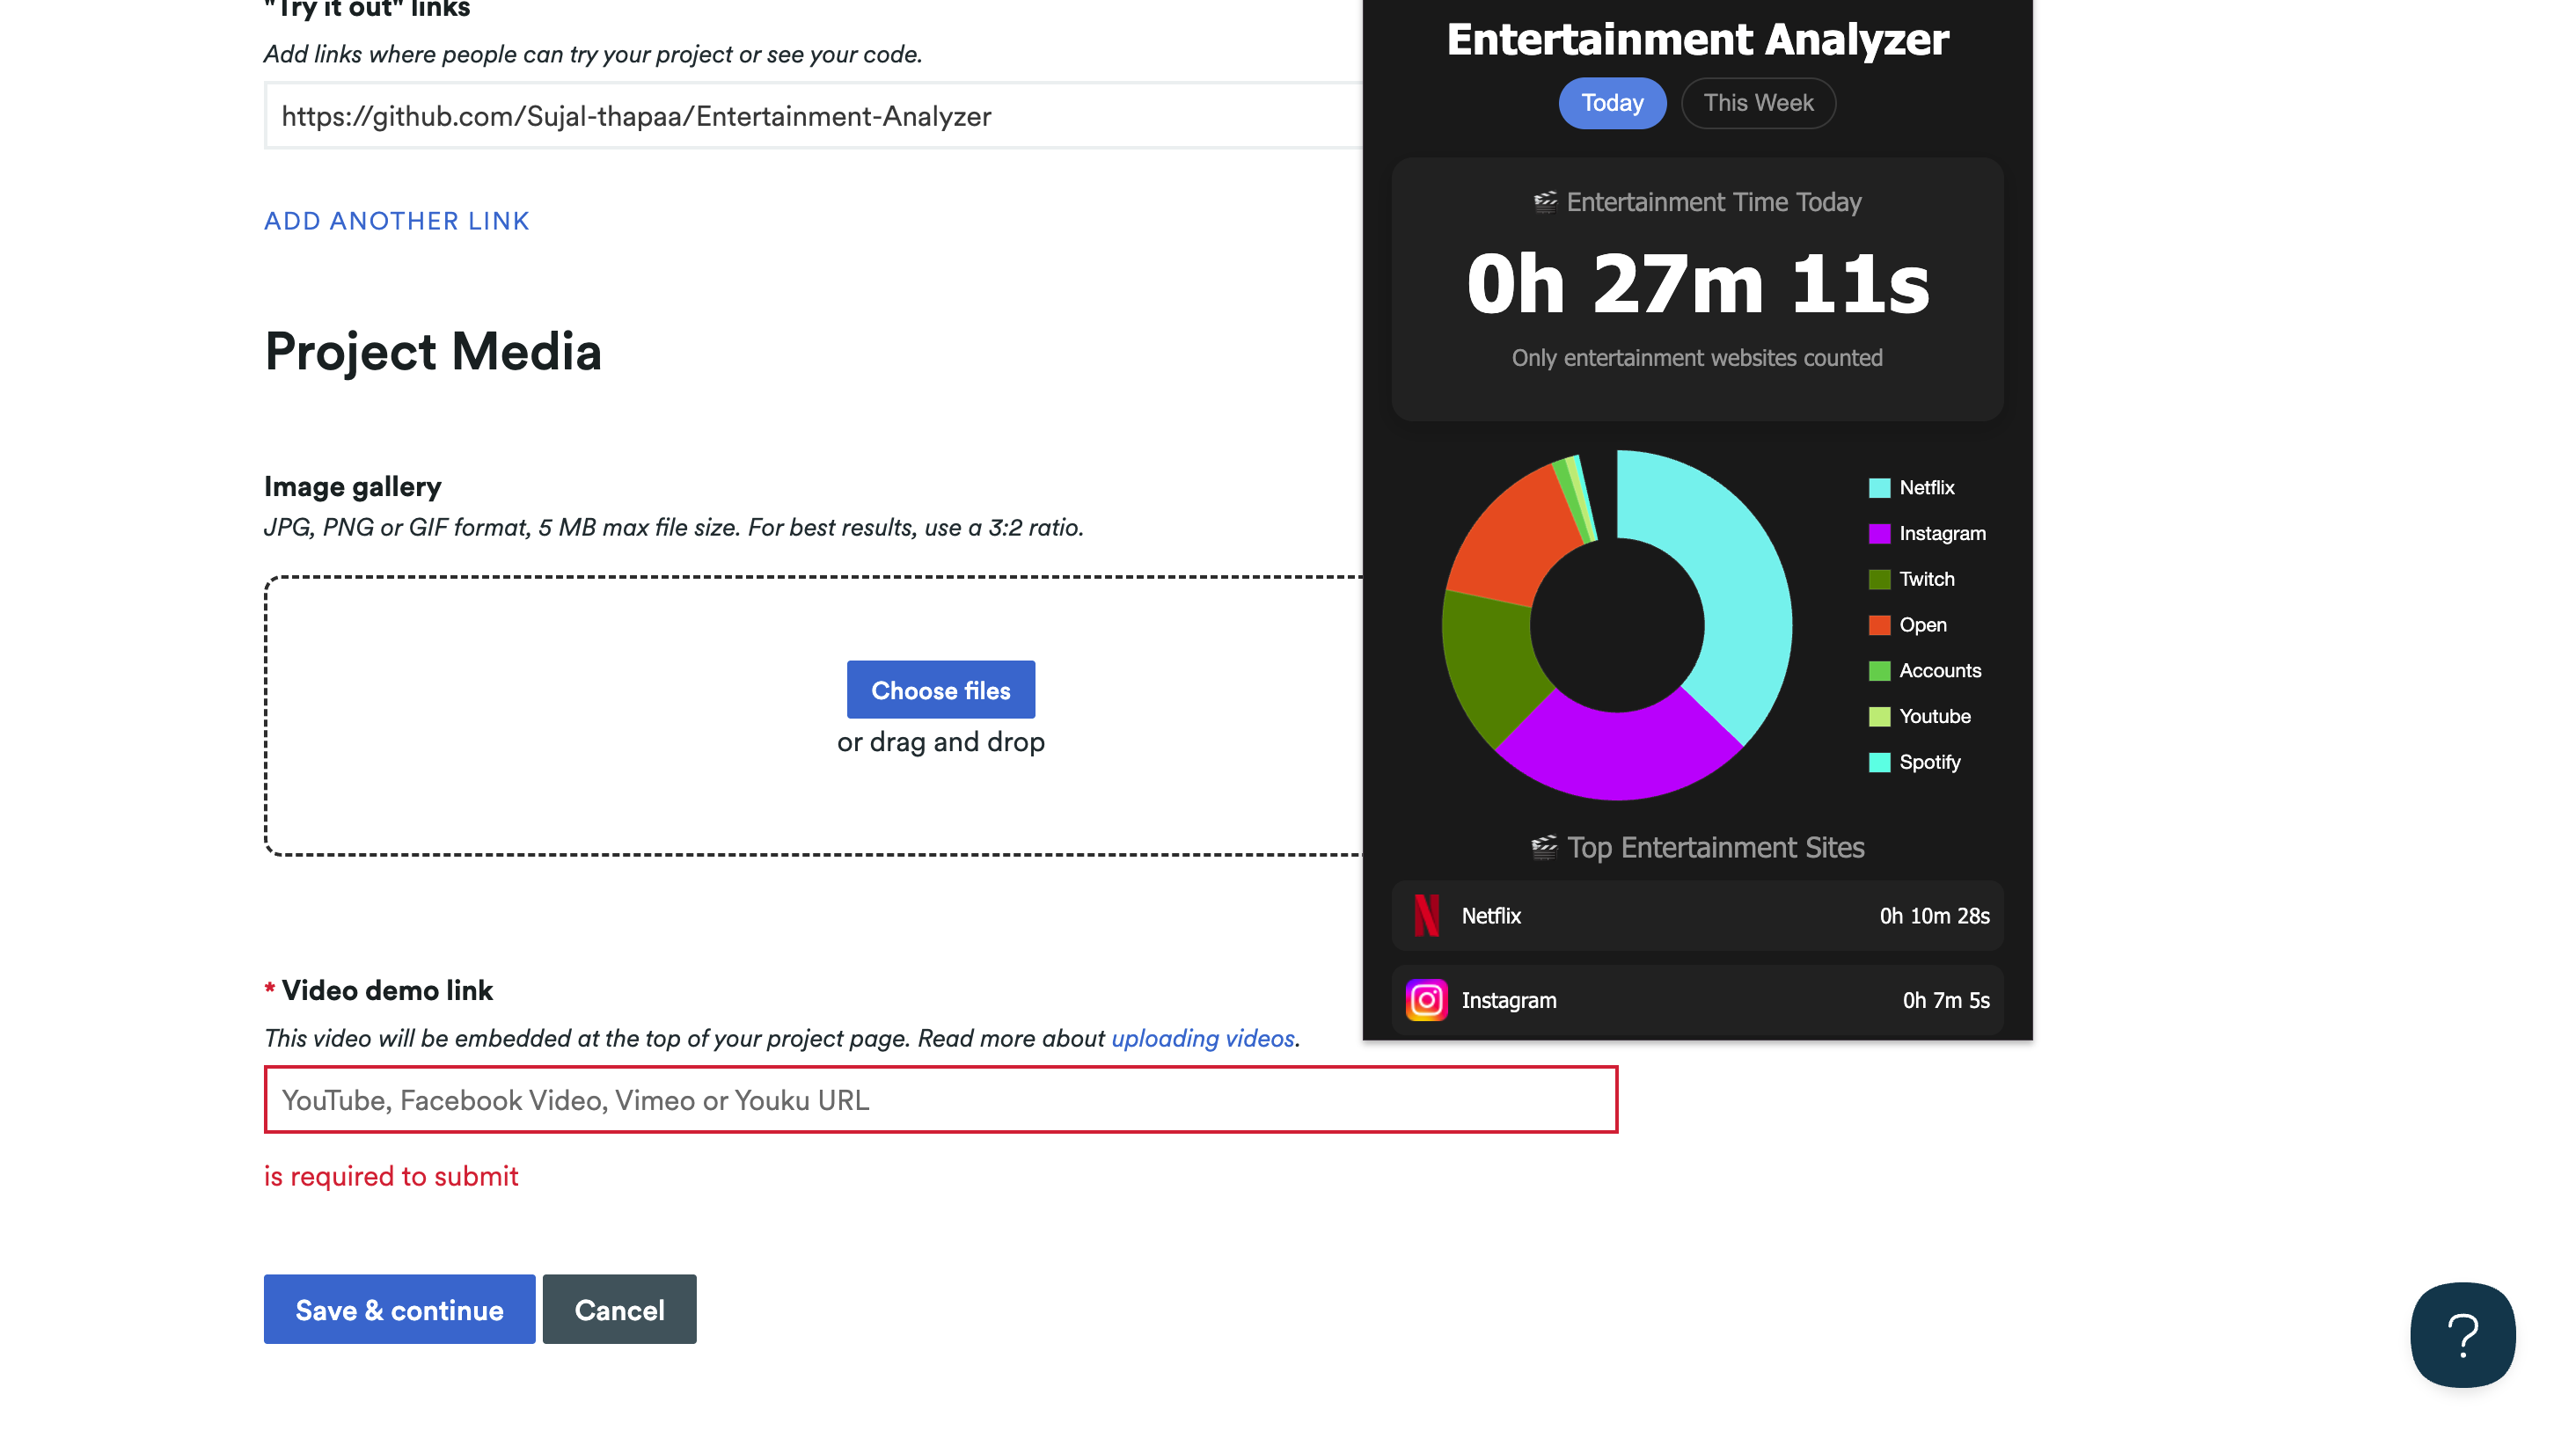
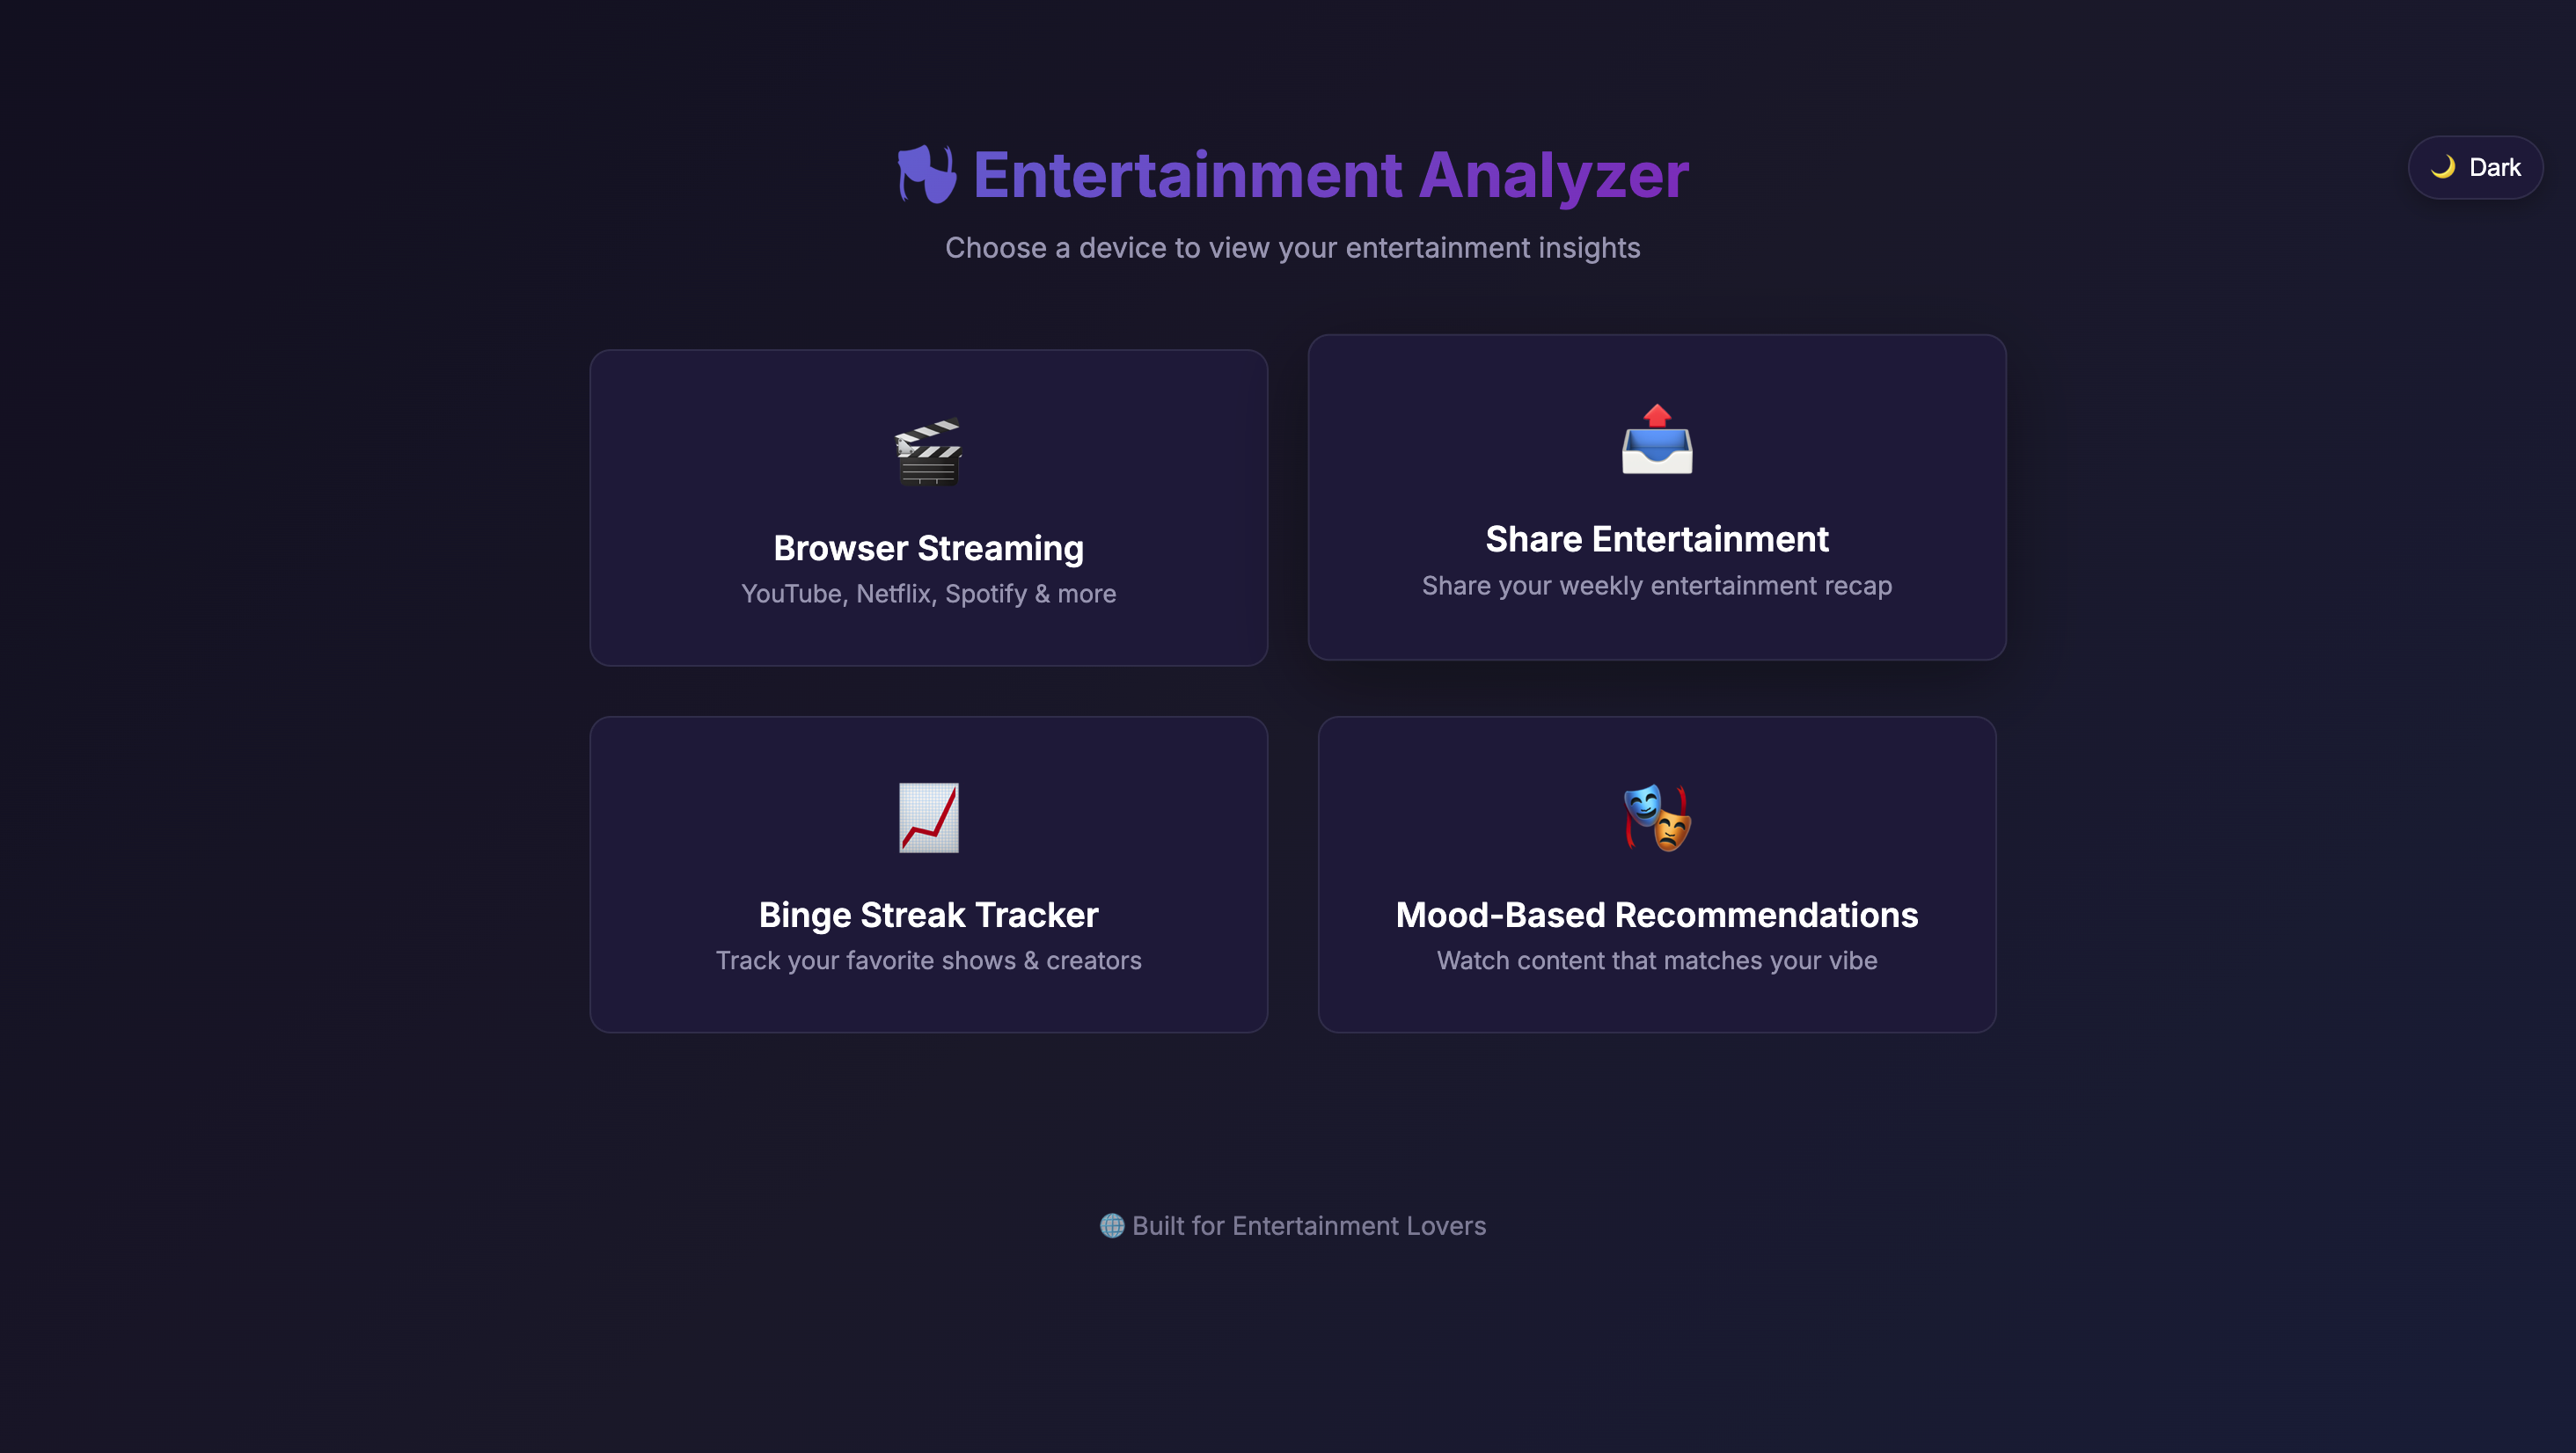
Entertainment Analyzer
-
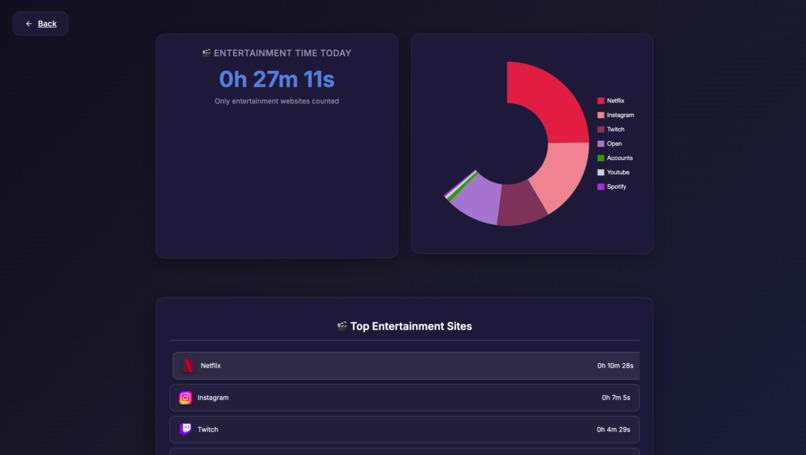
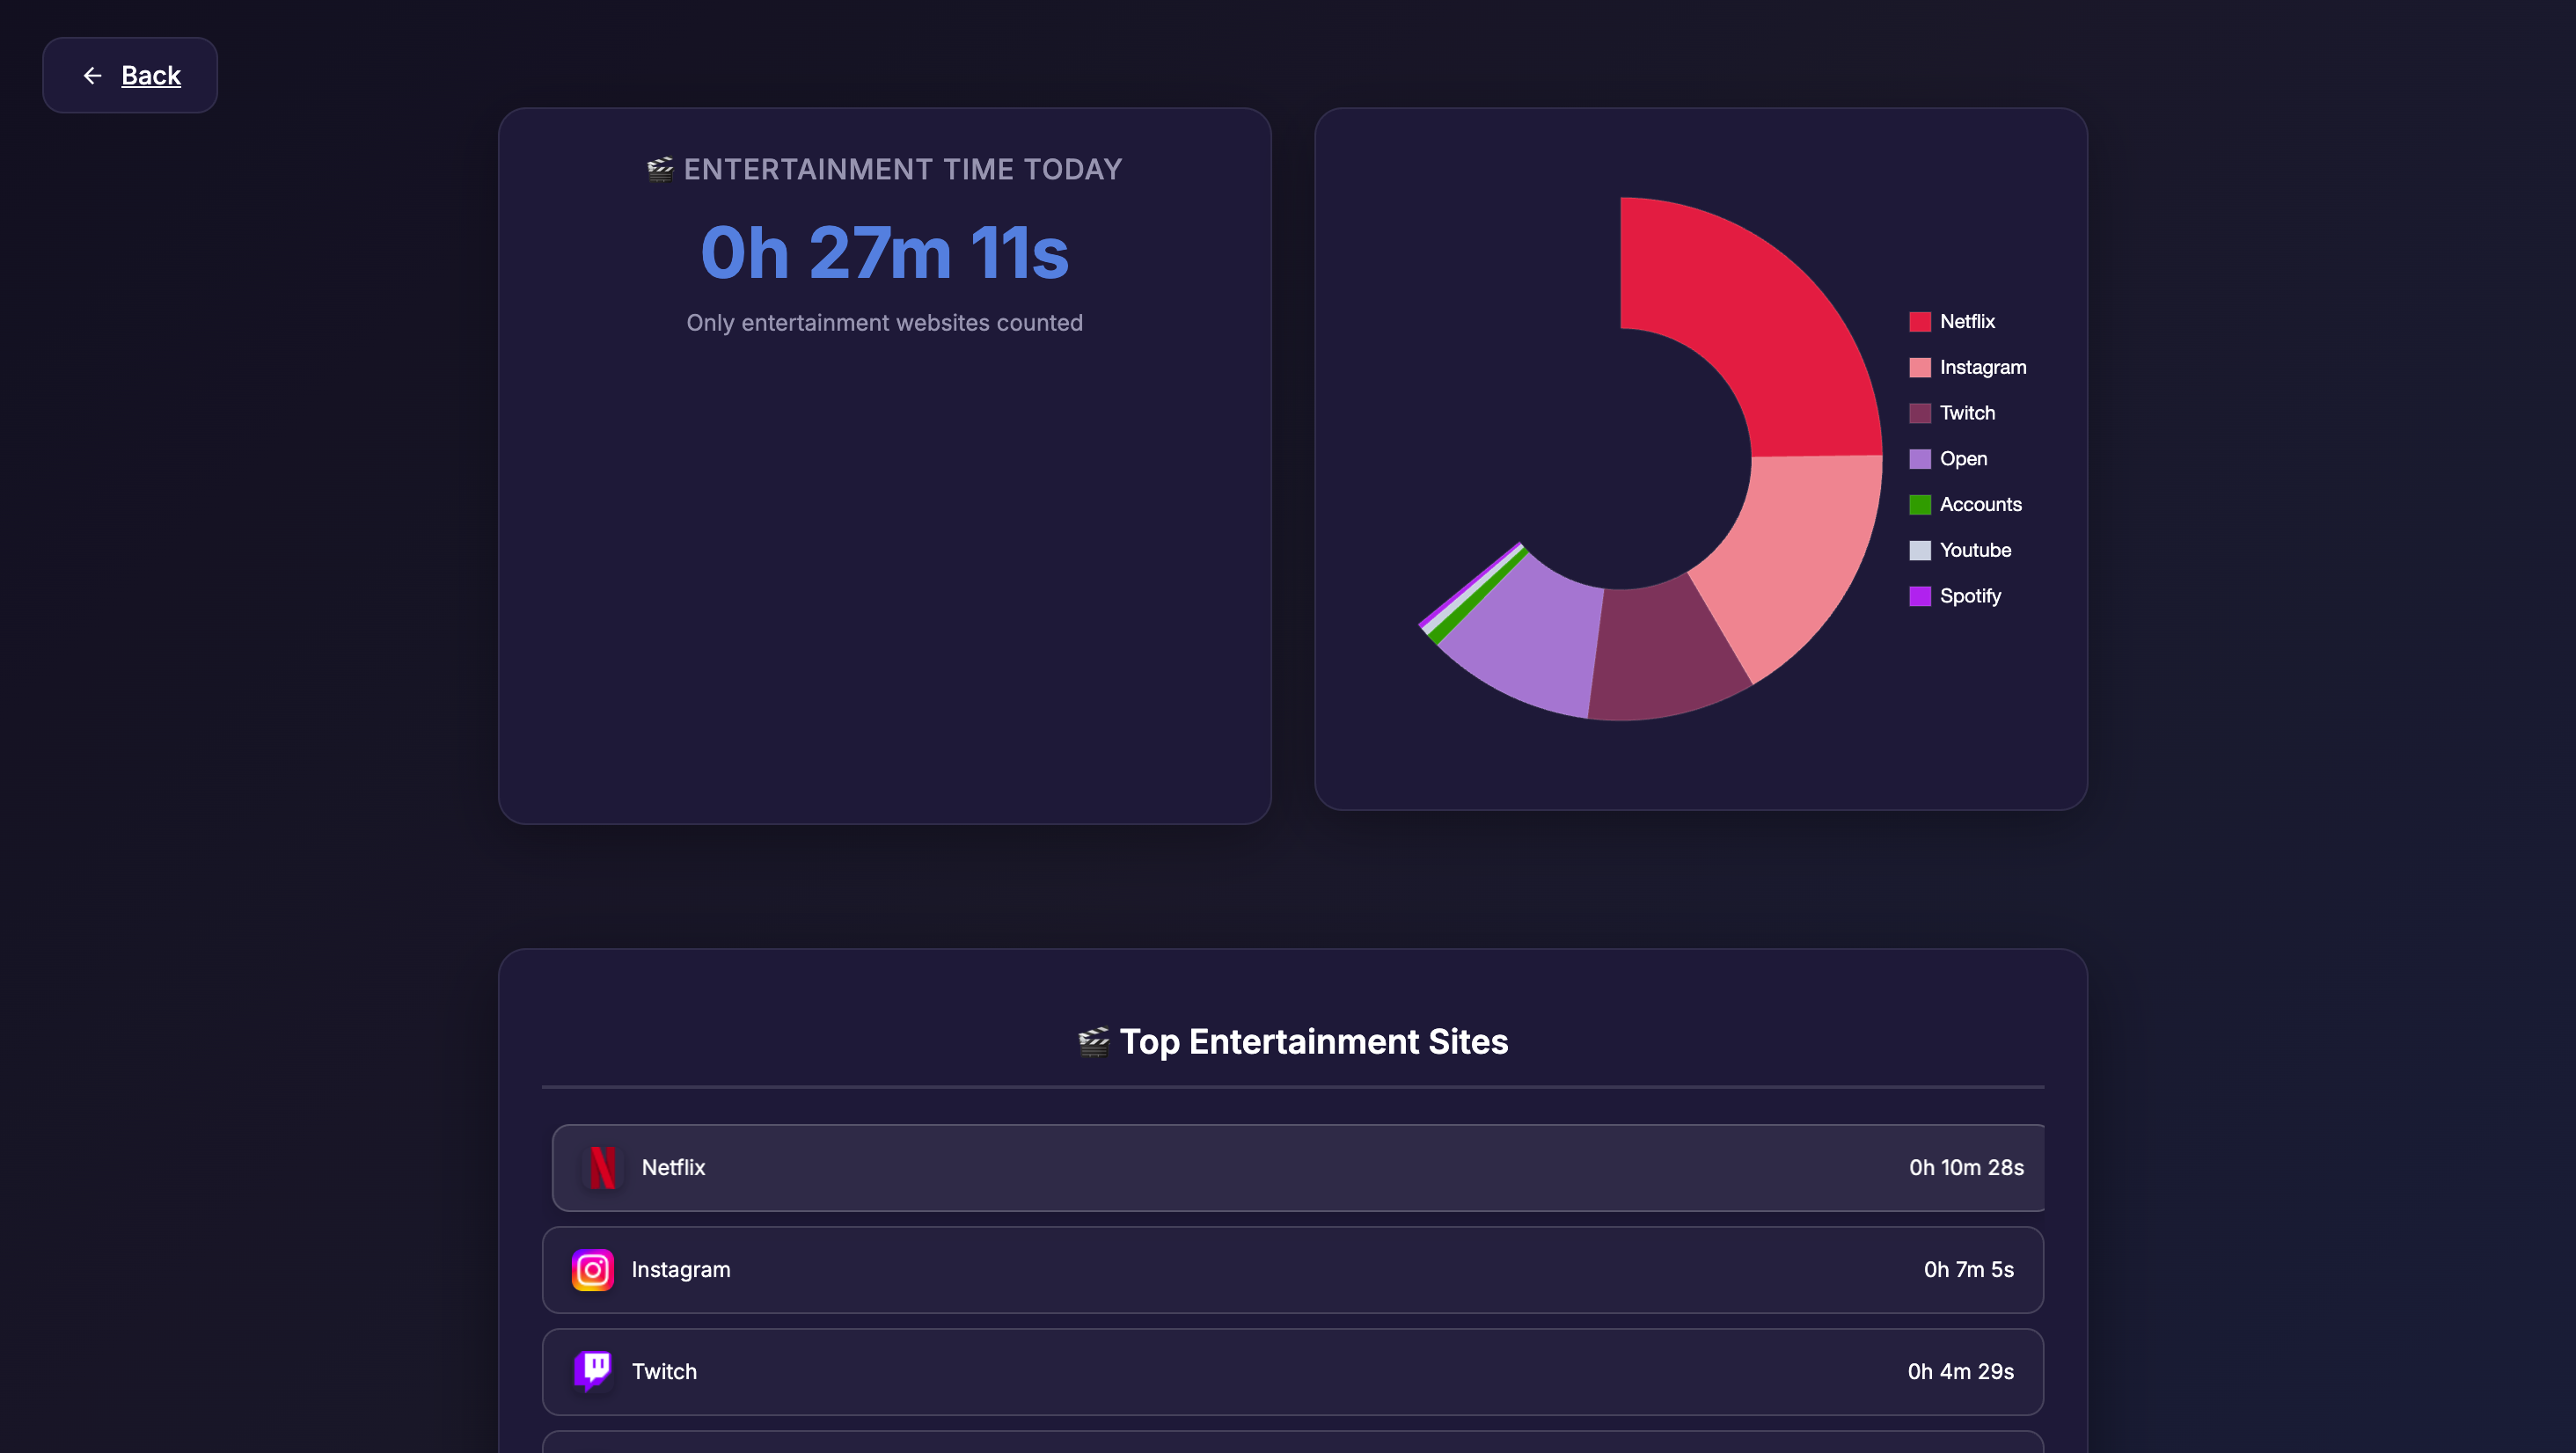
Entertainment Time Today
-
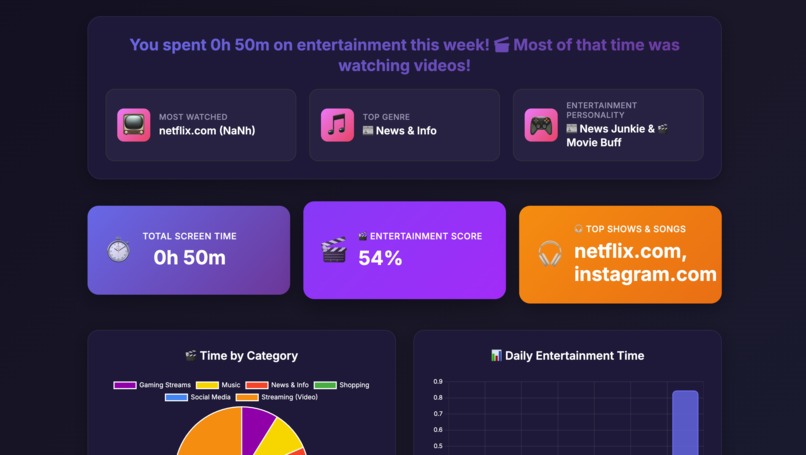
My Weekly Entertainment Recap
-
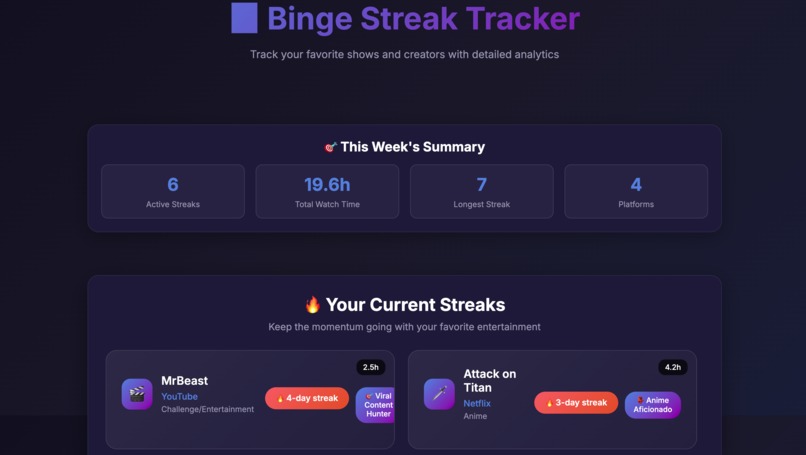
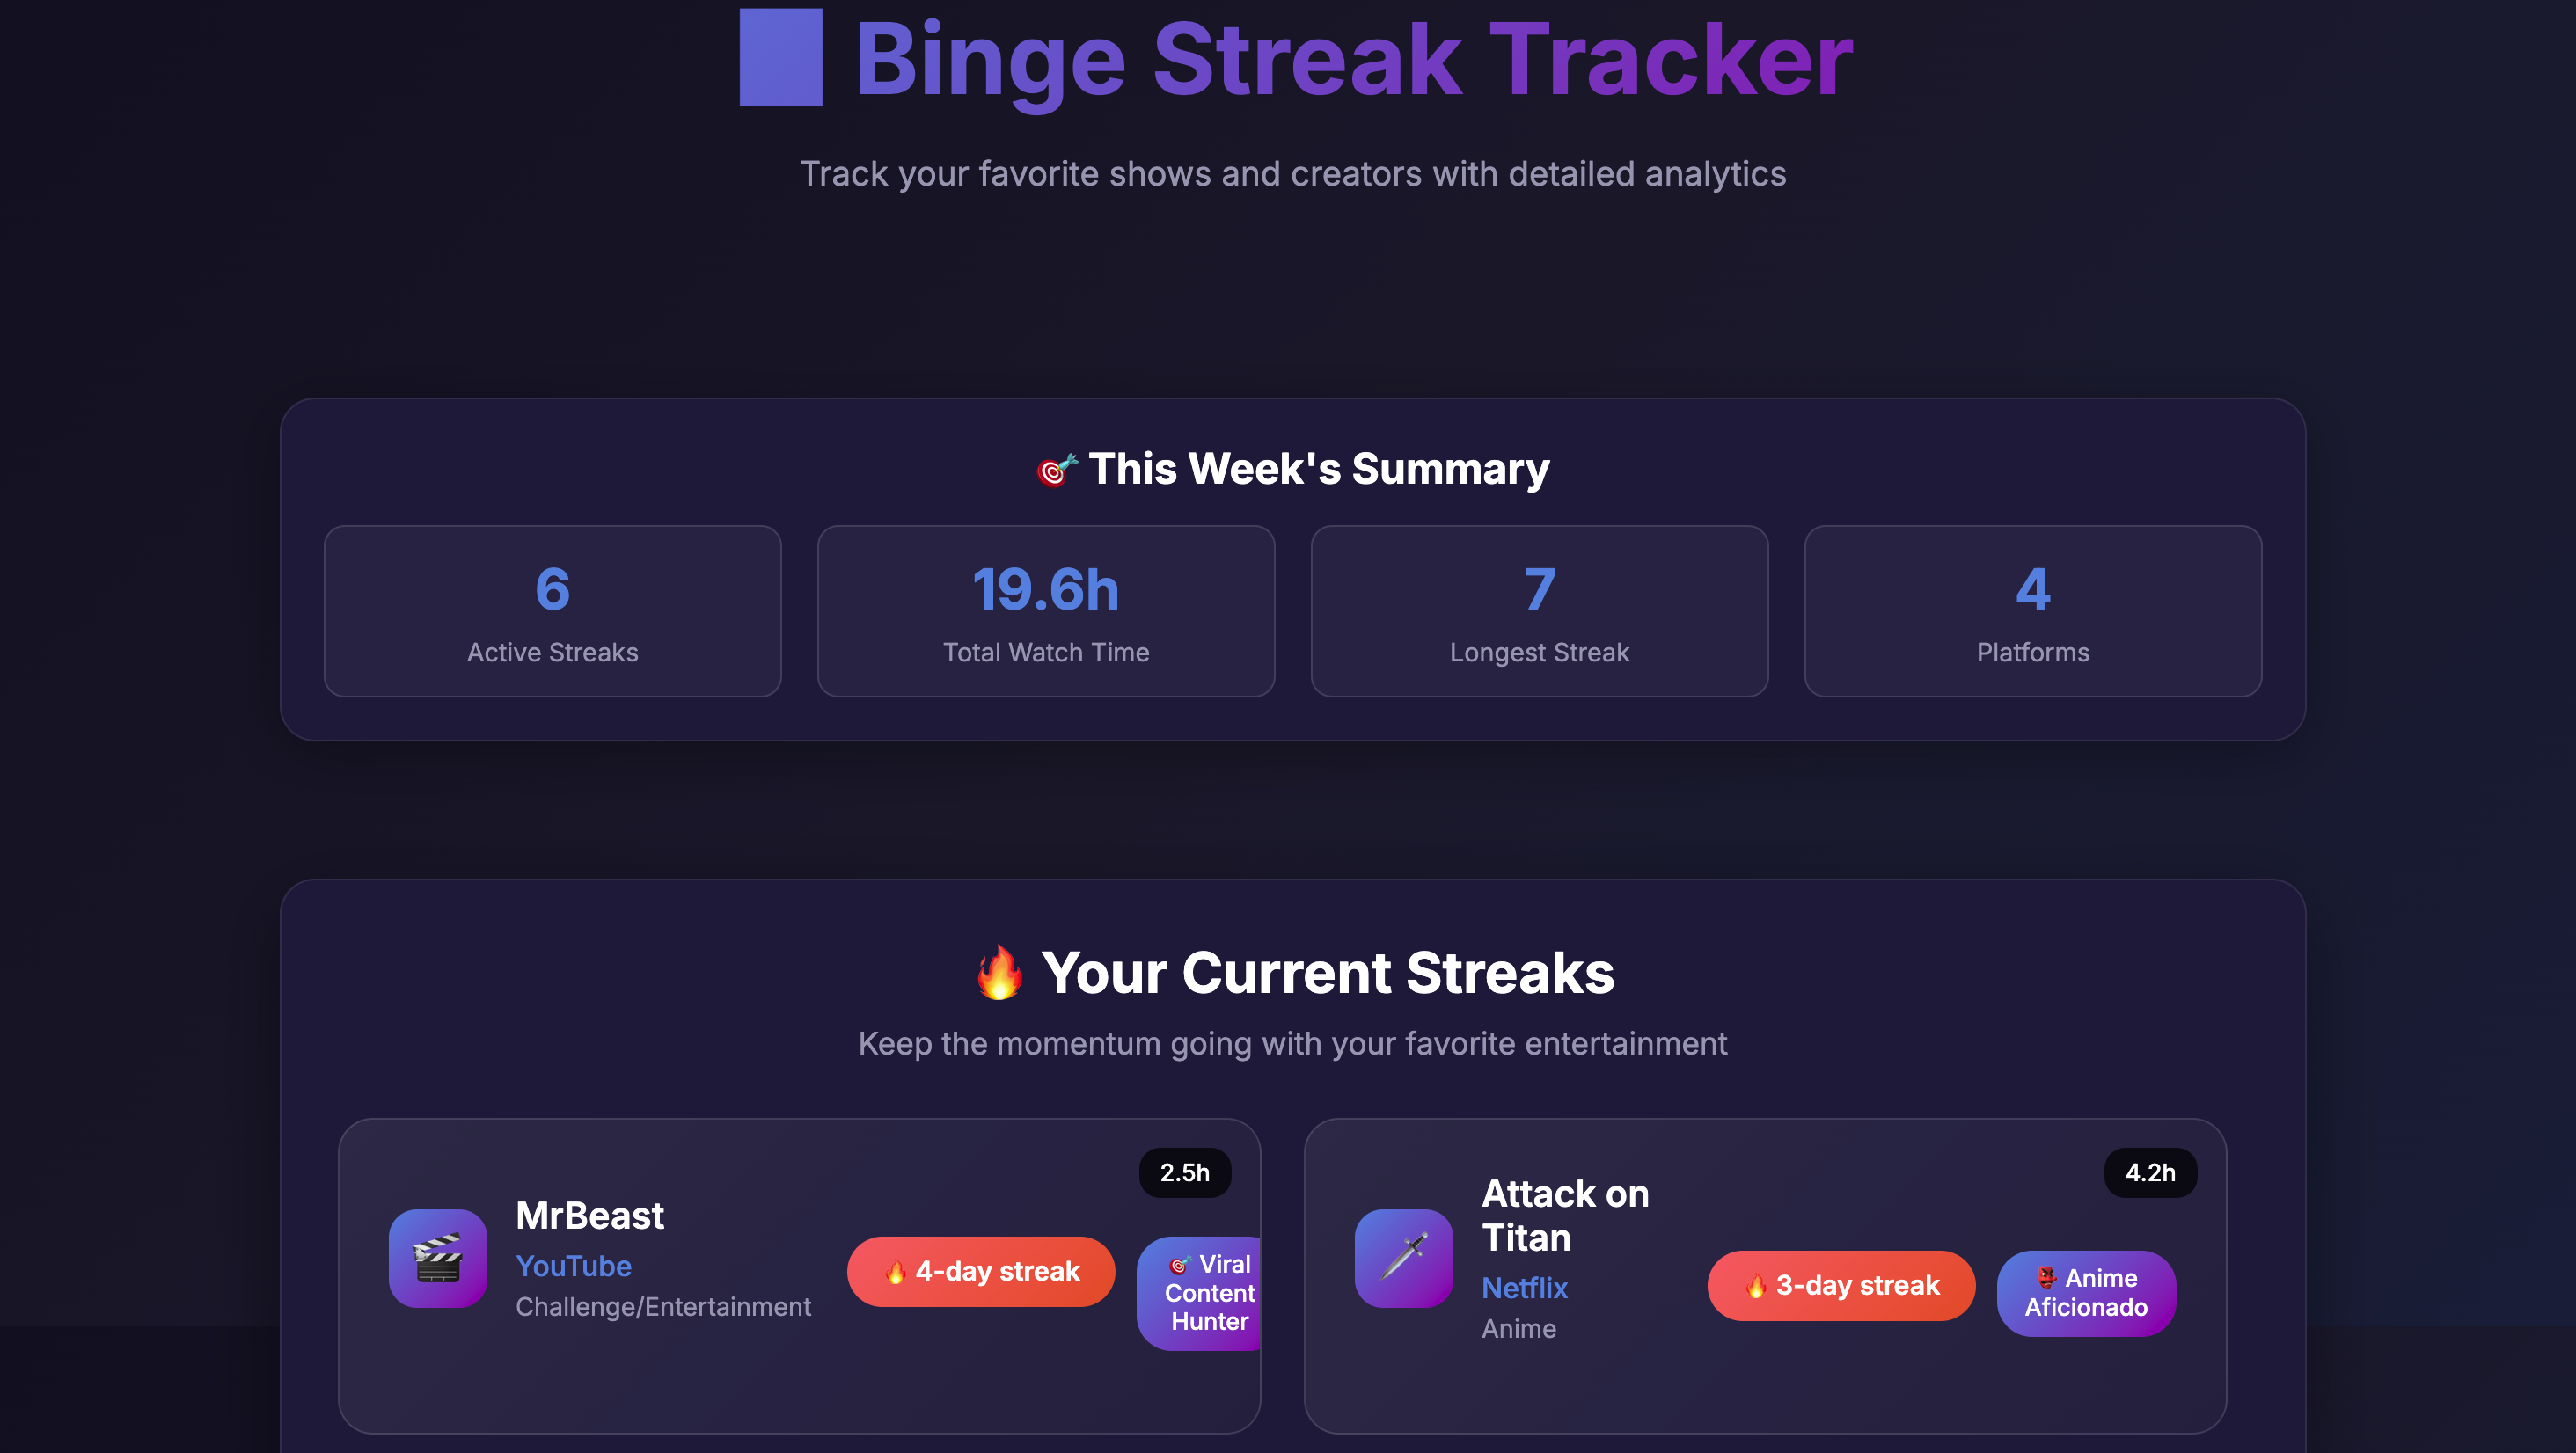
Binge Streak Tracker
-
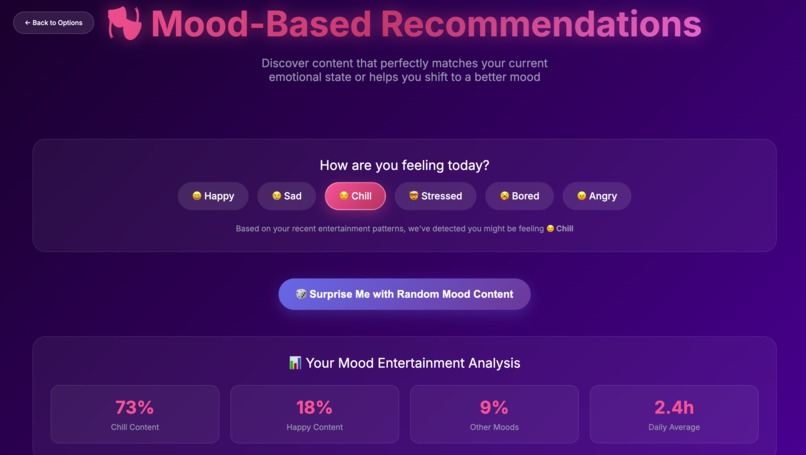
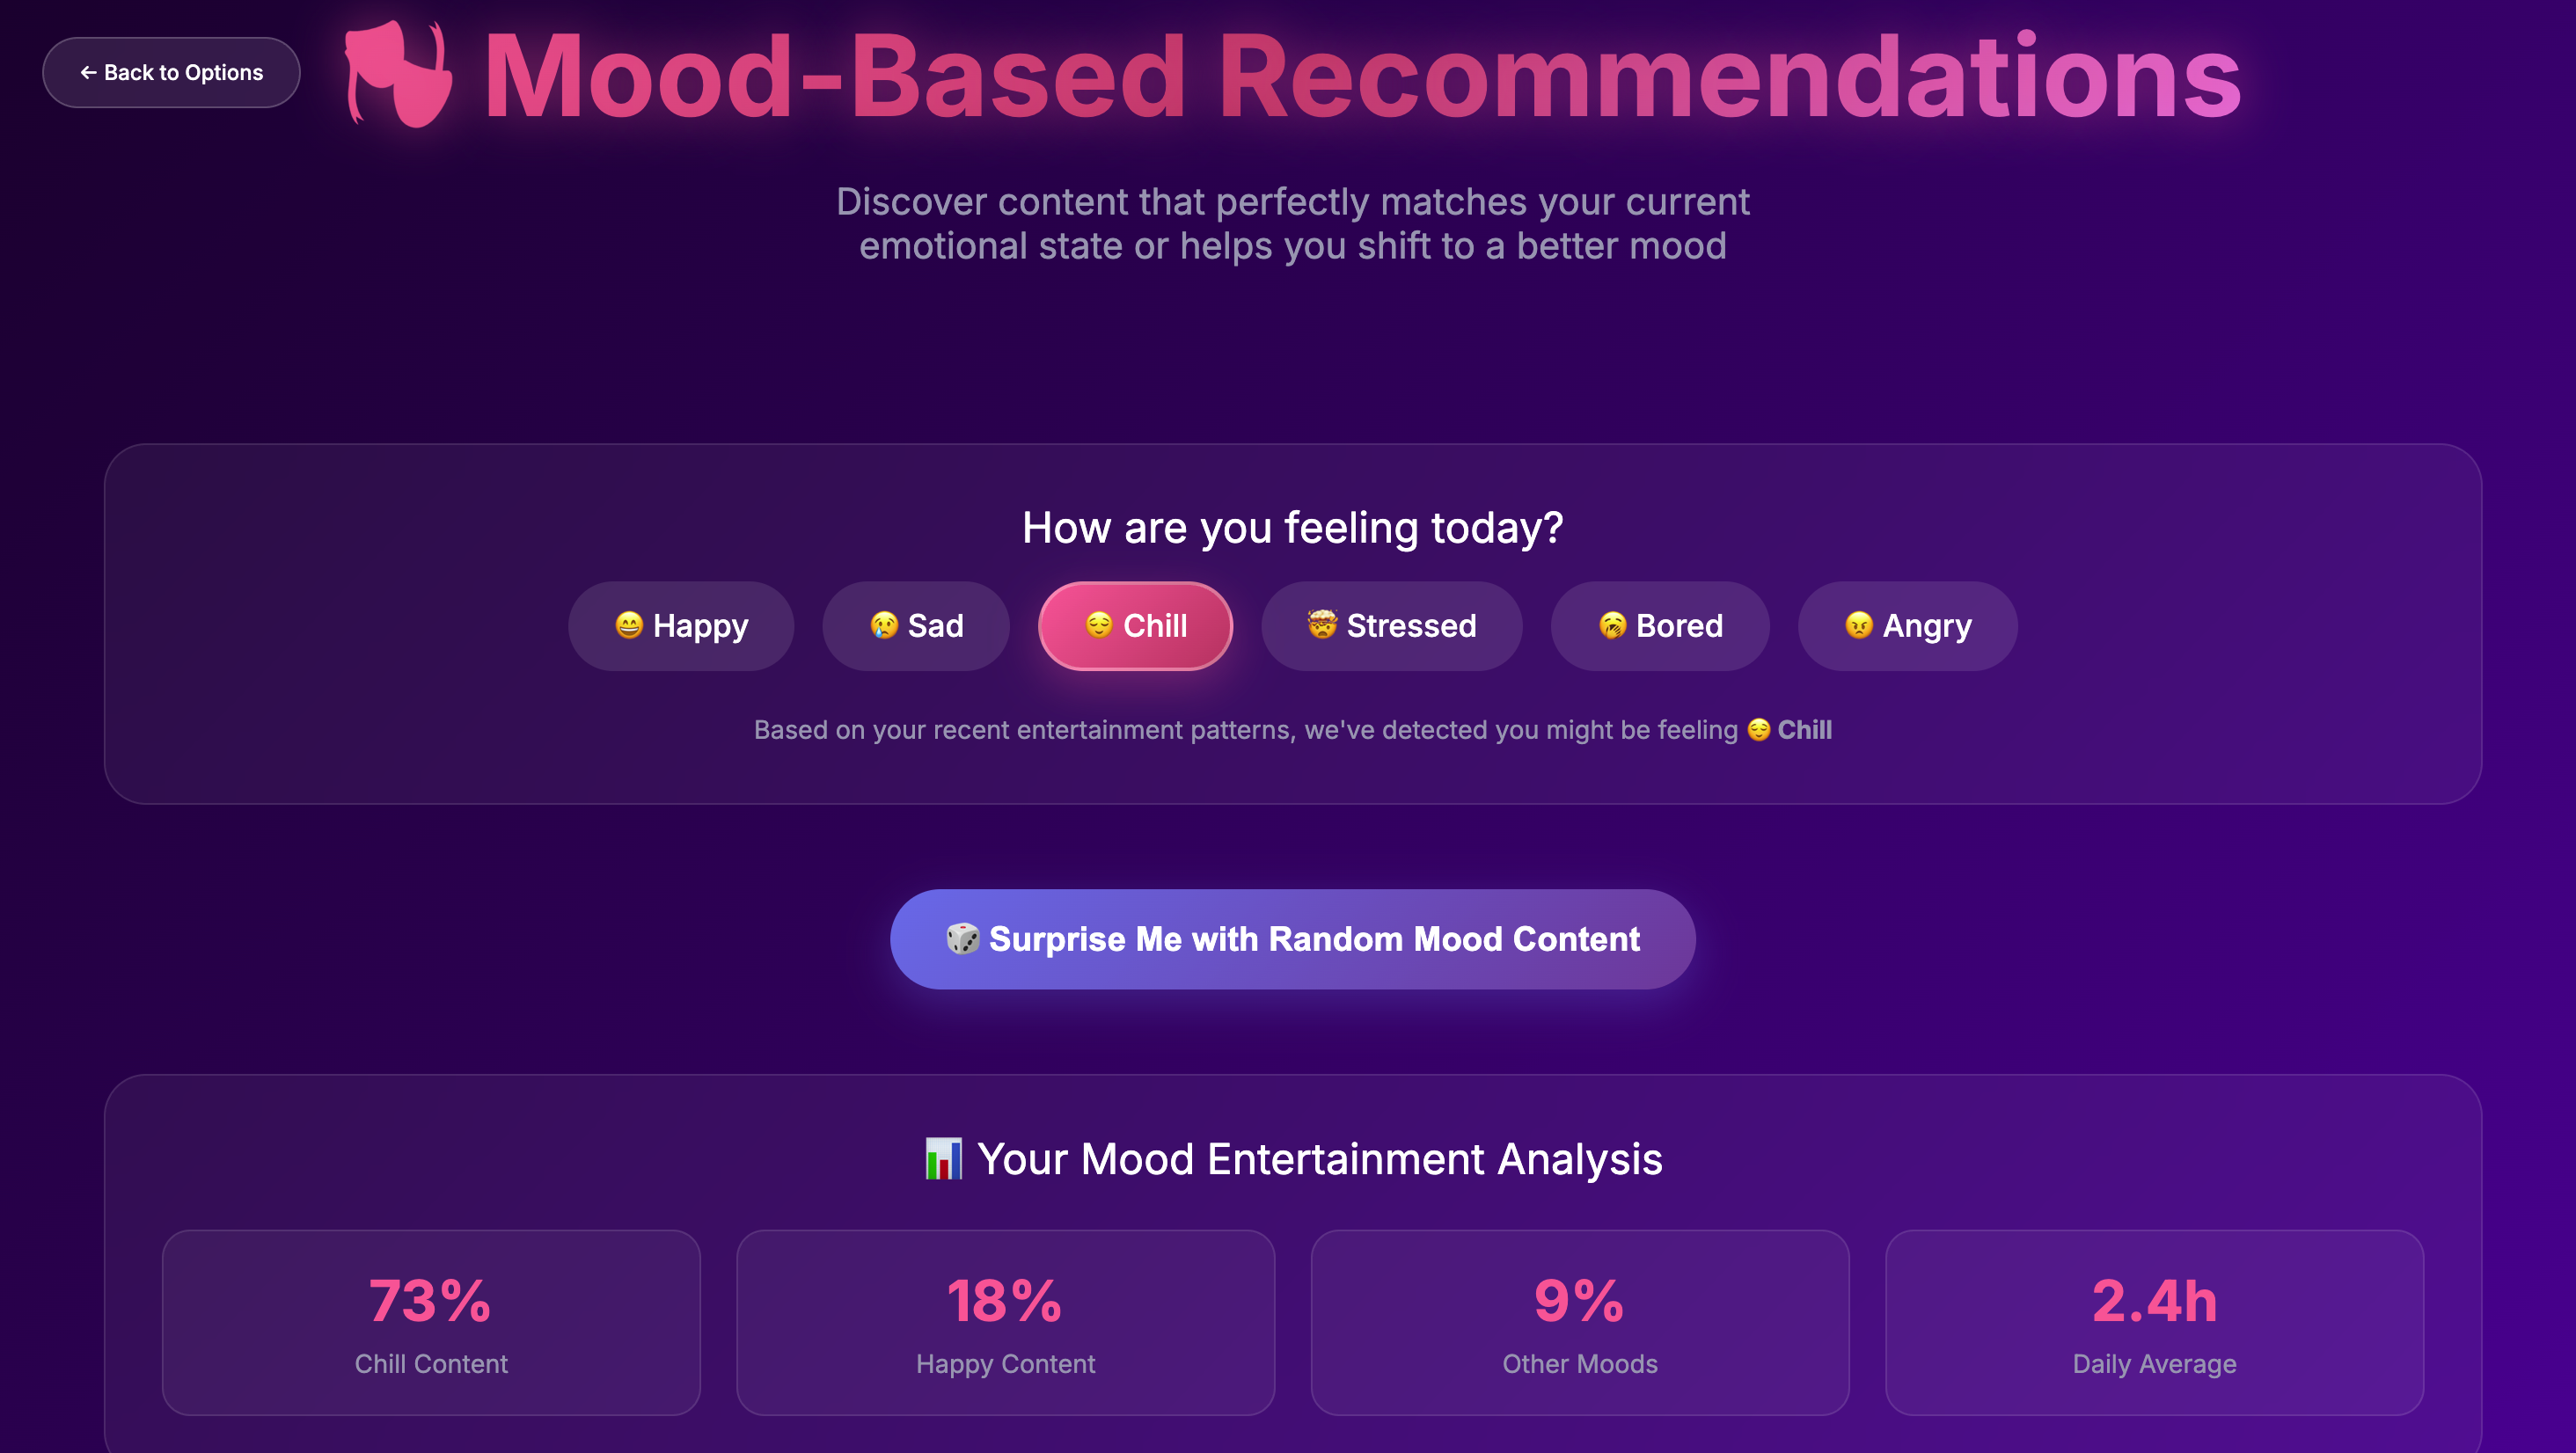
Mood-Based Recommendations

🧩⛱️ Entertainment Analyzer – Chrome Extension
🪄🔮 Inspiration
It started with a question we never really asked ourselves:
"What if we could understand ourselves better through the content we consume?"
Movies, music, memes, late-night Twitch streams — they're not just media. They reflect how we feel, what we love, and who we are becoming.
We wanted to build something fun, beautiful, and surprisingly deep:
A tool that lets you track your entertainment like a mirror to your digital soul.
🧬🛰️ What it does
Entertainment Analyzer is a Chrome extension that transforms passive browsing into an interactive emotional dashboard of your entertainment life:
- 🪞 Emotion Heatmaps — Discover what type of feelings your content triggers: ⚡️Hype, 🌫️Nostalgia, 🪷Calm, 🧊Sadness, 🔥Anger, or 💫Wonder.
- 🐙 Entertainment Personality — AI assigns you titles like “Midnight Lore Hunter” or “Bass Drop Nomad”
- 📻 Voice Memo Reviews — Weekly TTS-generated audio recaps of your entertainment habits
- 🛸 Live Mood Picks — Based on your mood ("Bored", "Stressed", etc.), get content like anime, indie games, or rare playlists
- 🗺️ Radar & Spiral Charts — Explore content patterns with fresh visual formats
- 🧃 Shareable Juice Cards — Bold visuals for sharing your entertainment personality
🛠️🧪 How we built it
We built this with a fusion of rapid iteration, caffeine, and joyful chaos:
- 🧩 Chrome Extension (Manifest V3)
- 🔁 Modular Vanilla JS +
Chart.js+html2canvas - 🧠 OpenRouter GPT-3.5 Turbo → For genre & emotional classification
- 🎙️ ElevenLabs API → For AI voiceovers
- 🌙 Fully Local Data → With Chrome Storage API
- 🛸 Dashboard UI → Custom-coded, responsive, dark-mode native
We leaned heavily into UI experimentation and prompt refinement for a product that feels fluid and unexpectedly alive.
🛤️🐛 Challenges we ran into
- 🧩 Emotional Tagging Logic — Fine-tuning content-emotion associations wasn’t easy
- 🗺️ Chart Diversity — Getting radar and spiral visualizations to feel natural and not cluttered
- 🧊 Voice Review Fallbacks — When ElevenLabs API breaks, Web Speech can feel robotic
- 🛑 Demo Data That Felt Real — Creating fake data that felt real enough to demo live
🧠🥇 Accomplishments we're proud of
- 🌀 Built an AI that assigns entertainment personalities
- 🧷 Created a full voice-over AI weekly narrator
- 🌿 Designed the first-ever emotional map of your entertainment behavior
- 🕸️ Added mood-based recommendations that feel personal and useful
- 💿 Made analytics actually... aesthetically fun?
🪴📚 What we learned
- UI is storytelling — data becomes delightful when wrapped in personality
- Emojis are UX — the right visual glyph tells more than words
- People don’t just want stats. They want connection, reflection, and curation
🚦🚀 What's next?
We want to take this even further:
- 📱 Companion App — For quick mobile check-ins
- 🧮 Cross-device emotion sync — Map entertainment across phone + PC
- 🛡️ Time-health insights — Not just what you watch, but how it affects you
- 🧭 Global Trends Explorer — Discover collective content shifts from users like you
- 🐾 Your Mood Footprint — A timeline of how content shaped your emotions over months
This isn't just tracking. It’s an emotional diary of your digital joy.
Built With
- api
- css
- elavenlab
- html
- javascript
- supabase

Log in or sign up for Devpost to join the conversation.