-
-
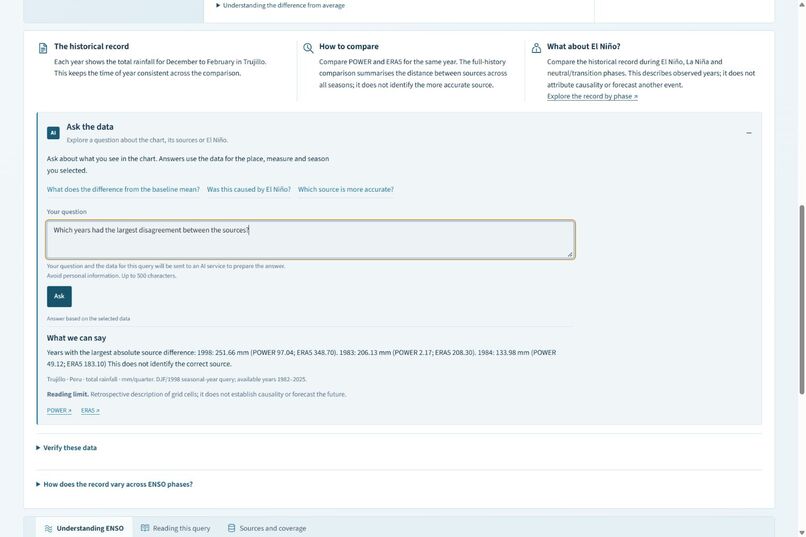
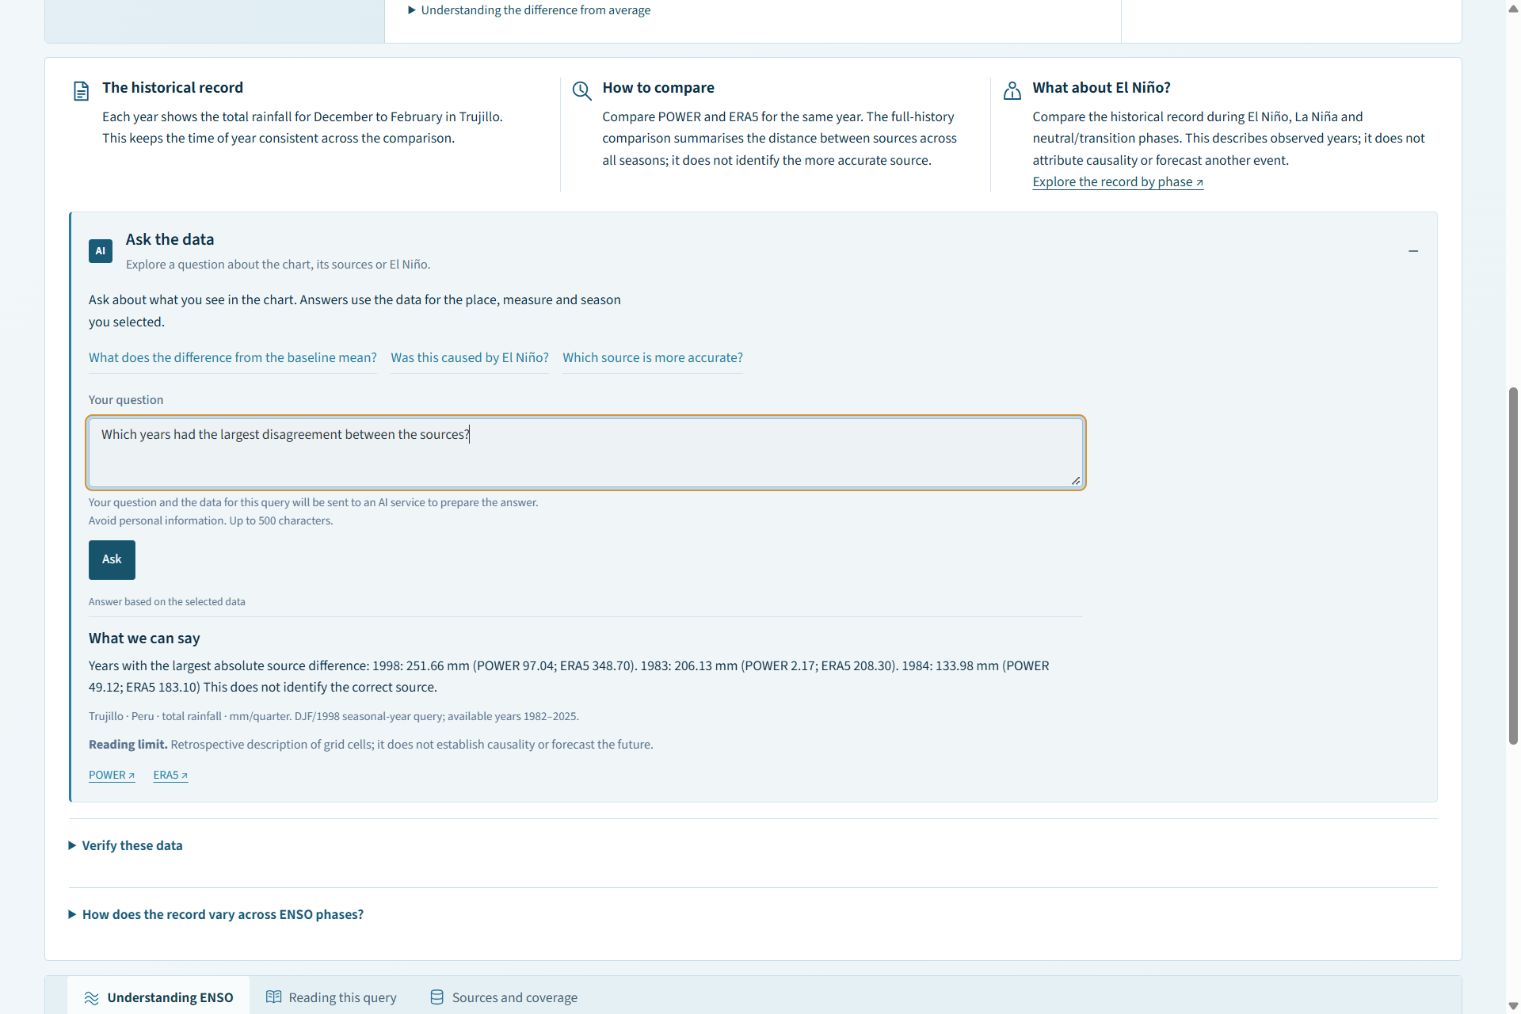
1. Ask about the selected data. The AI interprets your question; the application calculates the numerical answers.
-
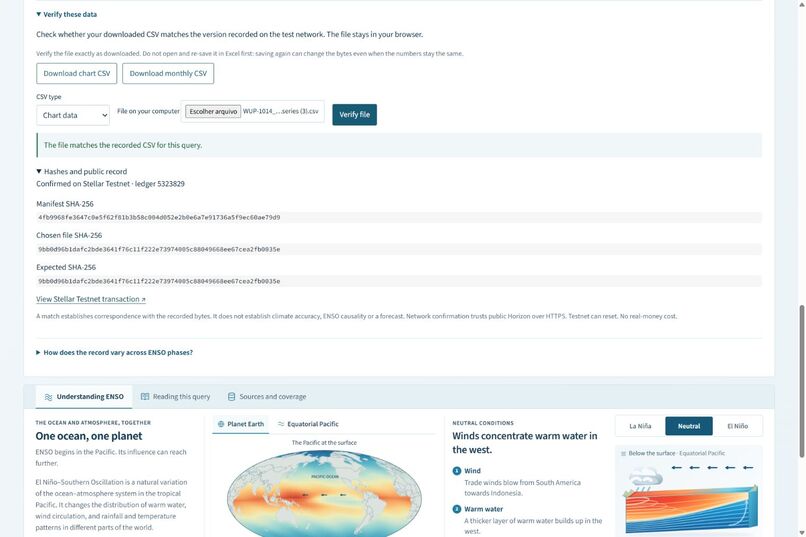
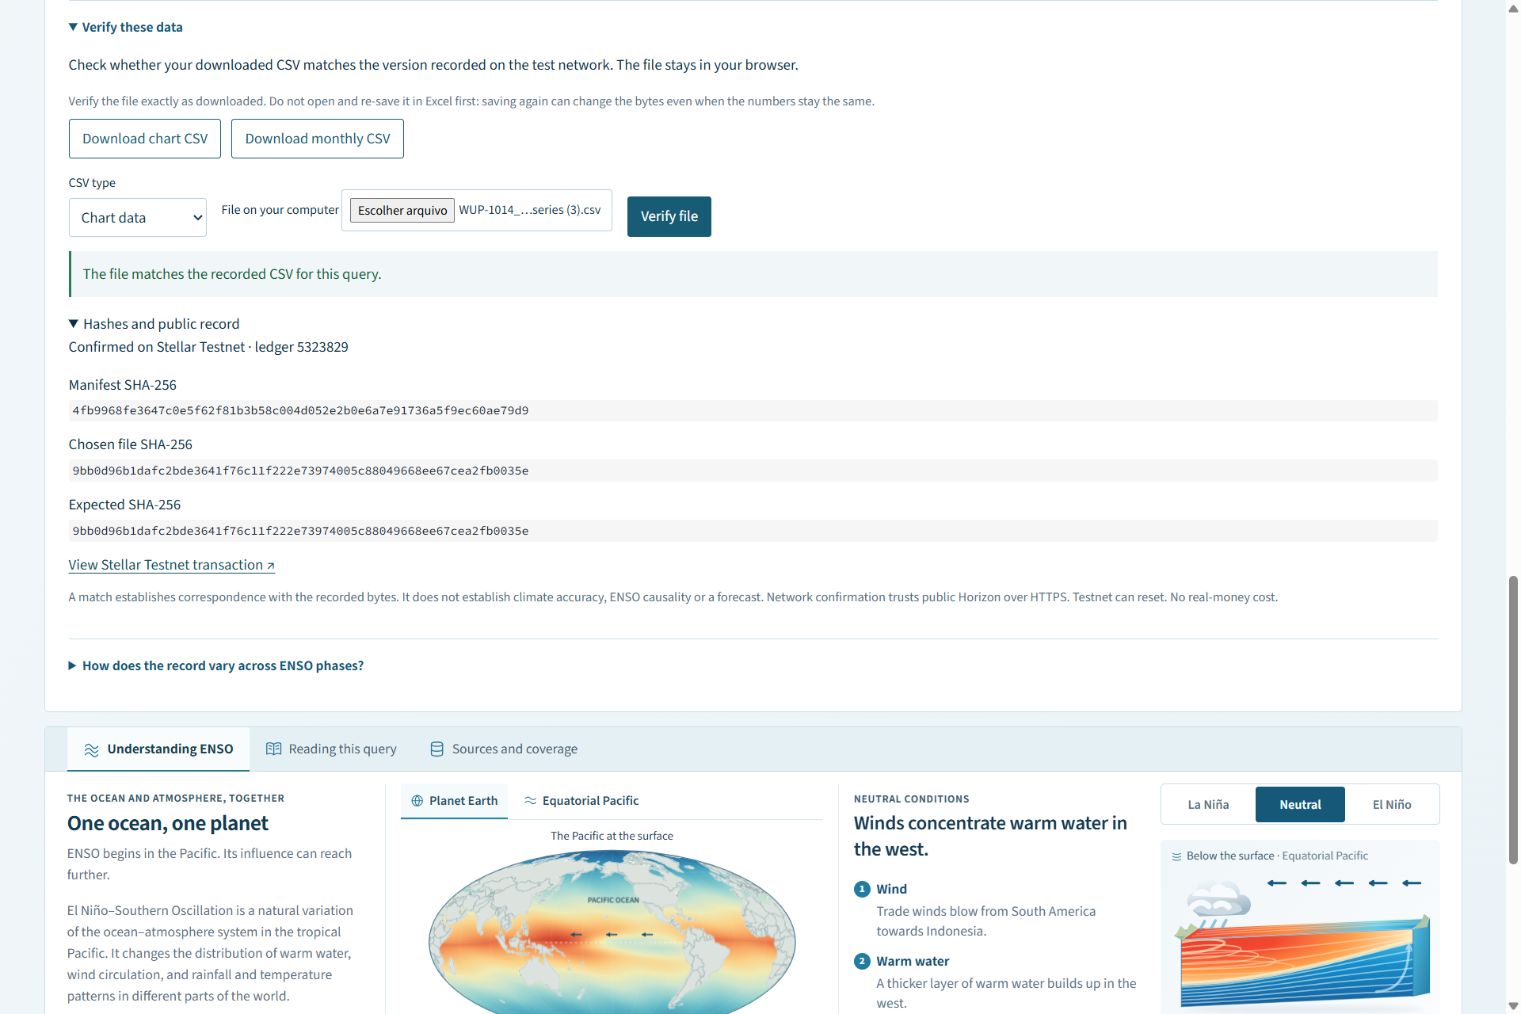
A downloaded CSV matches its recorded hash, checked against a manifest anchored on Stellar Testnet.
-
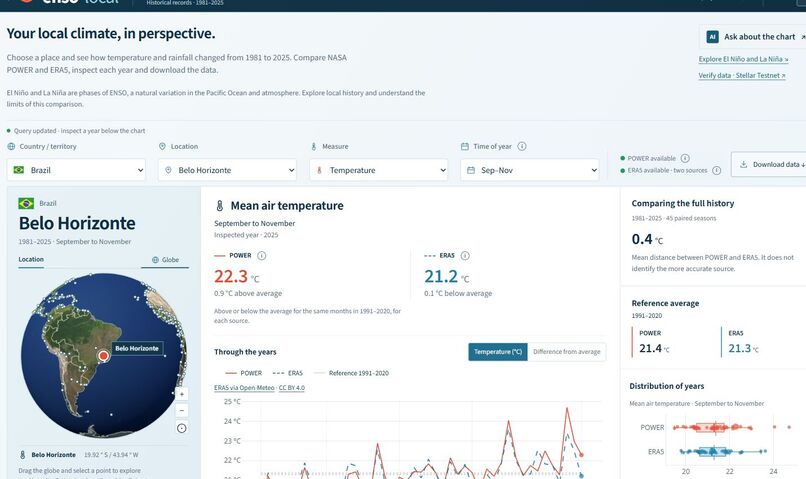
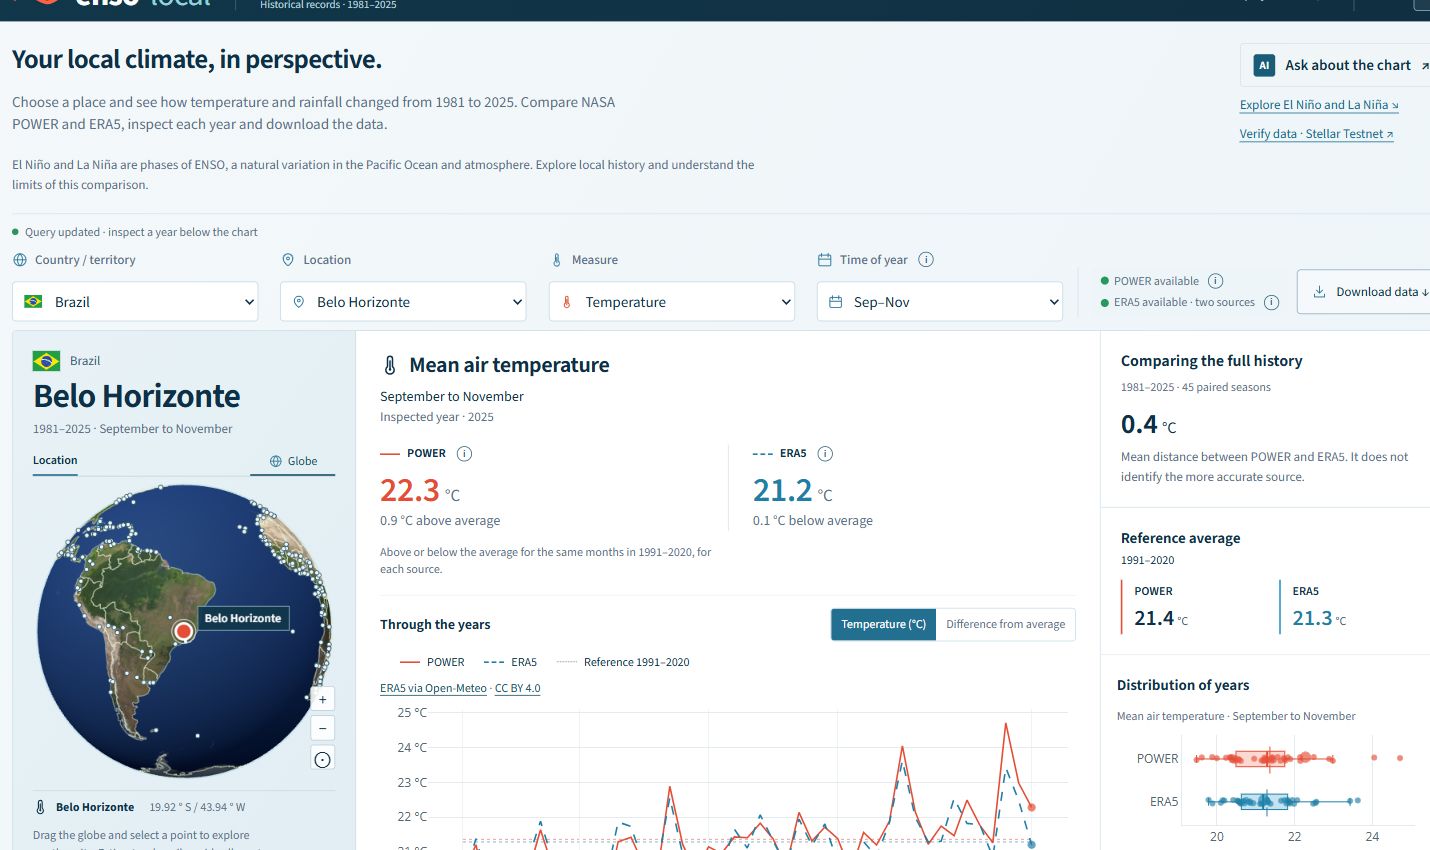
Explore a location, compare climate sources, inspect individual years and download the underlying data.
-
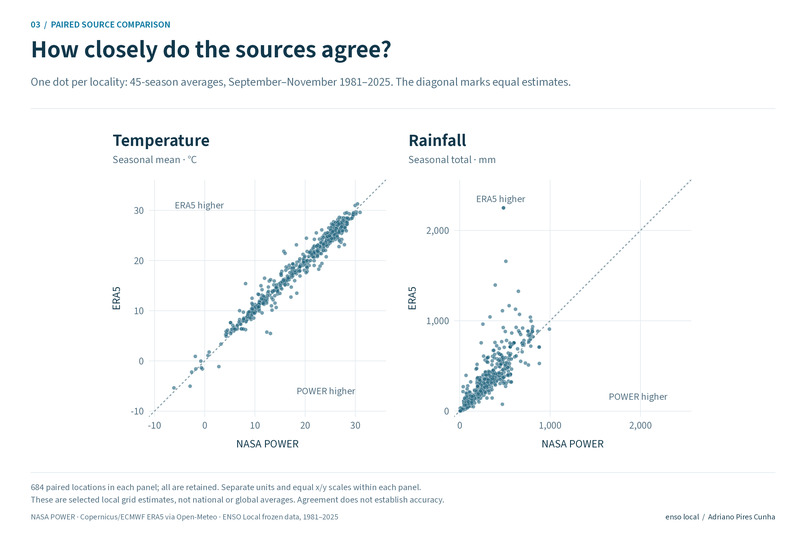
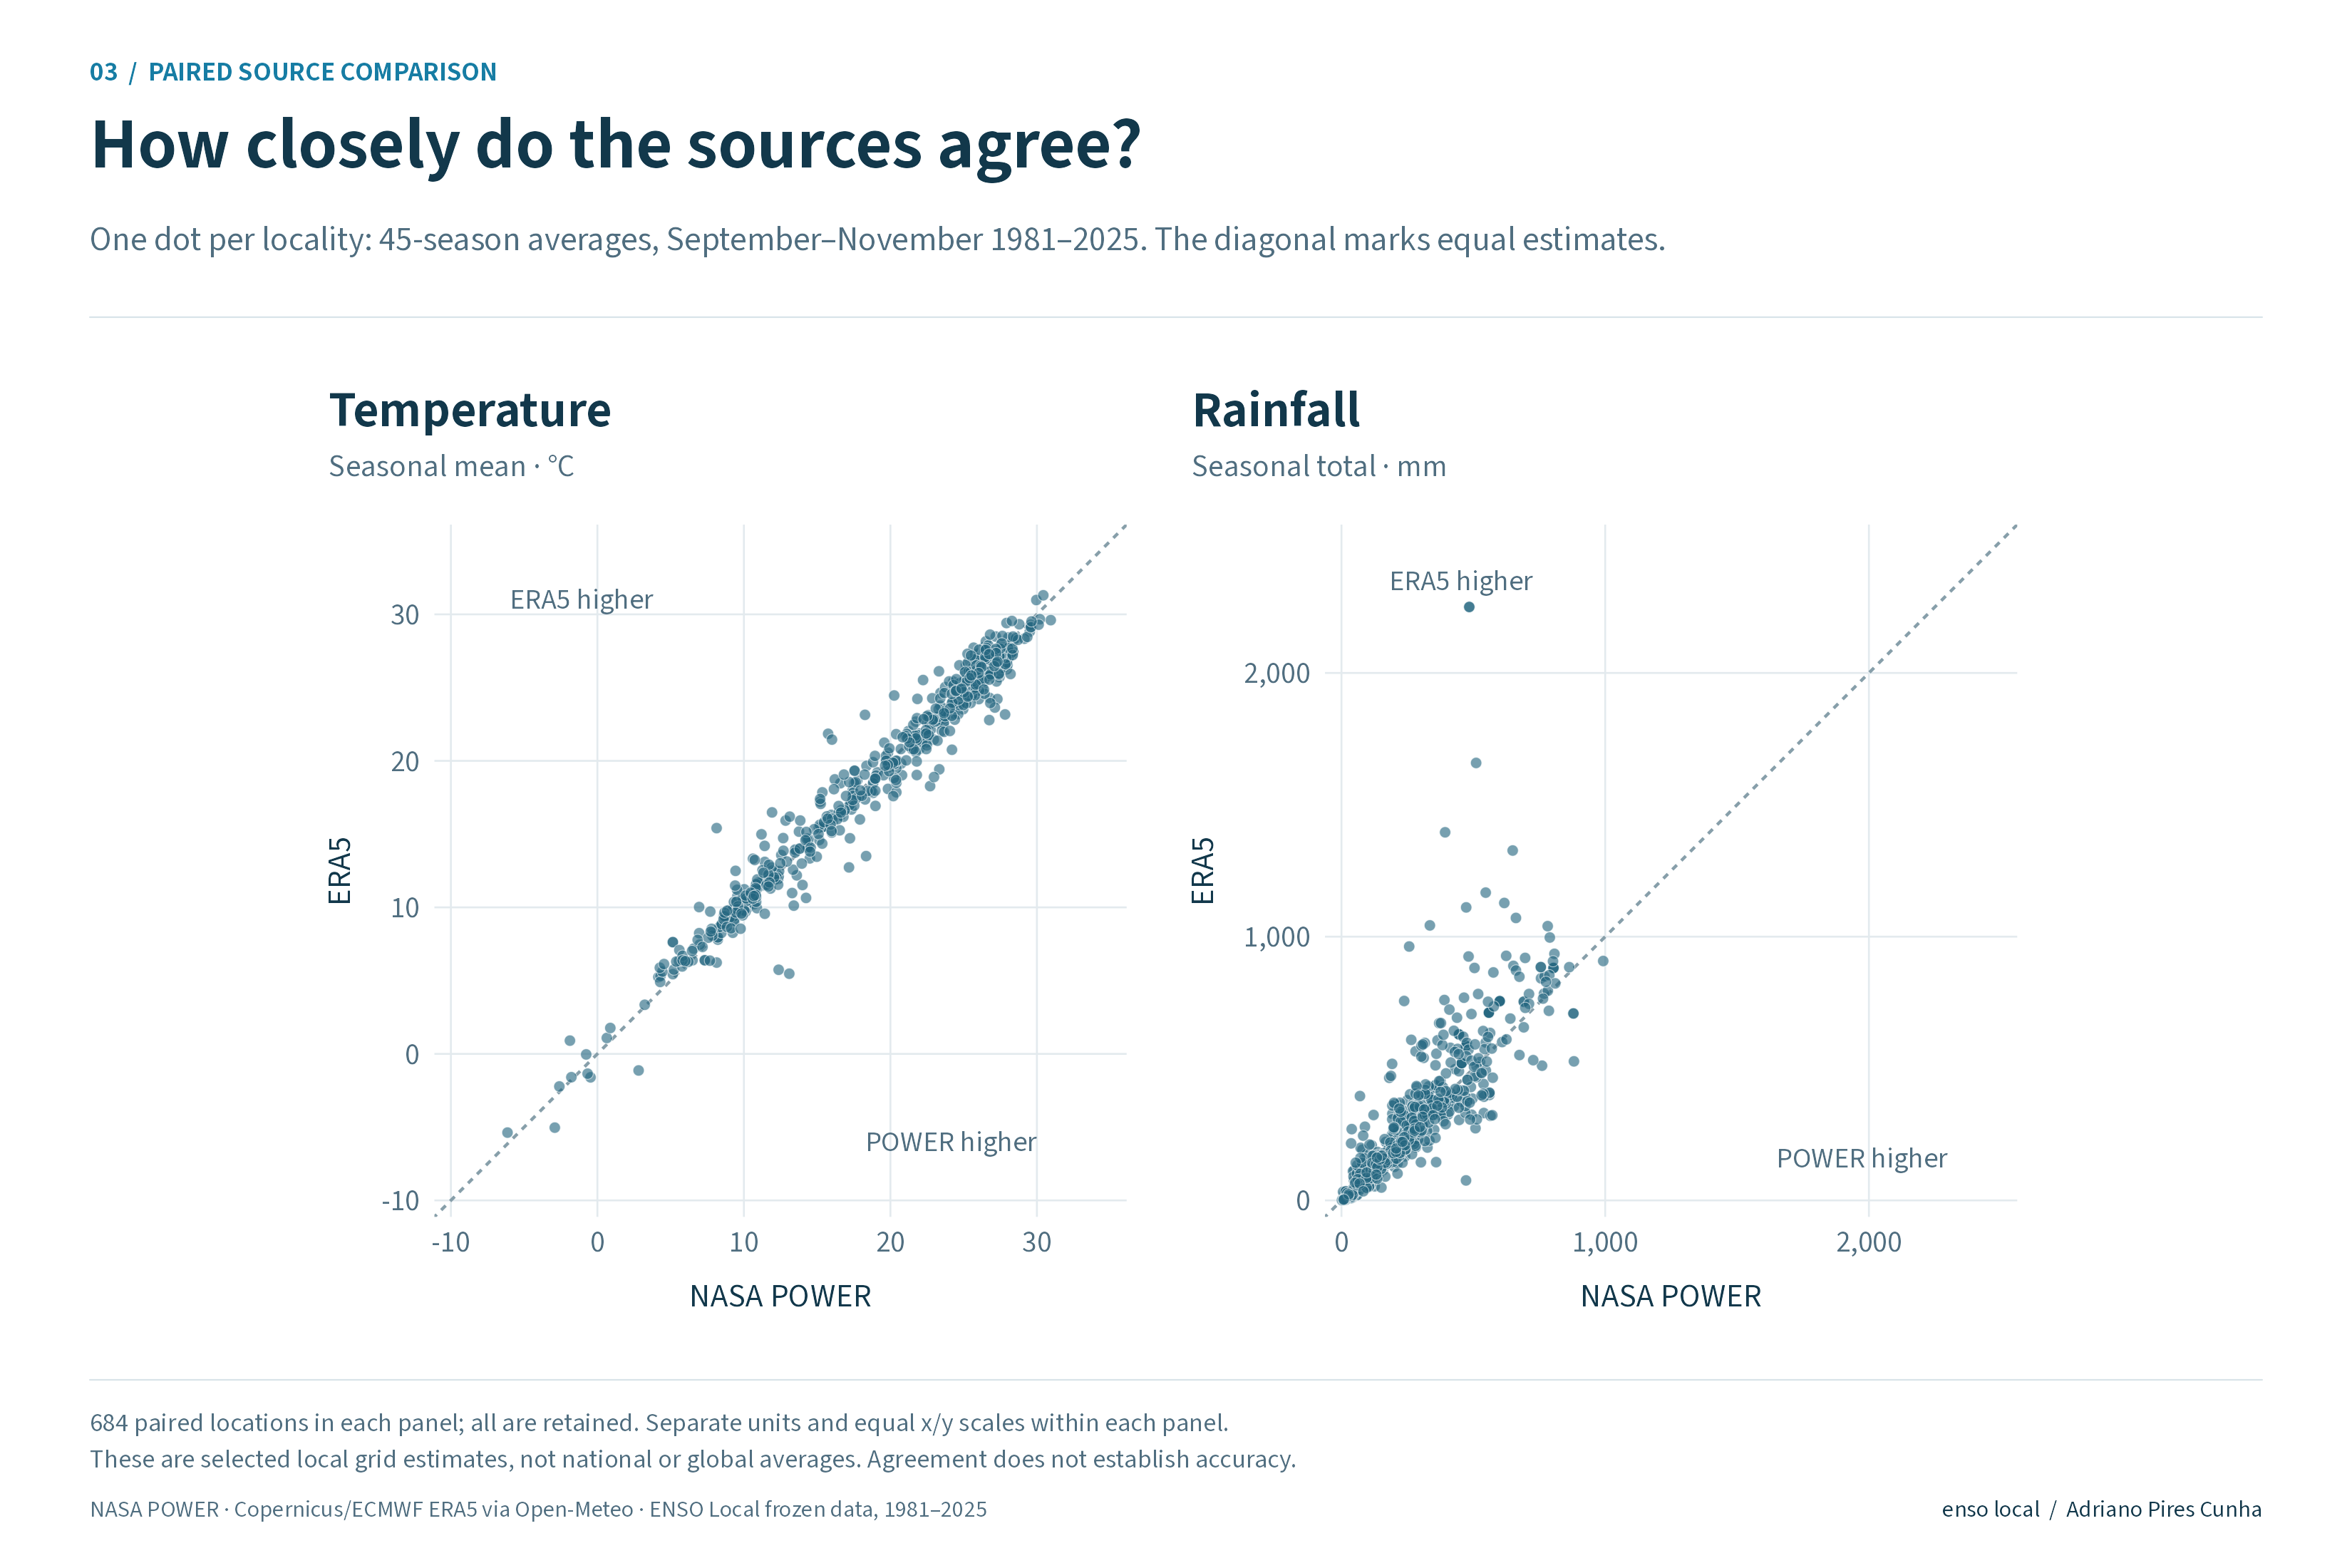
POWER versus ERA5 at 684 locations. The diagonal marks equal estimates; agreement does not establish accuracy.
-
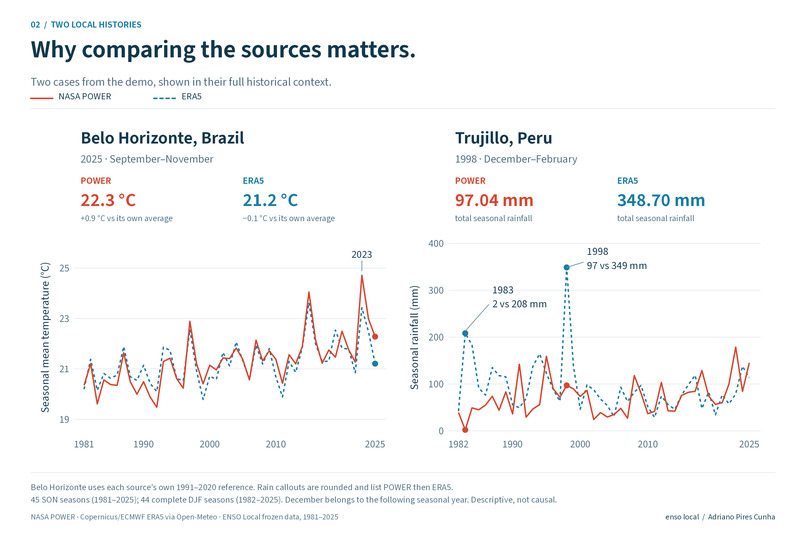
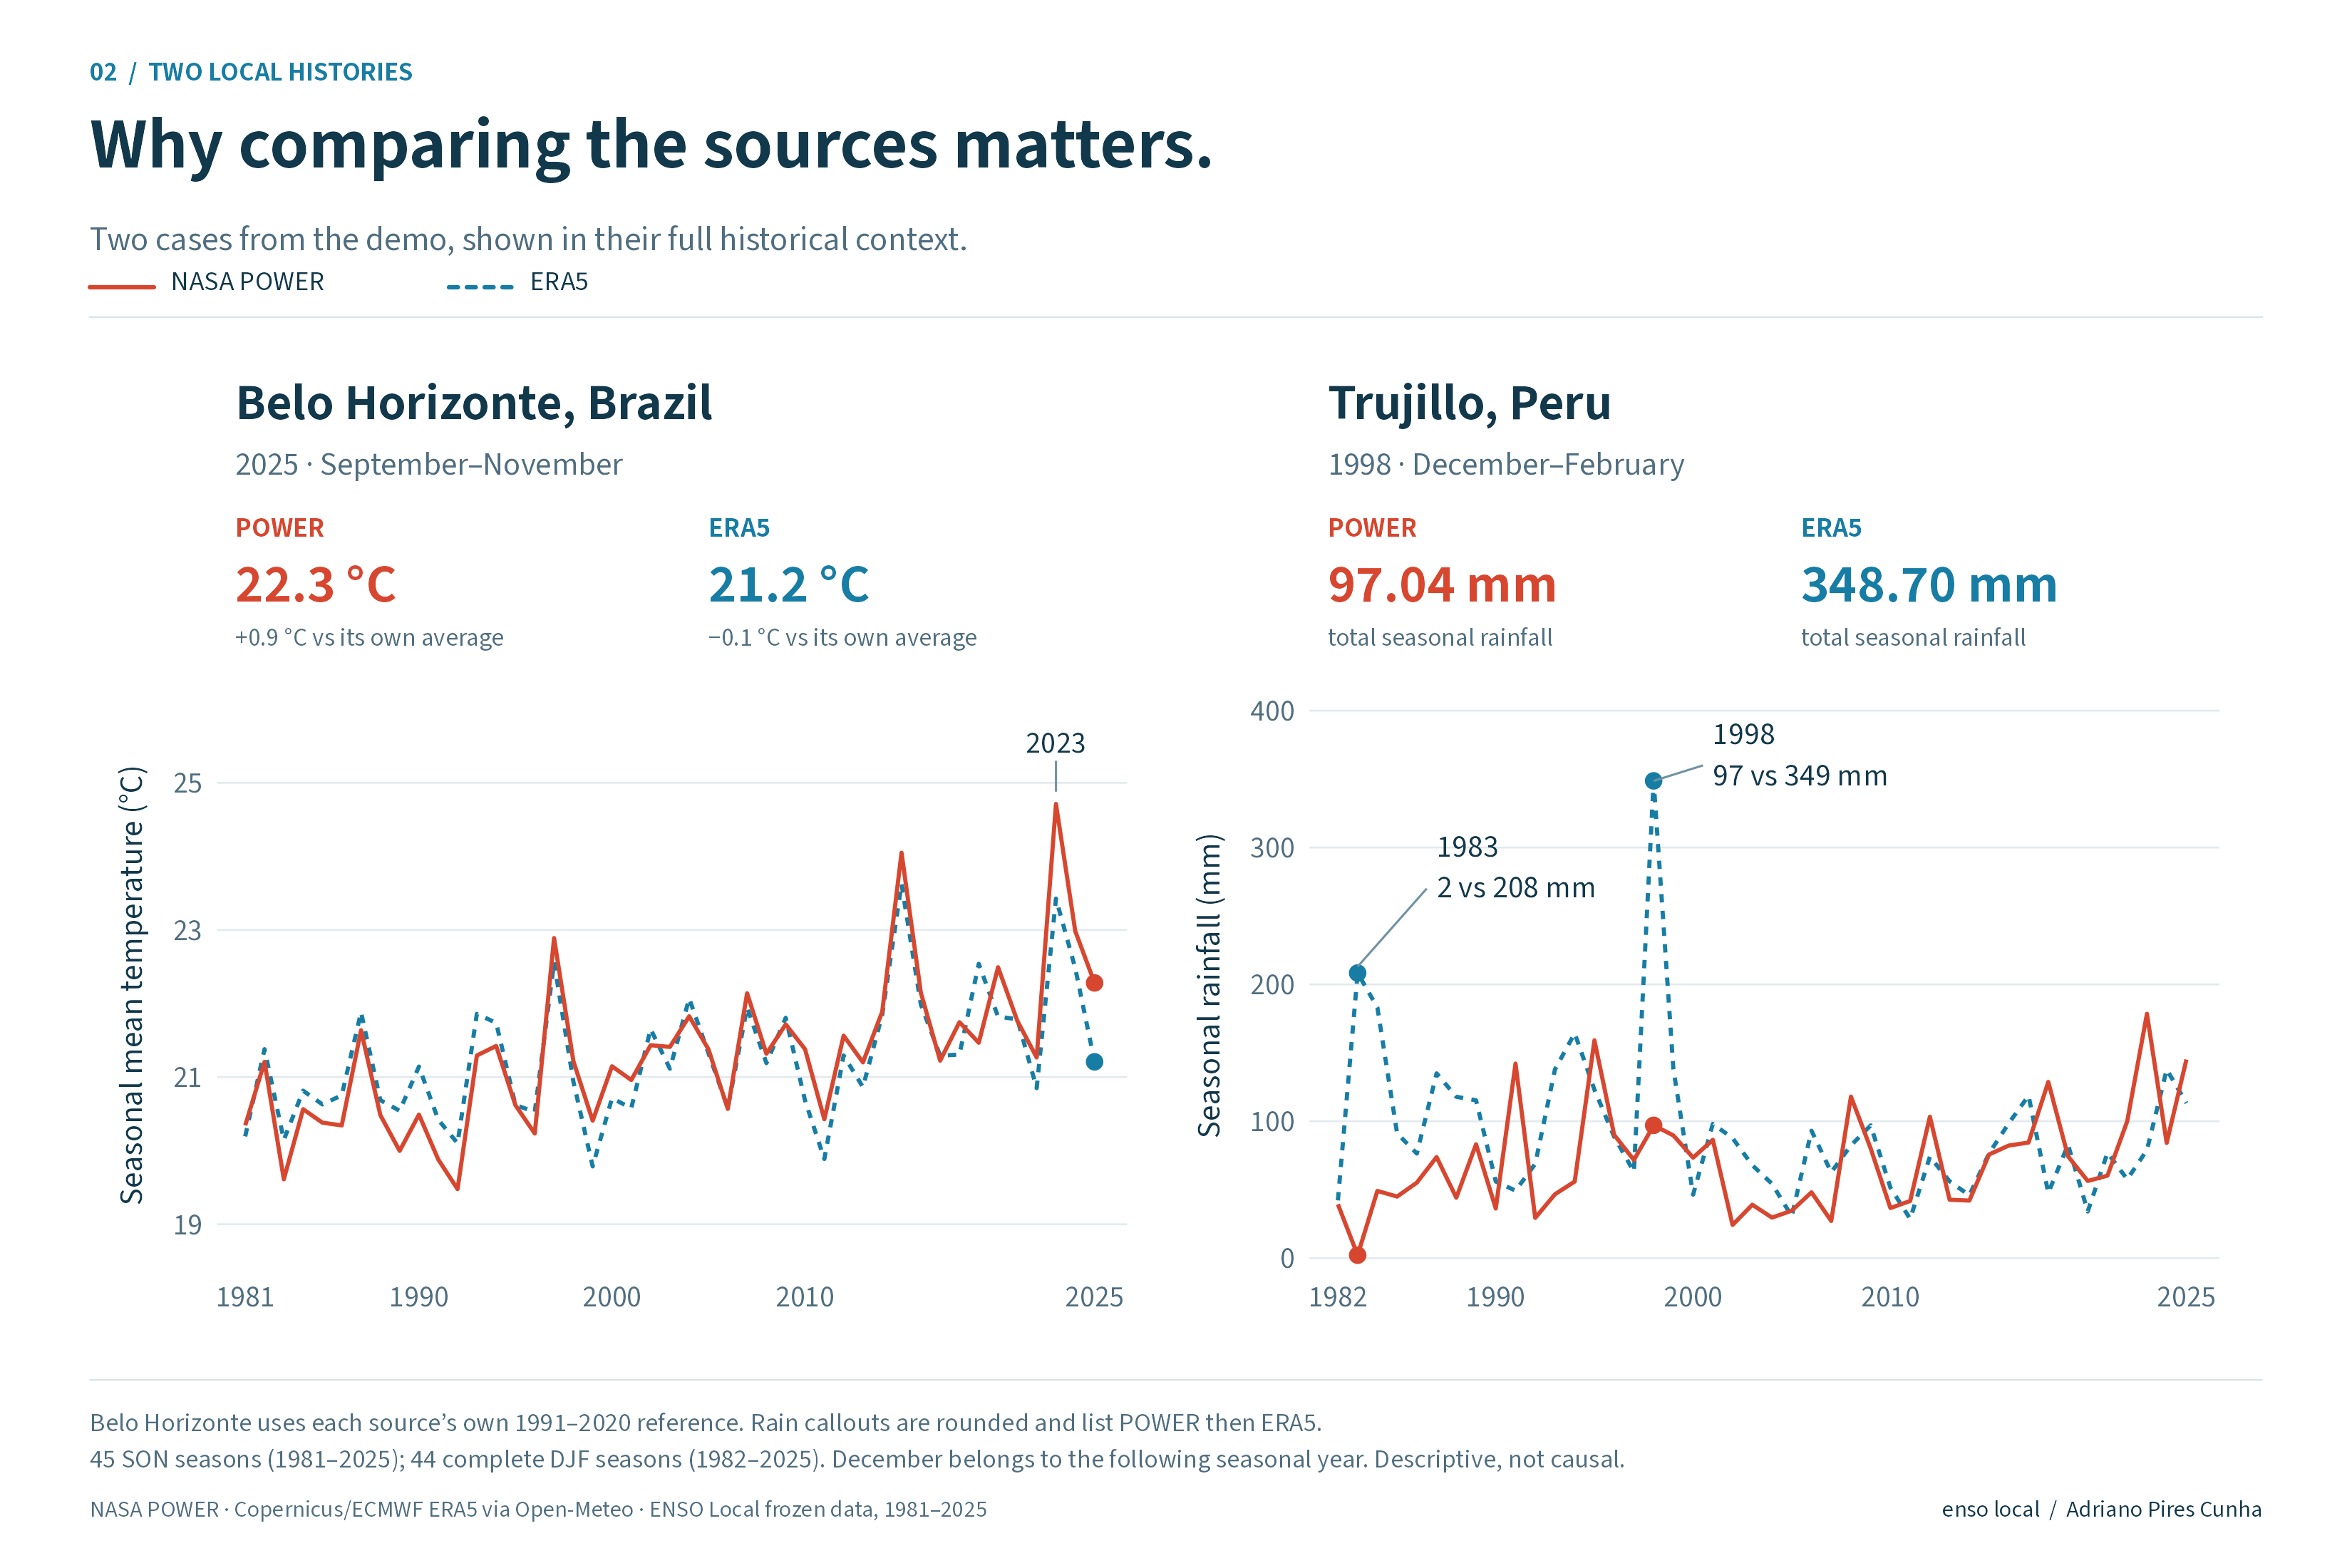
Belo Horizonte temperature and Trujillo rainfall: two real examples of why comparing climate sources matters.
-
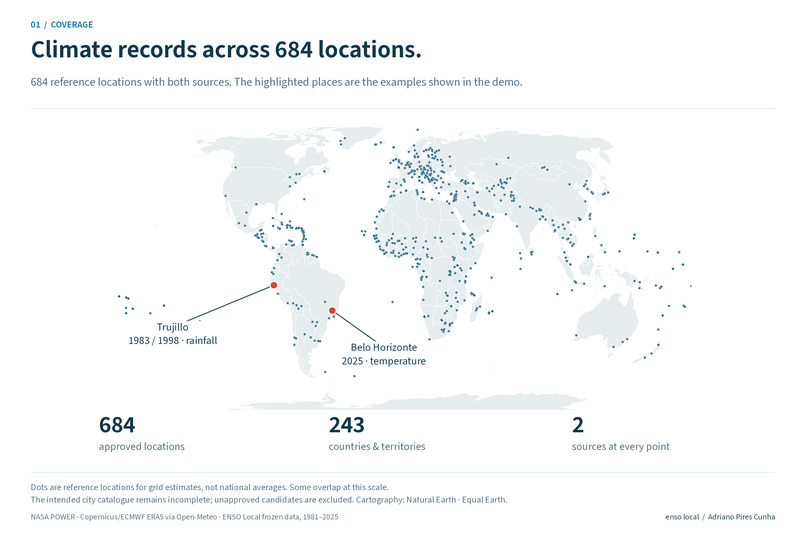
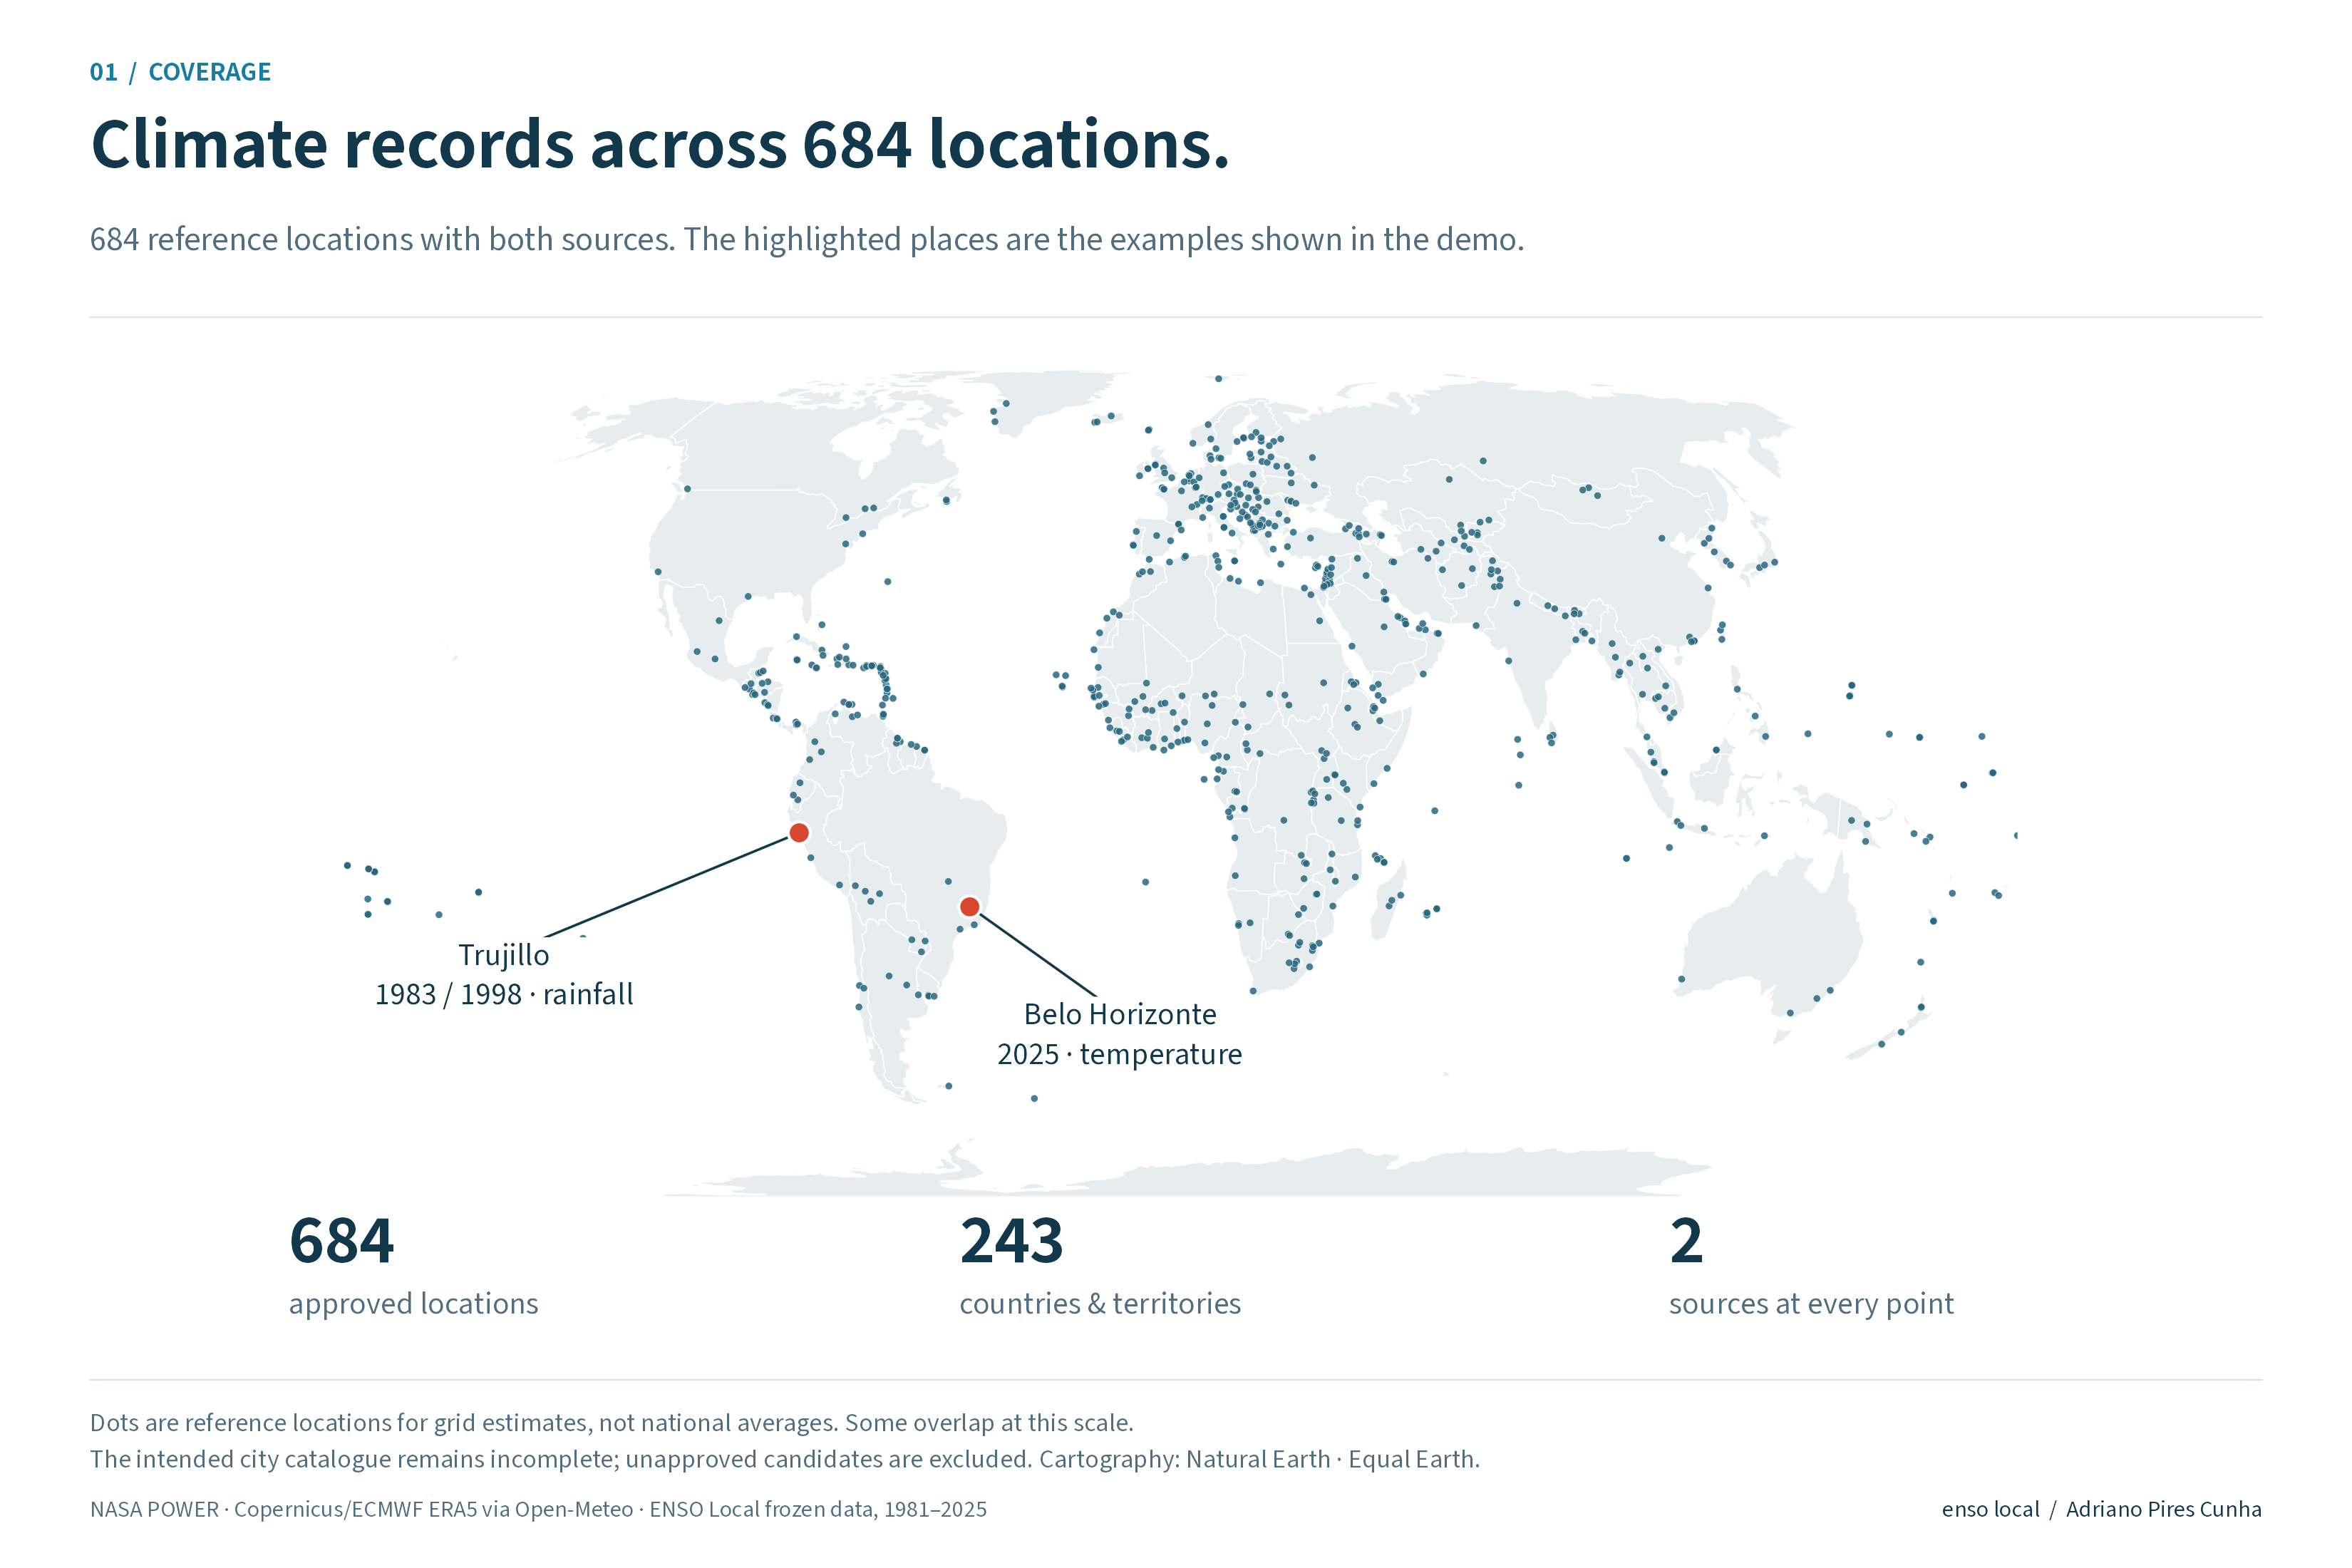
684 reference locations across 243 countries and territories, with NASA POWER and ERA5 records at every point.
Track: Climate Data & Environmental Monitoring.
Inspiration
Was September to November 2025 warmer than normal in Belo Horizonte? NASA POWER estimates about 0.9 °C above its reference, while ERA5 estimates about 0.1 °C below its own. Which number should a reader trust? ENSO Local makes the disagreement visible, explains the context and lets readers inspect the data version behind the chart.
The prototype addresses fragmented climate records and difficult-to-verify evidence. It is designed for students, educators and analysts exploring local climate, with potential use in municipal planning and adaptation research. Adoption and environmental benefits have not been measured.
Demo video
Watch the working prototype — 3 min 33 s, English with captions. The film combines real dashboard and public-explorer captures with explanatory animation; waits are shortened. Download the original MP4.
What it does
Choose a country or territory, a locality, temperature or rainfall, and a three-month season. The interactive globe locates the reference point. Two charts compare NASA POWER and ERA5 across years, with an inspected-year selector, source explanations, downloads, an optional AI interpreter and a visible file verifier. The dashboard works in English and Brazilian Portuguese, with light and dark themes.
The release contains 684 approved locations, both sources at every location, and 738,720 monthly records for 1981–2025. Temperatures are in degrees Celsius; rainfall is the three-month total in millimetres. The separate difference scale uses each source's own 1991–2020 average for the same months. December–February assigns December to the following seasonal year, so it has 44 complete seasons, starting in 1982. Other seasons have 45.
The main values follow the inspected year, while the full-history comparison summarises the mean absolute distance between the two sources across paired seasons. The distribution shows the individual seasons, median and middle 50%. Neither source agreement nor distance identifies the more accurate estimate.
Connecting local history to ENSO
El Niño and La Niña are phases of the coupled tropical Pacific Ocean and atmosphere. The app now compares local anomalies during El Niño, La Niña and neutral/transition seasons at every approved location. Expand the historical phase summary to inspect group means, the middle 50% of years, season counts, episode counts and the years used.
The preregistered descriptive protocol uses NOAA CPC's RONI ERSSTv6 as the primary index and ONI ERSSTv6 as sensitivity analysis. A persistent warm or cold episode requires at least five consecutive overlapping seasons at the ±0.5 threshold. The local three-month season uses the index for its central month. Neutral/transition includes fluctuations outside persistent episodes.
Trujillo, Peru, illustrates why both source and index matter. For December–February 1983, POWER estimates 2.17 mm and ERA5 208.30 mm. In 1998, the totals are 97.04 and 348.70 mm. Under RONI, the El Niño-minus-neutral/transition mean contrast is +50.25 mm in ERA5 and +6.29 mm in POWER. With ONI, POWER's contrast becomes −1.65 mm. The automatic explanation now states that its direction depends on the index, rather than presenting numerical sign agreement as consistent evidence. This example was selected retrospectively, not as an independent validation set. It does not establish which source is correct.
These comparisons are descriptive, without confidence intervals, significance claims, trend adjustment or causal attribution. Years within an episode and estimates from the two sources are not independent replications. Earlier inferential simulations did not justify releasing calibrated global inference. Interactive Earth and ocean illustrations explain the mechanism; their colours are qualitative, not measured temperatures. The product does not forecast local weather or ENSO impacts.
How we built it
Python acquires and checks records; R and Shiny serve the calculations and interface. Plotly renders the history and distribution; Three.js and D3 support the geographic and educational views. The repository records coordinates, units, source URLs, acquisition calendars, hashes, licences and dependencies.
ERA5 was acquired through Open-Meteo's historical API and public AWS archive. We audited the archive conversion, including precipitation accumulation conventions, before integration. These are acquisition routes for the same reanalysis, not a third independent source. Temperature summaries average three monthly means equally; rainfall summaries sum monthly totals. POWER's local-solar-time and ERA5's UTC calendars remain documented.
The bilingual AI interpreter uses DeepSeek Flash to identify a constrained question intent and evidence reference. R validates the result and supplies the numbers and reviewed explanation from the selected query. It supports requested year rankings of up to ten entries per source, the years of greatest disagreement, the inspected year, reference differences and scientific limits. Unsupported questions receive explicit guidance about the available evidence. It does not browse the web or generate forecasts.
Questions reach the AI service only after Ask is pressed. The interface explains processing and discourages personal information; the key stays on the server. Input/output bounds, timeouts, separate R workers, rate limits, caching and cancellation protect the dashboard. Six new targeted real PT/EN routing cases passed; this is not a general reliability guarantee. Calls through 8 November depend on prepaid balance and provider availability. If unavailable, a labelled local summary appears without AI interpretation. Charts, ENSO summaries, verification and downloads remain usable.
Blockchain verification inside the product
Open Verify these data, download a chart or monthly CSV, choose it and verify. The browser calculates SHA-256 locally and checks the exact locality, season, measure, language and export type against a committed index. The file stays in the browser; it is not uploaded by the verifier. The index covers 12,312 export hashes.
The CSV manifest's fingerprint is recorded on Stellar Testnet, using a native ManageData operation and hash memo. The app shows the manifest hash and a public transaction. An original downloaded CSV passed. Changing one value in a copy failed. Rewriting the local index and manifest also failed against the original network commitment. Only free test credits were used; no custom smart contract is claimed.
The release includes the complete 3,348-file package, a smaller 1,982-file hosting runtime, and separate receipts for their distinct manifest commitments. The runtime omits redundant acquisition-stage inputs while retaining every integrated climate record and download. The complete package keeps the reproducible source inputs. The runtime ZIP is the additional submission file, below the 35 MB limit.
These proofs establish correspondence with recorded bytes, not climate accuracy, civil identity, causal effects, forecasts, new AI replies or continuous attestation of the website. Network checks trust public Horizon over HTTPS, and Testnet can reset. Every recorded version and its receipts remain separate.
Challenges and lessons
A grid cell is not a municipal average or a weather station. We investigated selected disagreements and terrain-sensitive temperature differences near Bishkek and Almaty without replacing values to improve agreement. Incomplete station histories and selected temperature checks do not validate rainfall or every location worldwide.
The intended catalogue includes all capitals and the three largest cities per country, plus Viçosa, Ouro Preto and Belo Horizonte. Thirty-nine country/territory ranking or boundary cases remain unresolved; unapproved candidates are excluded. Full climate coverage at the 684 approved points does not mean the intended city catalogue is complete.
Feedback from four people, one with a statistics background, exposed confusion about absolute temperature versus differences. Later feedback informed onboarding, AI visibility, phase-control navigation and the current corrections. Participant feedback is qualitative and is not evidence of measured learning or climate benefits.
The unchanged runtime code and data passed 12 complete-package and 11 applicable runtime test suites, including export, language, interface, phase-summary and cryptographic checks. Protected climate and pilot assets were preserved by hashes. Public PT/EN tests exercised free questions, the inspected year and actual downloaded-file verification; mobile checks included a 390-pixel viewport. This revision reused installed dependencies rather than repeating a fresh dependency restore. Test scope and limitations are documented.
We learned that source comparison and blockchain integrity answer different questions. Matching files can still contain an inaccurate estimate. Conflicting climate sources can still be faithfully recorded. Accessible evidence needs clear units, reproducible calculations, provenance and visible limits together.
What's next
Expand independent observational validation and calibrated inference, resolve city-catalogue gaps and evaluate comprehension and practical usefulness. We do not claim operational forecasts, quantified avoided losses or formal provider endorsement.
Sources and prior work
See the credits and licences for NASA POWER, Copernicus/ECMWF ERA5 via Open-Meteo, NOAA CPC indices, population sources, cartography and visual libraries. The earlier oceano-2026 project informed the exploration; the dedicated repository contains the delivered prototype.
Built With
- ai
- blockchain
- deepseek
- plotly
- python
- r
- shiny
- stellar
- three.js

Log in or sign up for Devpost to join the conversation.