Inspiration
Energy markets are notoriously volatile, and a single price spike can cost utilities and traders millions. Yet understanding why a spike happened requires cross-referencing real-time prices, grid load, fuel mix, and weather data across multiple sources. We wanted to build an AI copilot that could do this analysis in seconds, using only free, public data. This democratizes energy market intelligence that typically costs $50K+/year from incumbent platforms. Identification of these spikes also provide opportunities for more sustainable energy consumption.
What it does
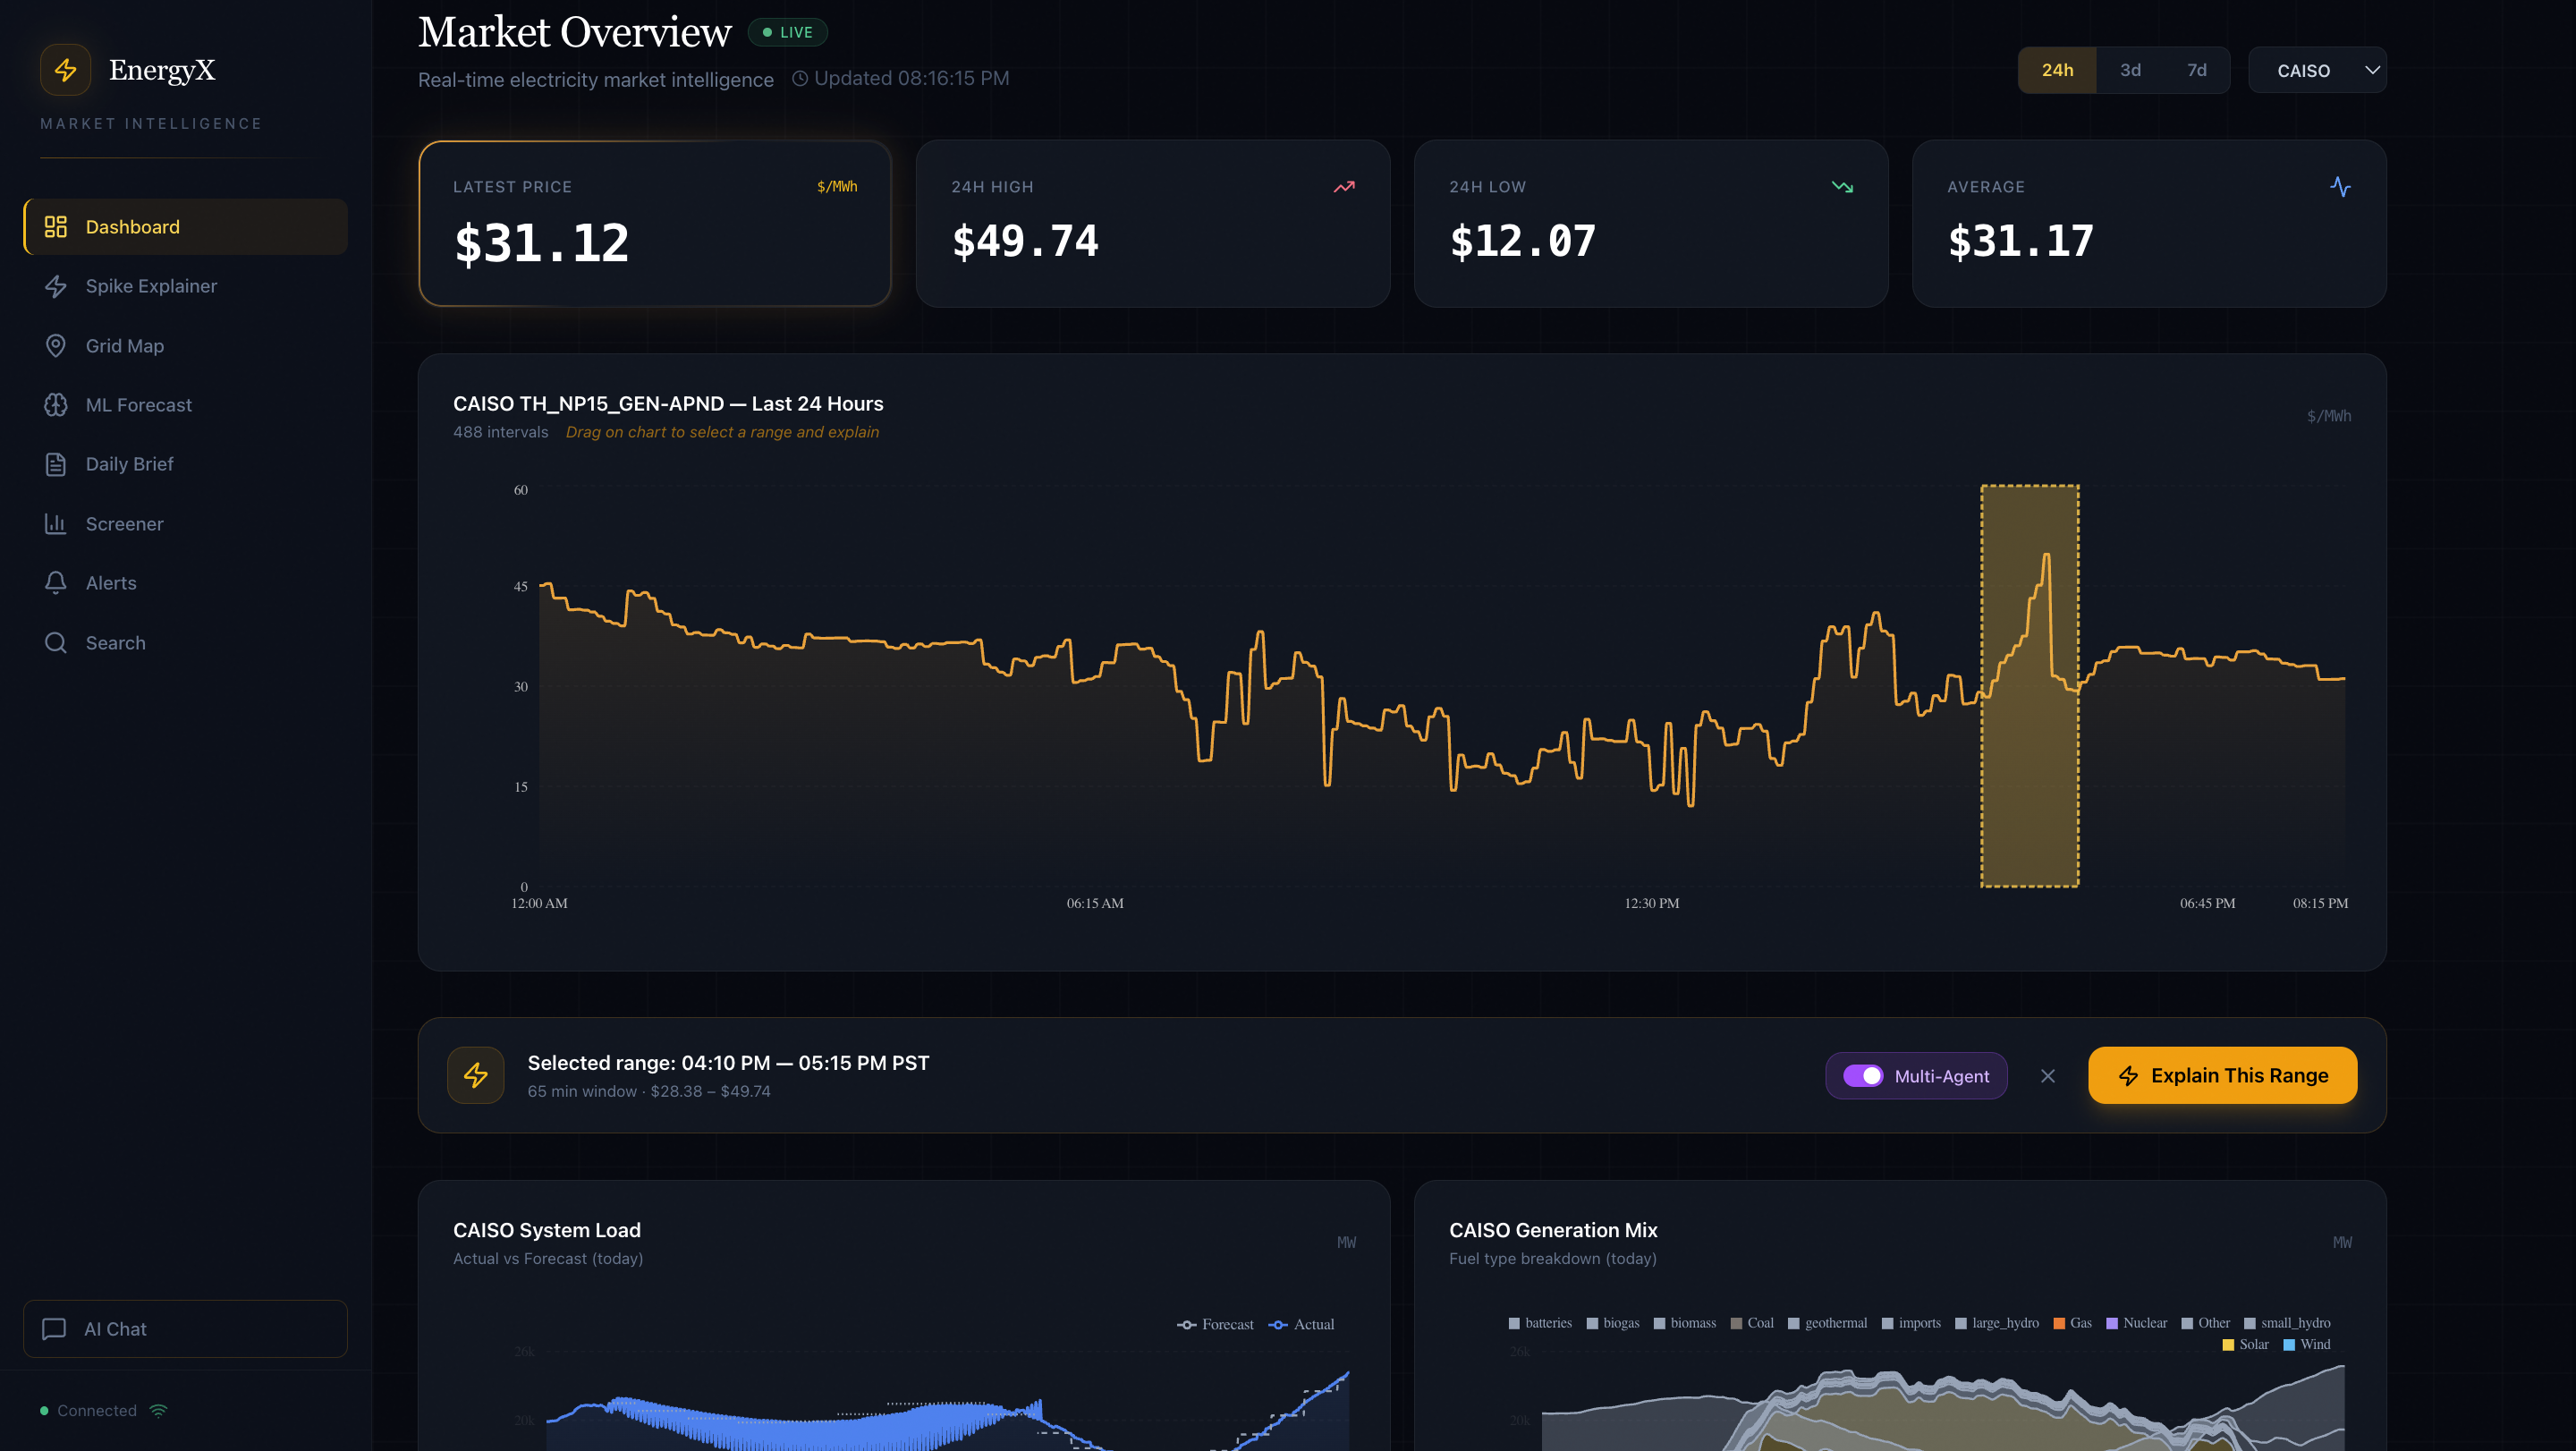
EnergyX monitors ERCOT and CAISO power markets in real-time and answers three questions: what happened, why, and what's likely next. It features:
- Live Dashboard with WebSocket price feeds, load curves, and fuel mix charts
- AI Spike Explainer that uses a multi-agent LangGraph pipeline (Data, Analysis, Narrative, Verification) to produce evidence-backed explanations of price anomalies
- ML Forecasting with XGBoost models that predict next-interval prices and spike probabilities
- Geographic Grid Map showing live node prices and spike hotspots
- RAG-powered Search using ChromaDB and Elasticsearch to find historical patterns
- Automated Daily Briefs and configurable email alerts
How we built it
Backend: FastAPI with async SQLite for low-latency data access. We built a data pipeline using the open-source gridstatus library to ingest ISO market data and NWS weather forecasts on a 15-minute schedule, with a 45-second WebSocket live feed.
AI Layer: A LangGraph multi-agent pipeline where specialized agents collect data, run spike detection (z-score based), build context packs, generate narratives via GPT-5, and cross-verify results using a secondary Mistral 7B model on RunPod. Spike explanations are indexed into ChromaDB and Elasticsearch for RAG retrieval for future analysis.
ML: XGBoost models trained on engineered features (price lags, rolling stats, hour/day cyclical encodings, momentum indicators) for price regression and spike classification with 90% confidence intervals.
Frontend: React 19 + TypeScript with Tailwind CSS, Recharts for interactive visualizations, SSE streaming for real-time AI explanations, and a responsive sidebar layout with live connection indicators and toast alerts.
Challenges we ran into
- Market data reliability: ISO APIs are slow and inconsistent, so we implemented a DB-first, live-fallback strategy with stale-while-revalidate caching to handle outages gracefully.
- LLM verification: Single-model explanations sometimes gave us hallucinated drivers. We added a verification loop in LangGraph and cross-verification via a secondary model to catch errors.
- Timezone complexity: ERCOT runs on Central time, CAISO on Pacific, so the solar generation relevance depends on local time (6 AM–7 PM), requiring careful timezone-aware logic throughout.
- SSL issues with CAISO: macOS Python's SSL certificates don't include CAISO's CA, requiring a certifi-based patch.
What we learned
We learned that the hardest part of AI applications isn't the model, it's actually building reliable data pipelines and context assembly. The quality of our spike explanations improved dramatically when we invested in better context packs (correlating prices with load ramps, fuel mix shifts, and weather data) rather than prompt engineering alone. We also gained deep appreciation for multi-agent architectures where verification agents catch hallucinations that single-pass generation misses.
What's next for EnergyX
- Expand ISO coverage — Add PJM, NYISO, SPP, and MISO to cover all major US power markets, giving nationwide visibility into price dynamics.
- Real-time trading signals — Evolve spike predictions from informational alerts into actionable buy/sell signals with backtested confidence scores for energy traders.
- Fine-tuned energy LLM — Train a domain-specific model on our growing RAG corpus of indexed spike explanations and market briefs to reduce reliance on standard LLM models and lower our latency.
- Renewable integration forecasting — Add solar irradiance and wind speed forecasting models to predict how renewable generation ramps will impact prices before they happen.
- Mobile app with push alerts — React Native companion app so grid operators and traders get spike alerts and AI briefs on the go.
- Utility partnerships — Integrate with SCADA/DERMS data from willing utility partners to unlock even deeper root-cause analysis that public data alone can't provide.
- Historical pattern matching — Use our Elasticsearch index of past spike events to surface "this spike looks like X from last summer" comparisons, giving analysts instant historical context.
Built With
- apscheduler
- axios
- chromadb
- elasticsearch
- fastapi
- gridstatus
- langchain
- langgraph
- mcp
- mistral-7b
- nws-api
- openai-gpt-4o
- python
- react
- recharts
- runpod
- scikit-learn
- sendgrid
- slack-api
- sqlite
- tailwind-css
- typescript
- vite
- websockets
- xgboost

Log in or sign up for Devpost to join the conversation.