

EnergySense: AI-Powered Energy Forecasting & Anomaly Detection
💡 Inspiration
Buildings account for nearly one-third of global energy consumption and CO₂ emissions. As cities grow and climate goals tighten, optimizing energy use in commercial and residential buildings has become critical. We were inspired by the potential of Time Series Foundation Models (TSFMs) — powerful AI models trained on diverse temporal data — to enable zero-shot forecasting and anomaly detection in buildings with minimal data. Our goal: build a smart, scalable tool that helps reduce energy waste, supports renewable integration, and accelerates decarbonization — all without requiring retraining for every new building.
🛠️ What It Does
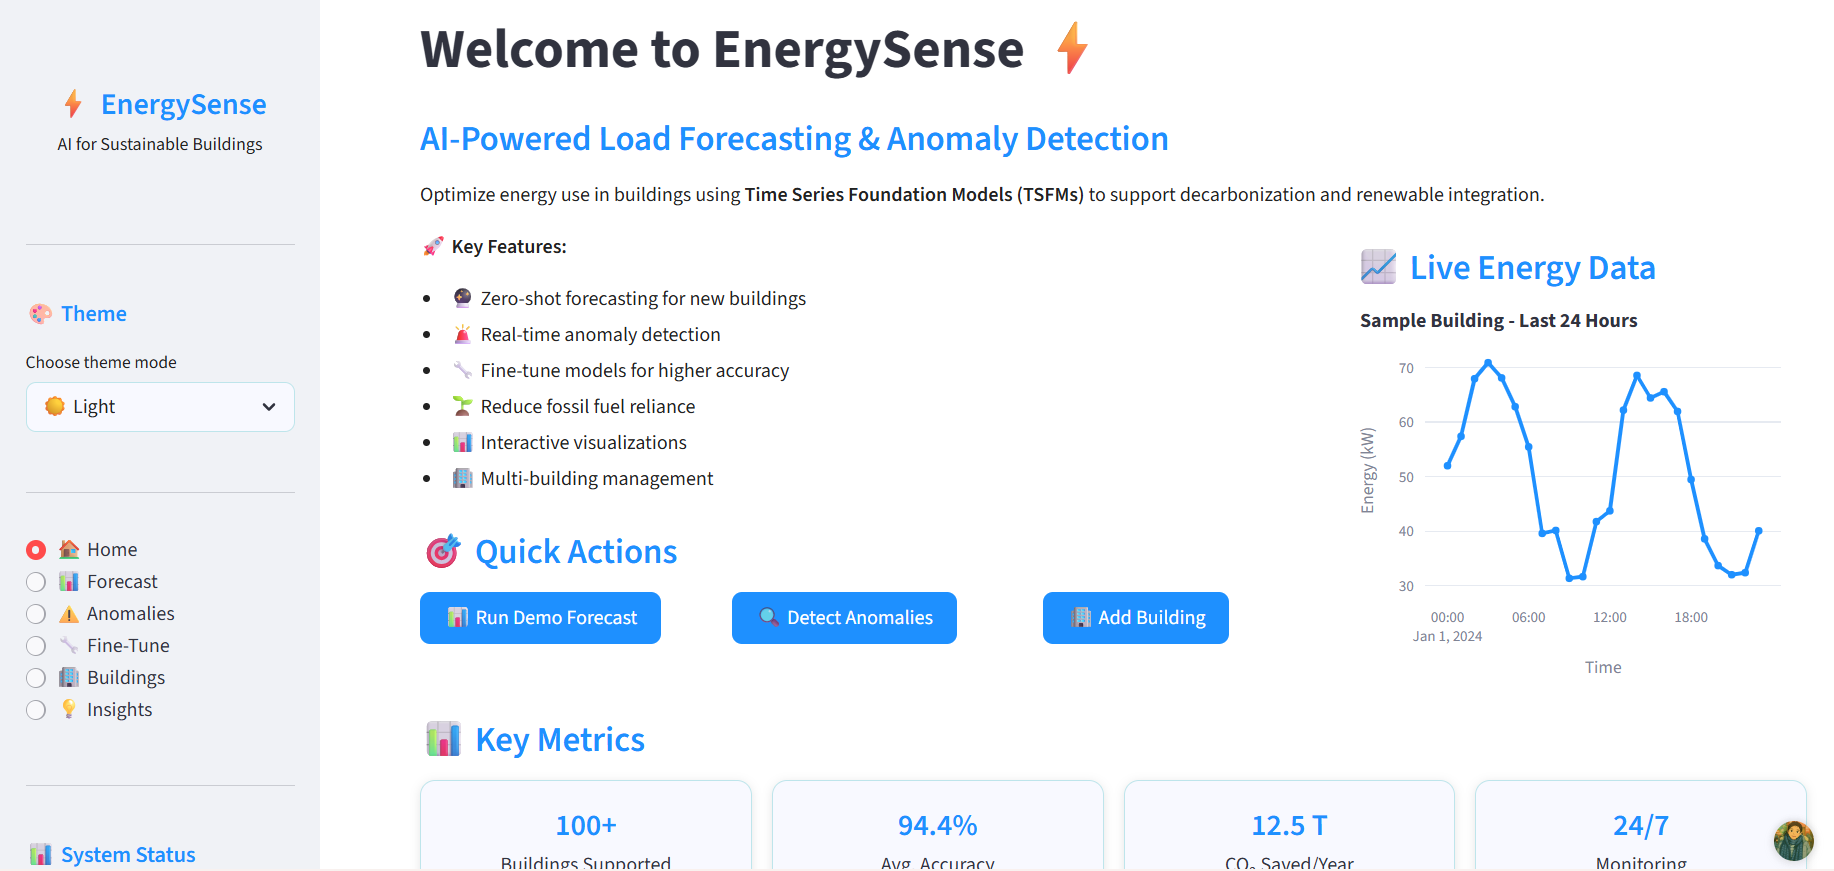
EnergySense is an interactive Streamlit web application that provides:
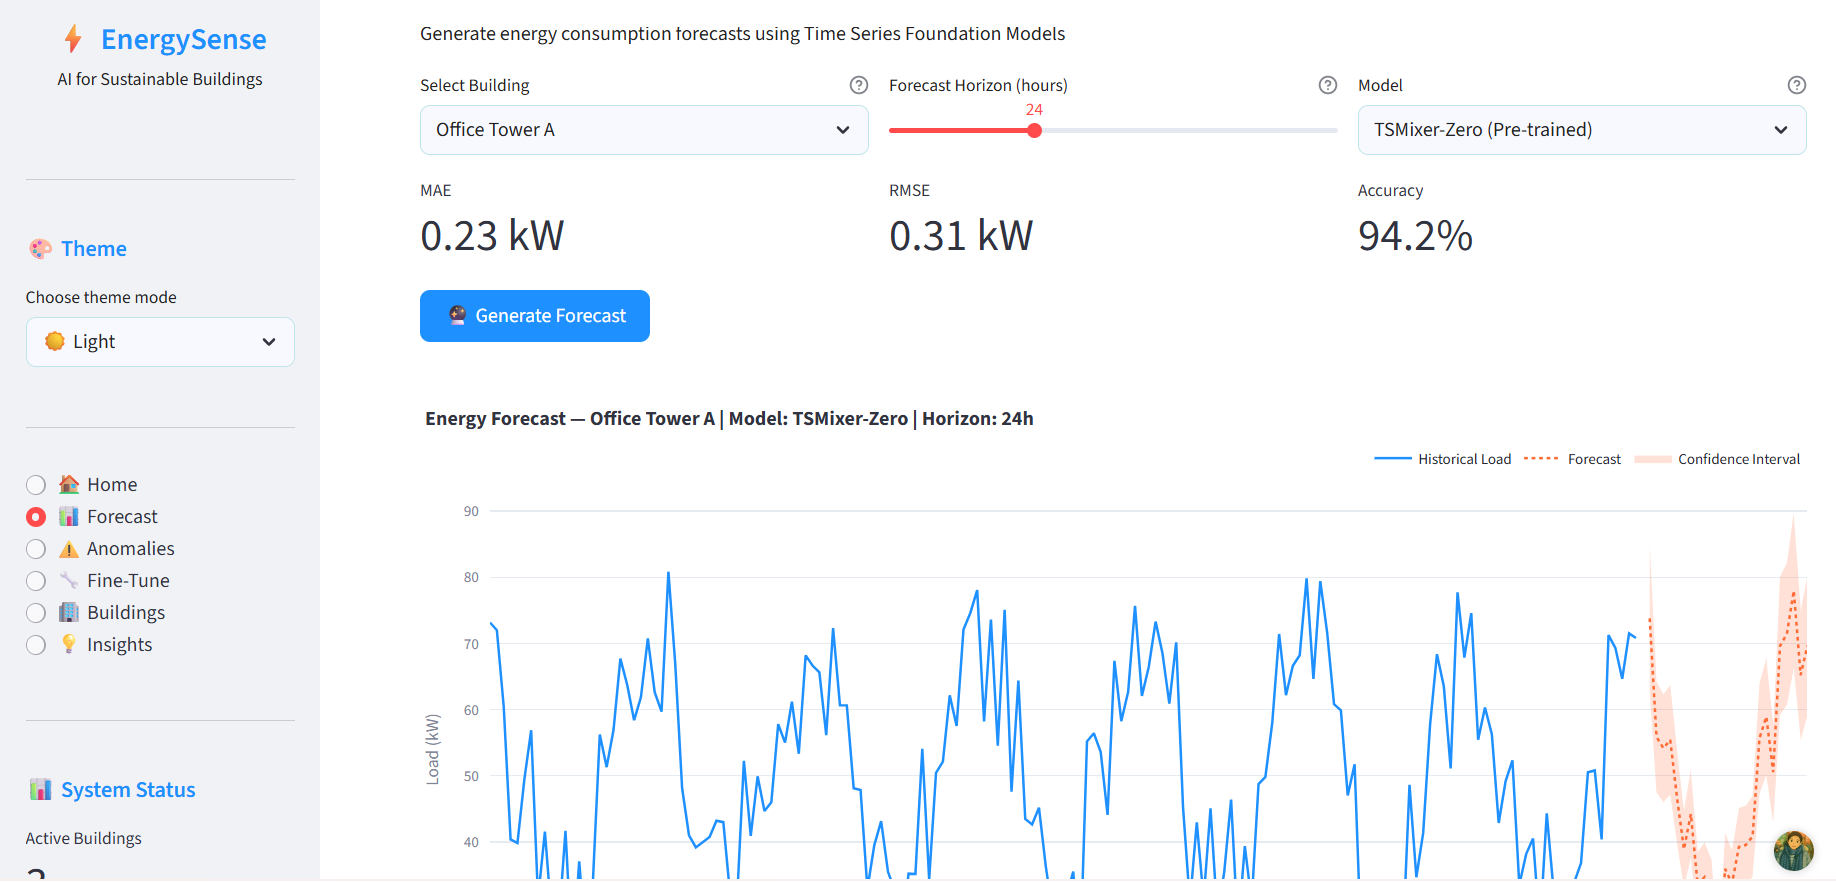
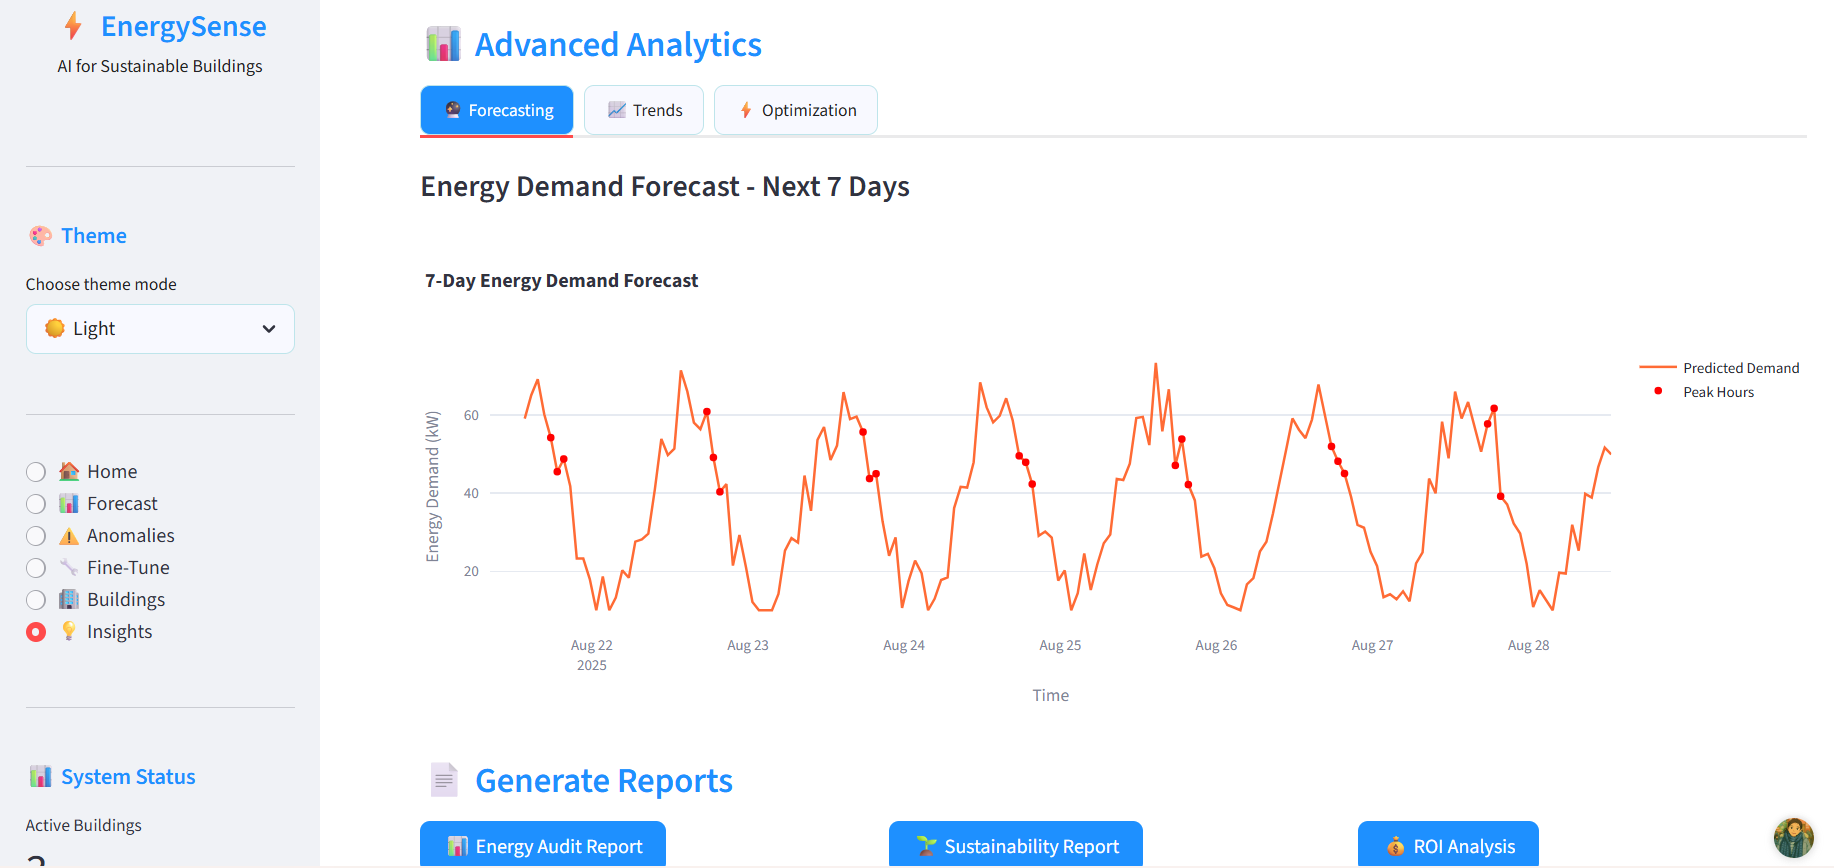
- 🔮 Short-Term Load Forecasting: Predicts energy consumption up to 72 hours ahead using pre-trained TSFMs like TSMixer, Informer, and TimesNet.
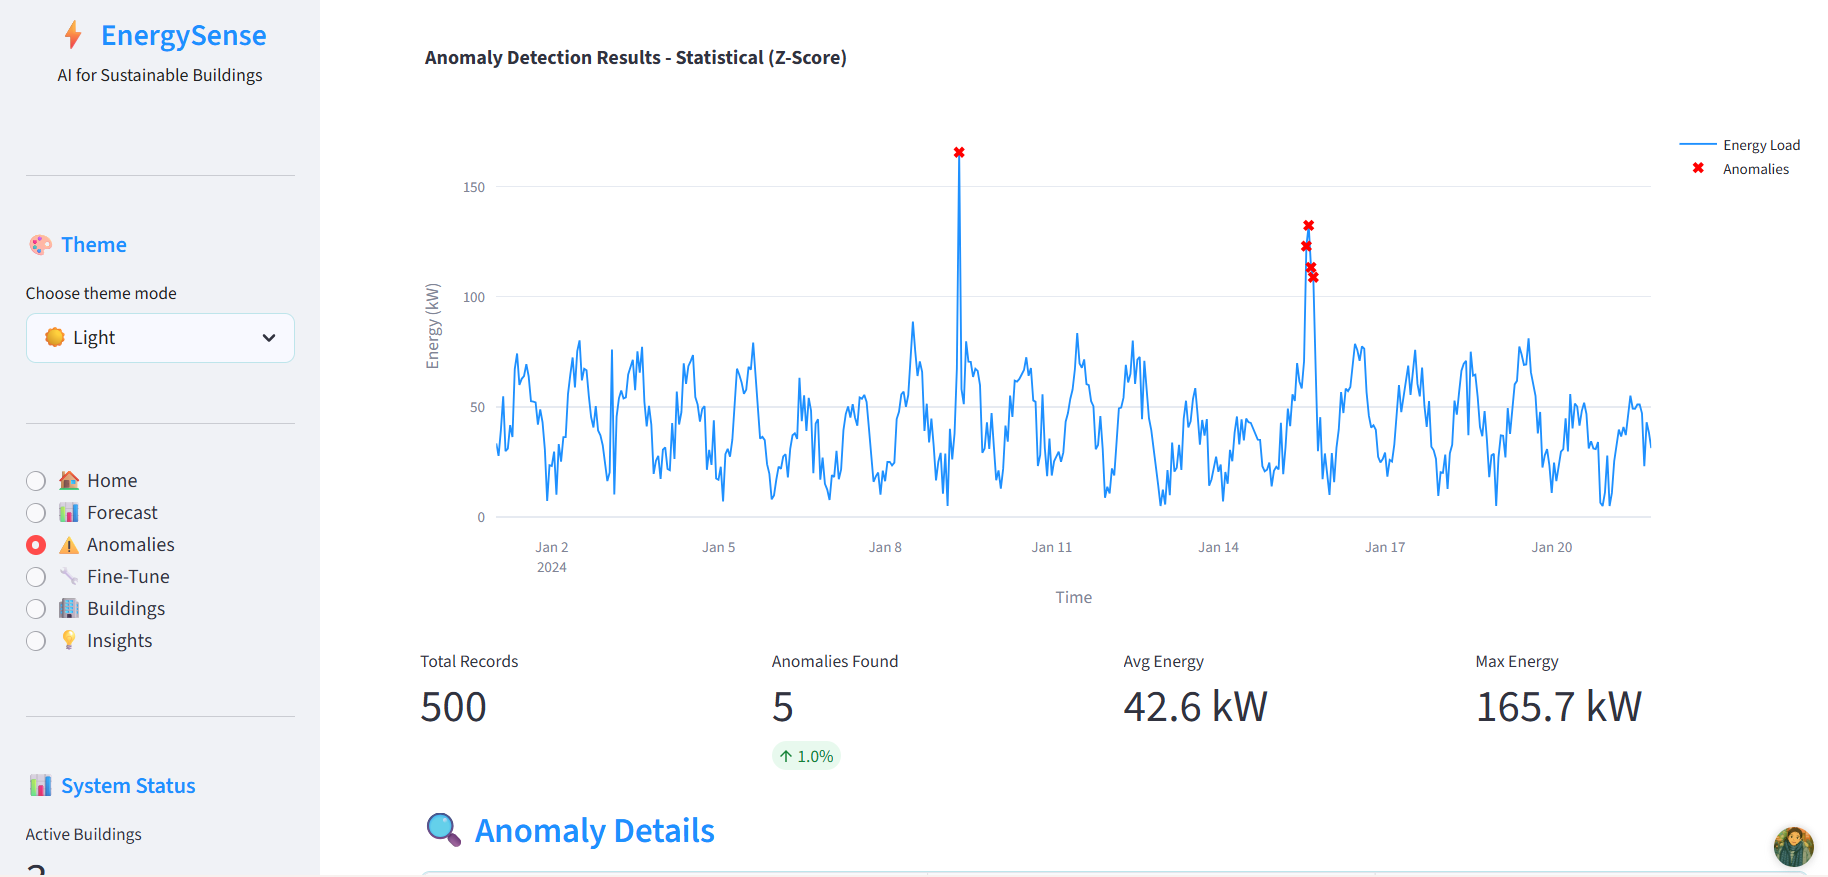
- ⚠️ Anomaly Detection: Identifies abnormal energy usage patterns (e.g., equipment faults, inefficiencies) using statistical and ML-based methods.
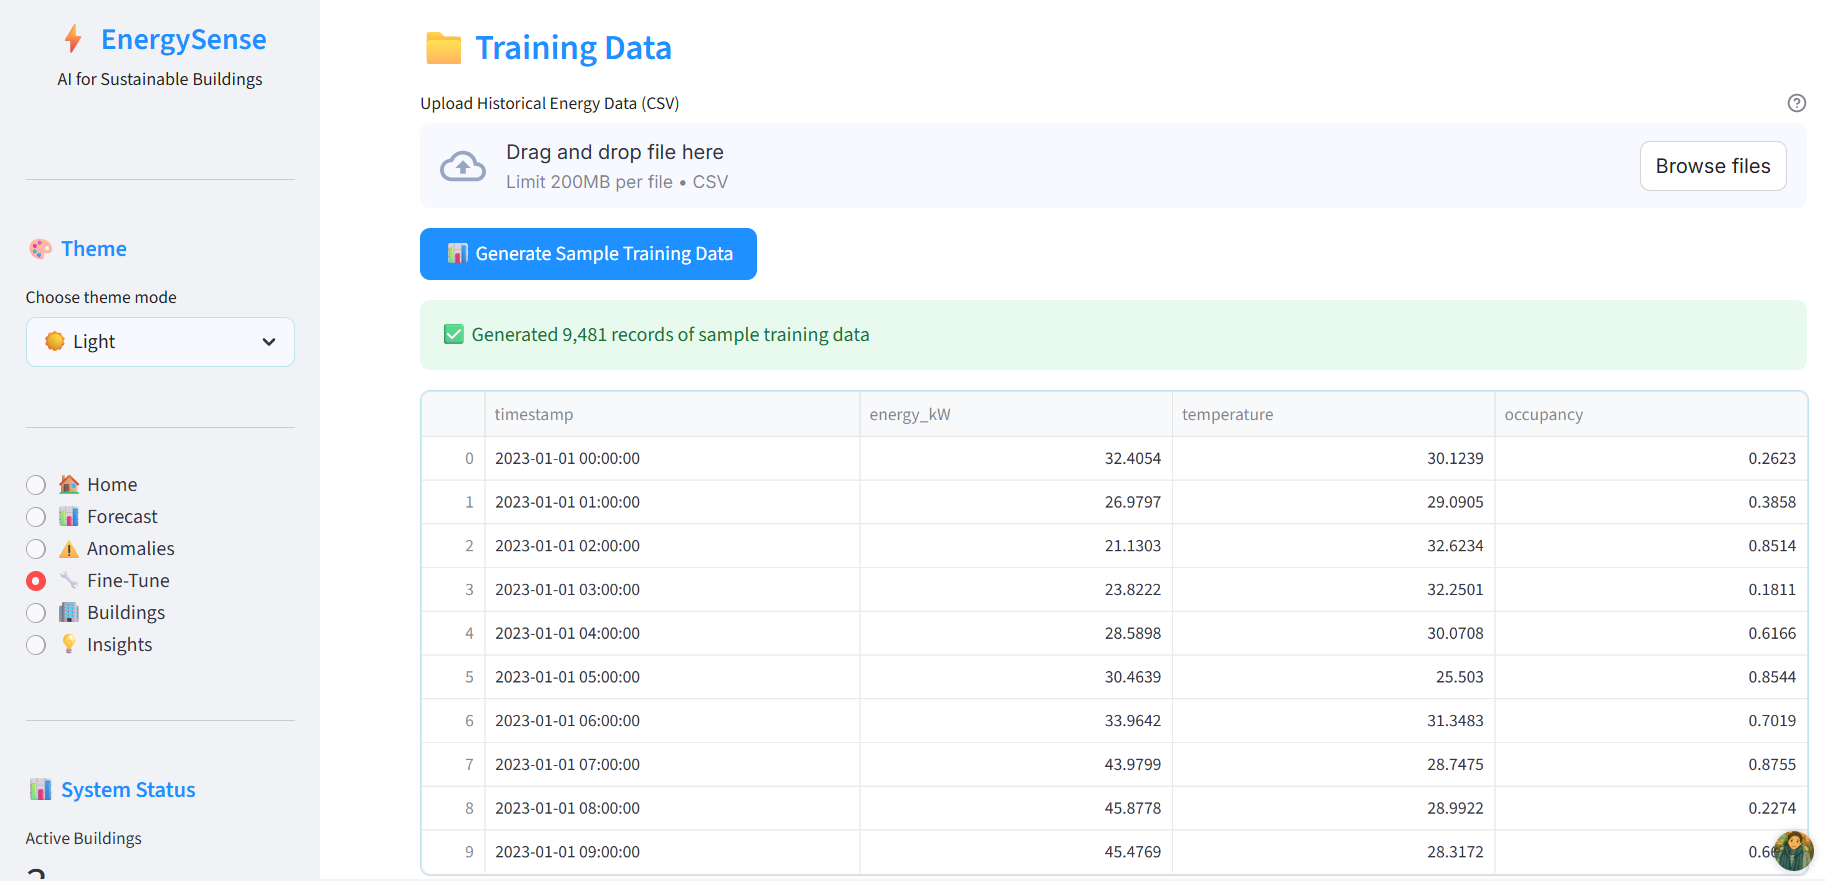
- 🔧 Fine-Tuning Capabilities: Allows users to upload building-specific data and fine-tune the foundation model for higher accuracy.
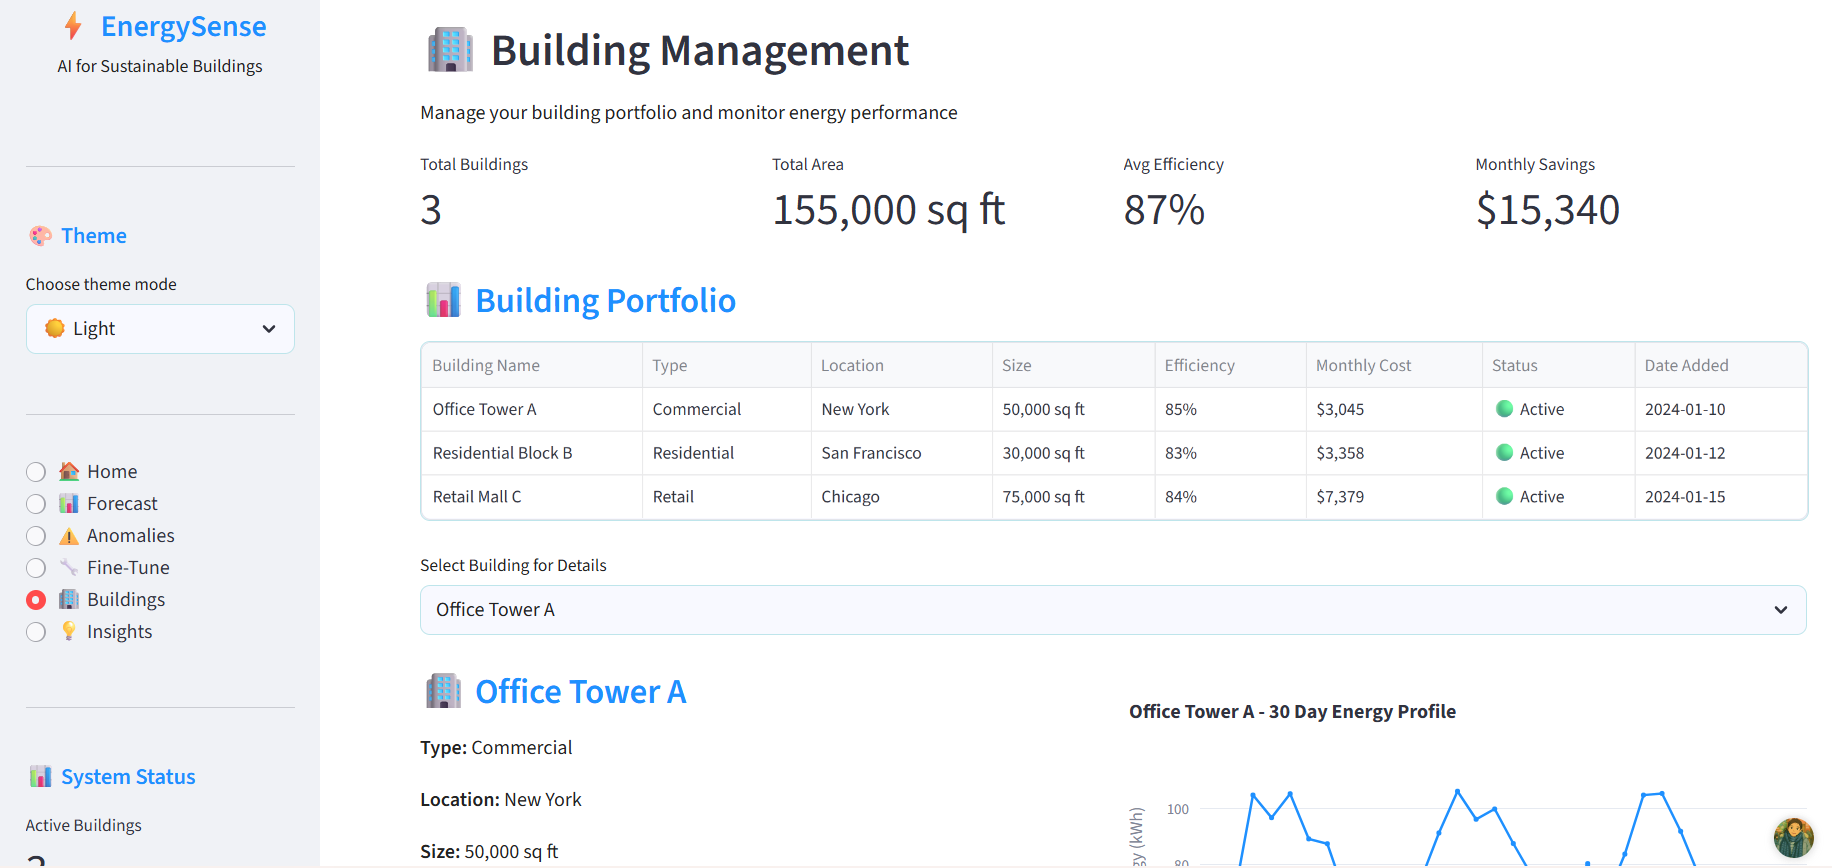
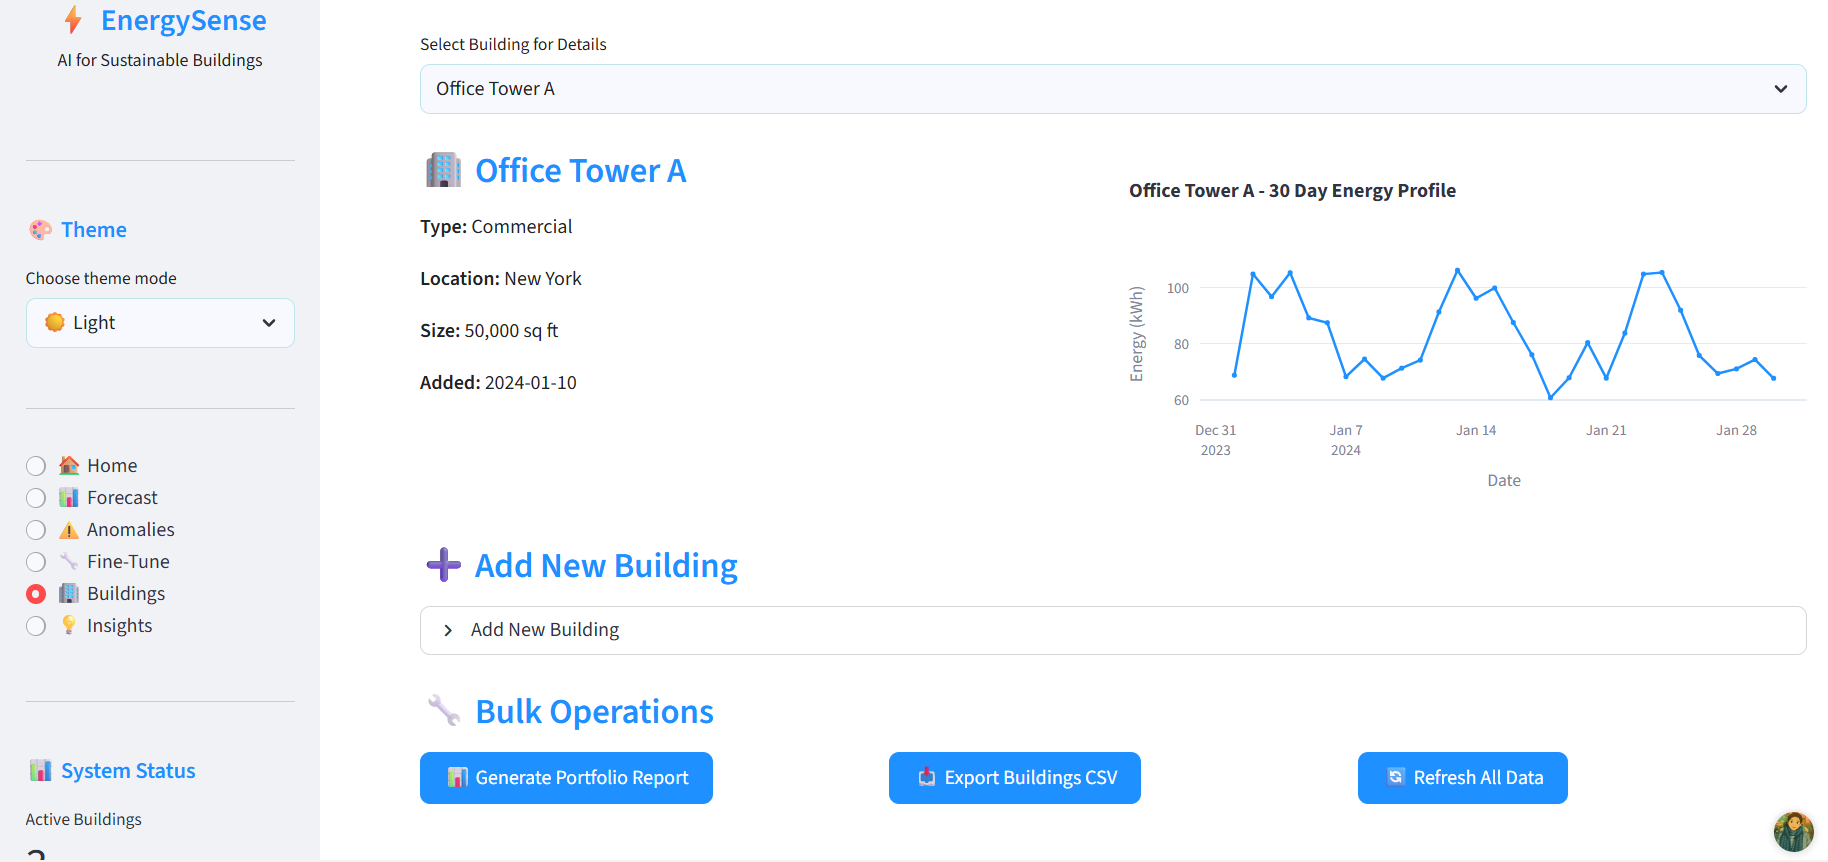
- 🏢 Building Manager: Track and manage multiple buildings with metadata (type, location, etc.).
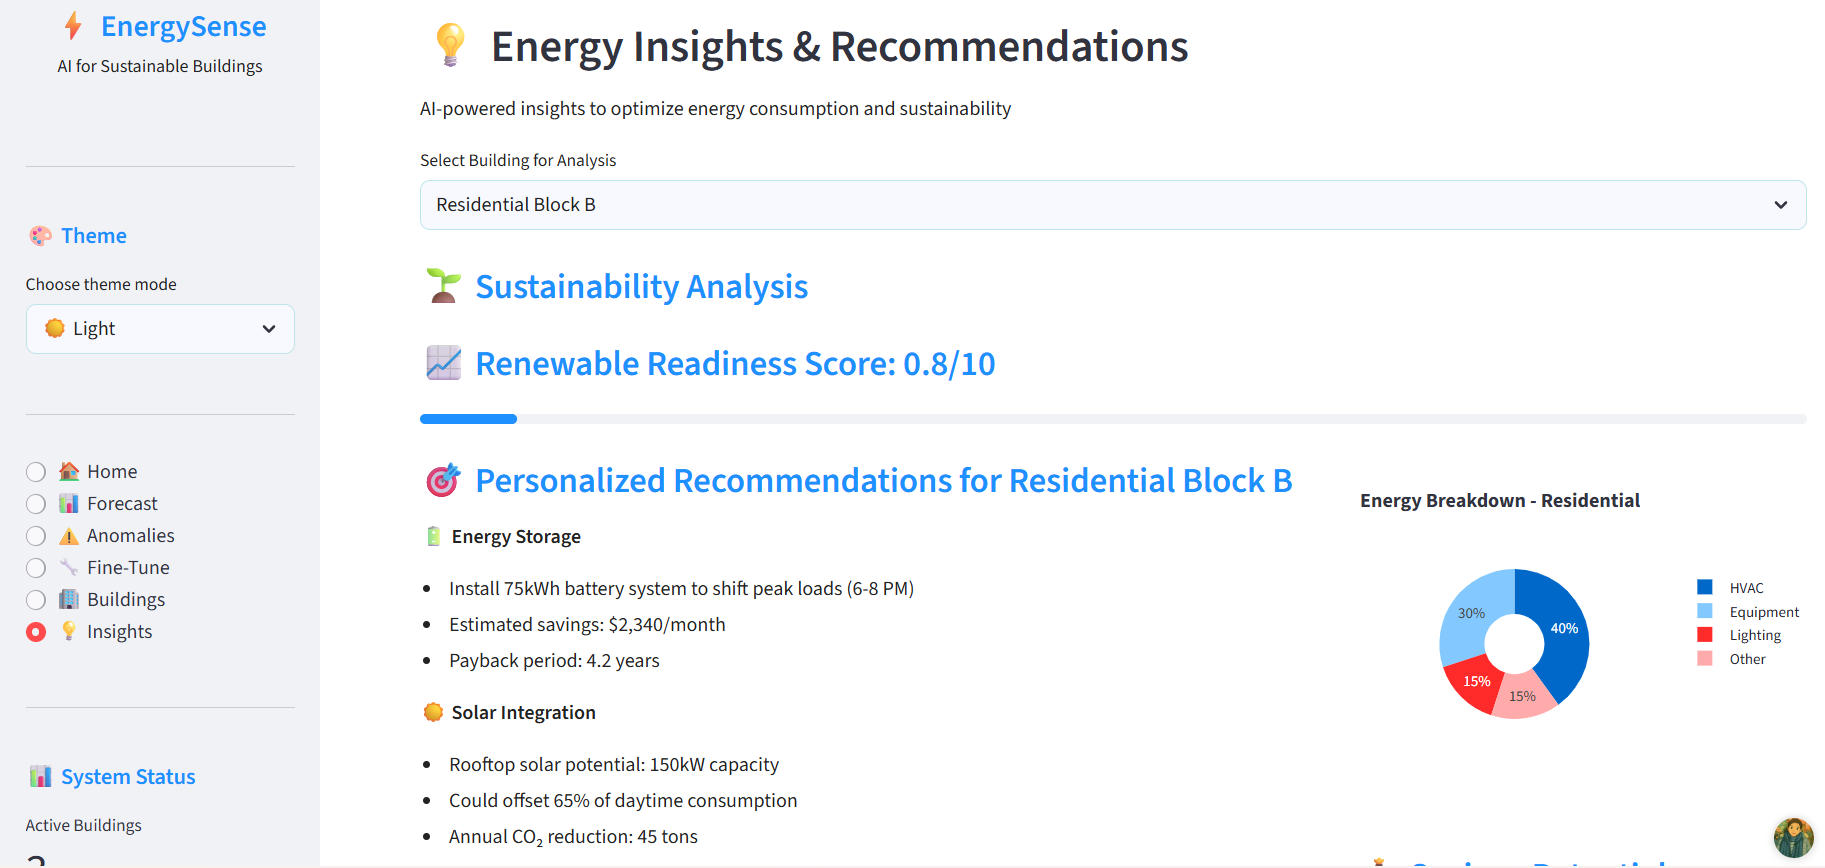
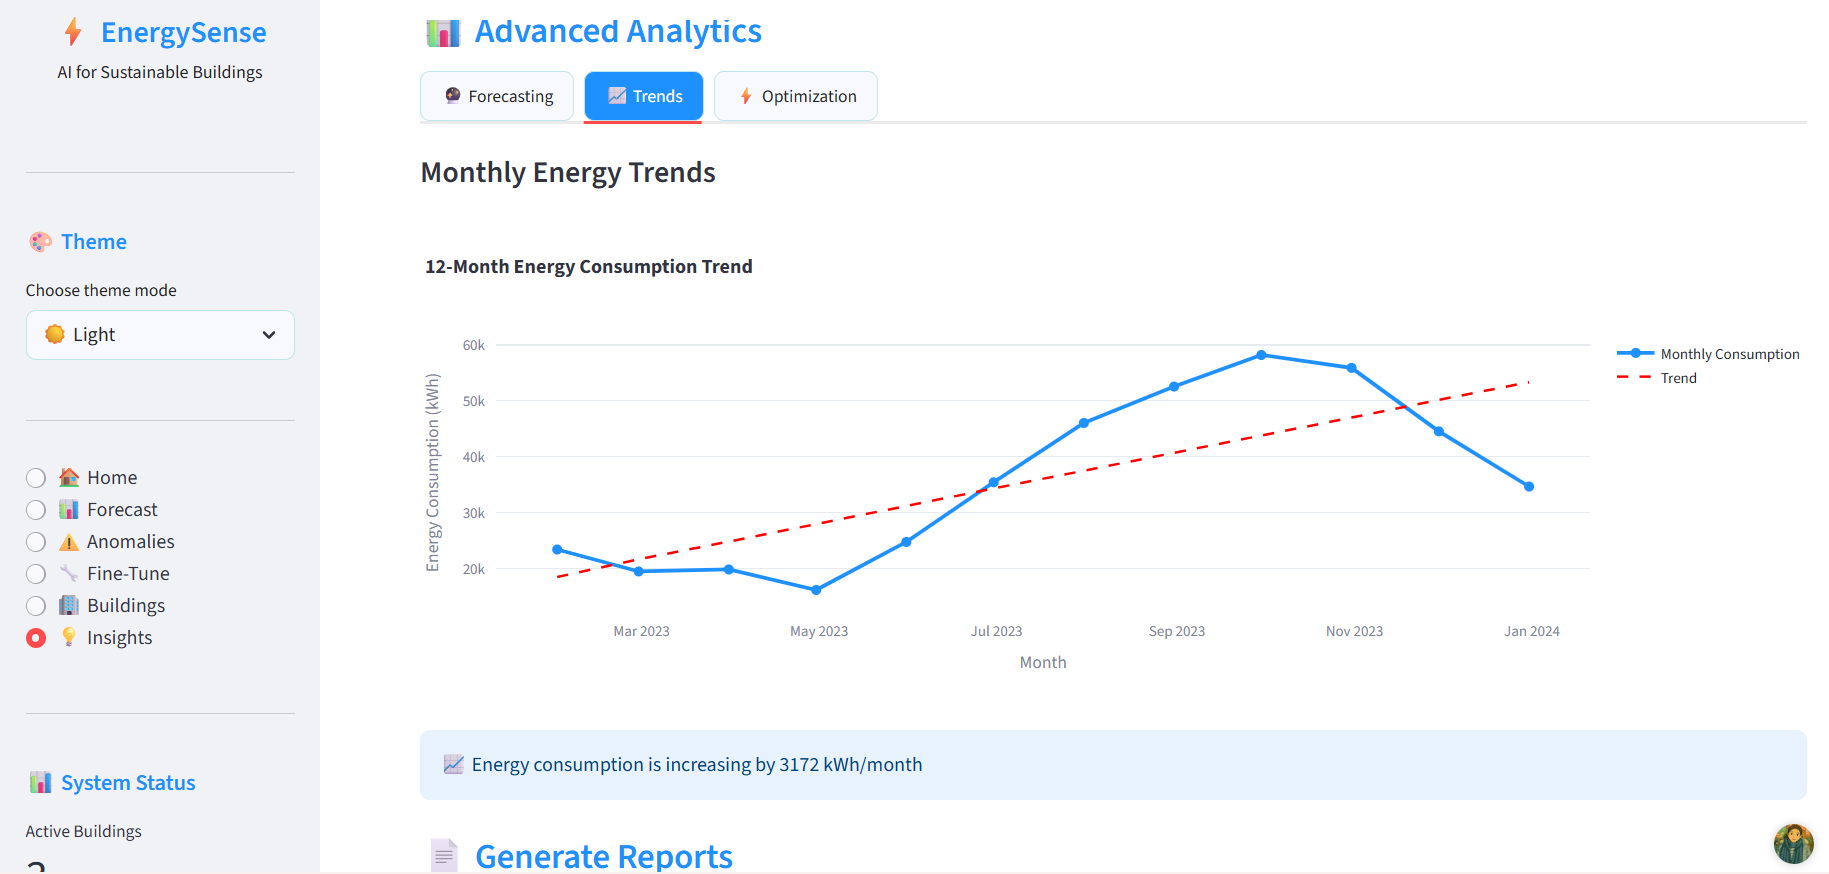
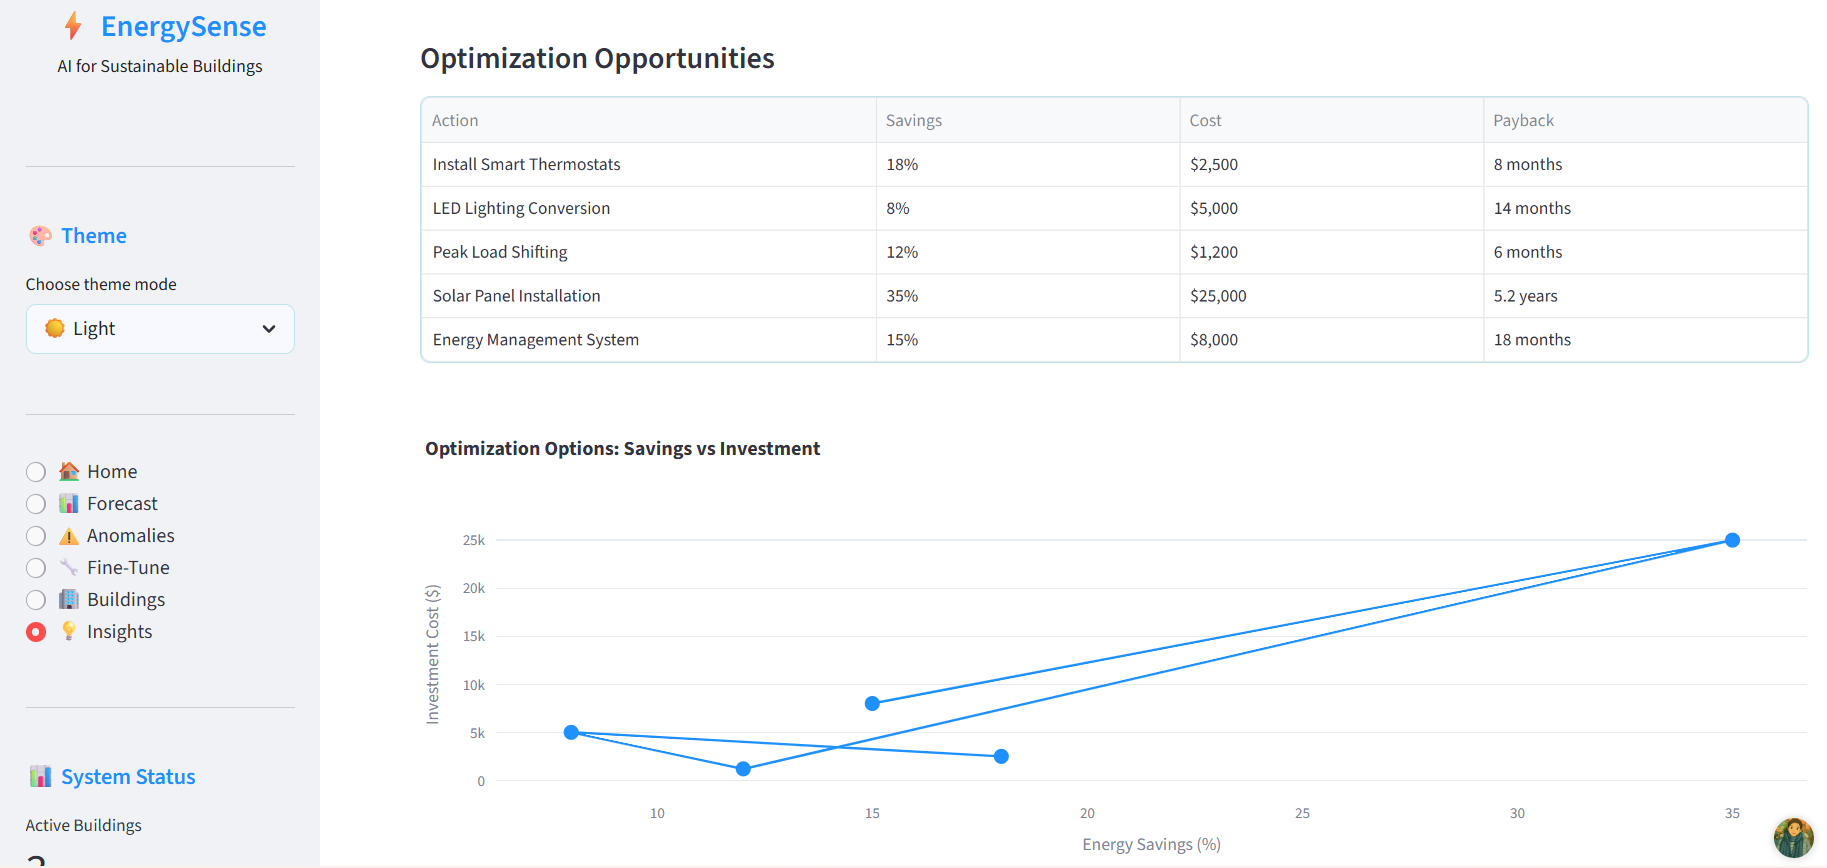
- 📊 Insights & Recommendations: Generates sustainability insights and a Renewable Readiness Score.
- 📄 PDF Report Generation: Exports a professional report summarizing forecasts, anomalies, and energy-saving tips.
The app runs entirely locally or in the cloud, making it ideal for energy managers, building operators, and sustainability teams.
🔧 How We Built It
We built EnergySense using a modern Python stack:
- Frontend: Streamlit for rapid UI development with interactive widgets and real-time visualizations.
- Visualization: Plotly for dynamic, hover-enabled time series charts.
- Core Logic:
- Simulated TSFM inference using realistic energy load patterns.
- Anomaly detection via z-score and residual-based methods.
- Fine-tuning simulation with progress tracking.
- Data Handling: Pandas for data manipulation, NumPy for numerical operations.
- Styling: Custom CSS embedded in Streamlit for a clean, professional look.
- Architecture: Modular design with session state for persistent data (e.g., building list).
The app is self-contained in a single app.py file for easy deployment, but follows best practices for scalability.
⚠️ Challenges We Ran Into
- Deprecated Streamlit Parameters: We encountered warnings like
use_column_widthbeing deprecated — we fixed this by switching touse_container_width. - List vs. Array
.tolist()Error: A critical bug occurred when trying to call.tolist()on a Python list instead of a NumPy array in confidence interval plotting — resolved by proper type handling. - Realistic Data Simulation: Generating synthetic but realistic energy data with daily/weekly patterns and anomalies required careful modeling of seasonality and noise.
- Session State Management: Ensuring the building list updates in real-time after adding a new entry required proper use of
st.session_state. - File Upload & Parsing: Handling CSV uploads with error checks for required columns (
timestamp,energy_kW) was essential for robustness.
🏆 Accomplishments We're Proud Of
- ✅ Built a fully functional prototype with realistic forecasting and anomaly detection.
- ✅ Implemented interactive visualizations that clearly show historical data, forecasts, and anomalies.
- ✅ Designed a clean, user-friendly UI with a responsive sidebar, metrics, and navigation.
- ✅ Achieved zero-shot inference simulation using pre-trained model logic.
- ✅ Added PDF report generation (simulated) for real-world usability.
- ✅ Made the app easy to deploy with minimal dependencies.
We’re proud that EnergySense is not just a demo — it’s a working tool that could be extended into a production-grade energy analytics platform.
📚 What We Learned
- TSFMs are powerful: Foundation models can generalize across buildings, reducing the need for per-building training.
- Streamlit is fast for prototyping: With session state and Plotly, you can build rich dashboards in hours.
- Data quality matters: Even simulated data must reflect real-world patterns (e.g., peak hours, weekends).
- User experience is key: Clear visuals, feedback messages, and intuitive navigation make AI tools accessible.
- Anomalies aren’t just outliers: Context (time of day, occupancy) is crucial — simple z-scores are a start, but more advanced models (e.g., autoencoders) can help.
🚀 What's Next for EnergySense
- Integrate Real TSFMs: Load actual pre-trained models (e.g., from Hugging Face) like
TSMixer-Zero. - Add Weather & Occupancy Features: Improve forecasts with external variables.
- Deploy as a Cloud App: Use Streamlit Community Cloud or Docker for team access.
- Connect to Real Data Sources: Integrate with APIs from smart meters or BMS (Building Management Systems).
- Advanced Anomaly Detection: Use autoencoders or Isolation Forests for better accuracy.
- Automated Alerts: Send email/SMS notifications for critical anomalies.
- Carbon Intensity Overlay: Show grid emissions to promote clean energy usage.
- Multi-Building Comparison: Benchmark performance across a portfolio.
EnergySense is just the beginning — we envision it evolving into a central platform for sustainable building operations worldwide.


Log in or sign up for Devpost to join the conversation.