-
-
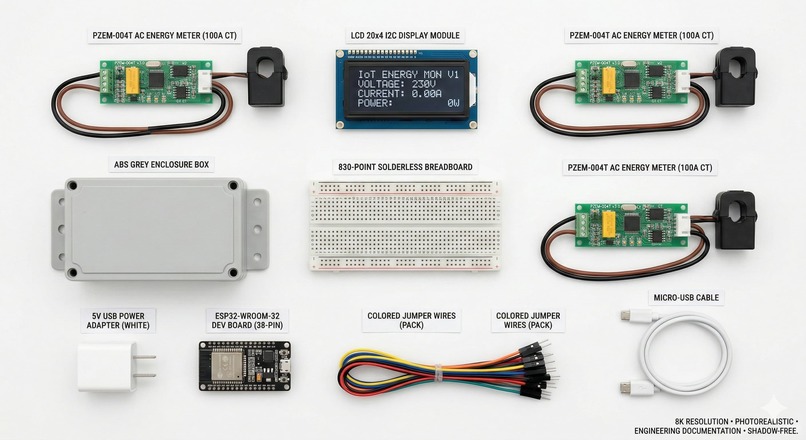
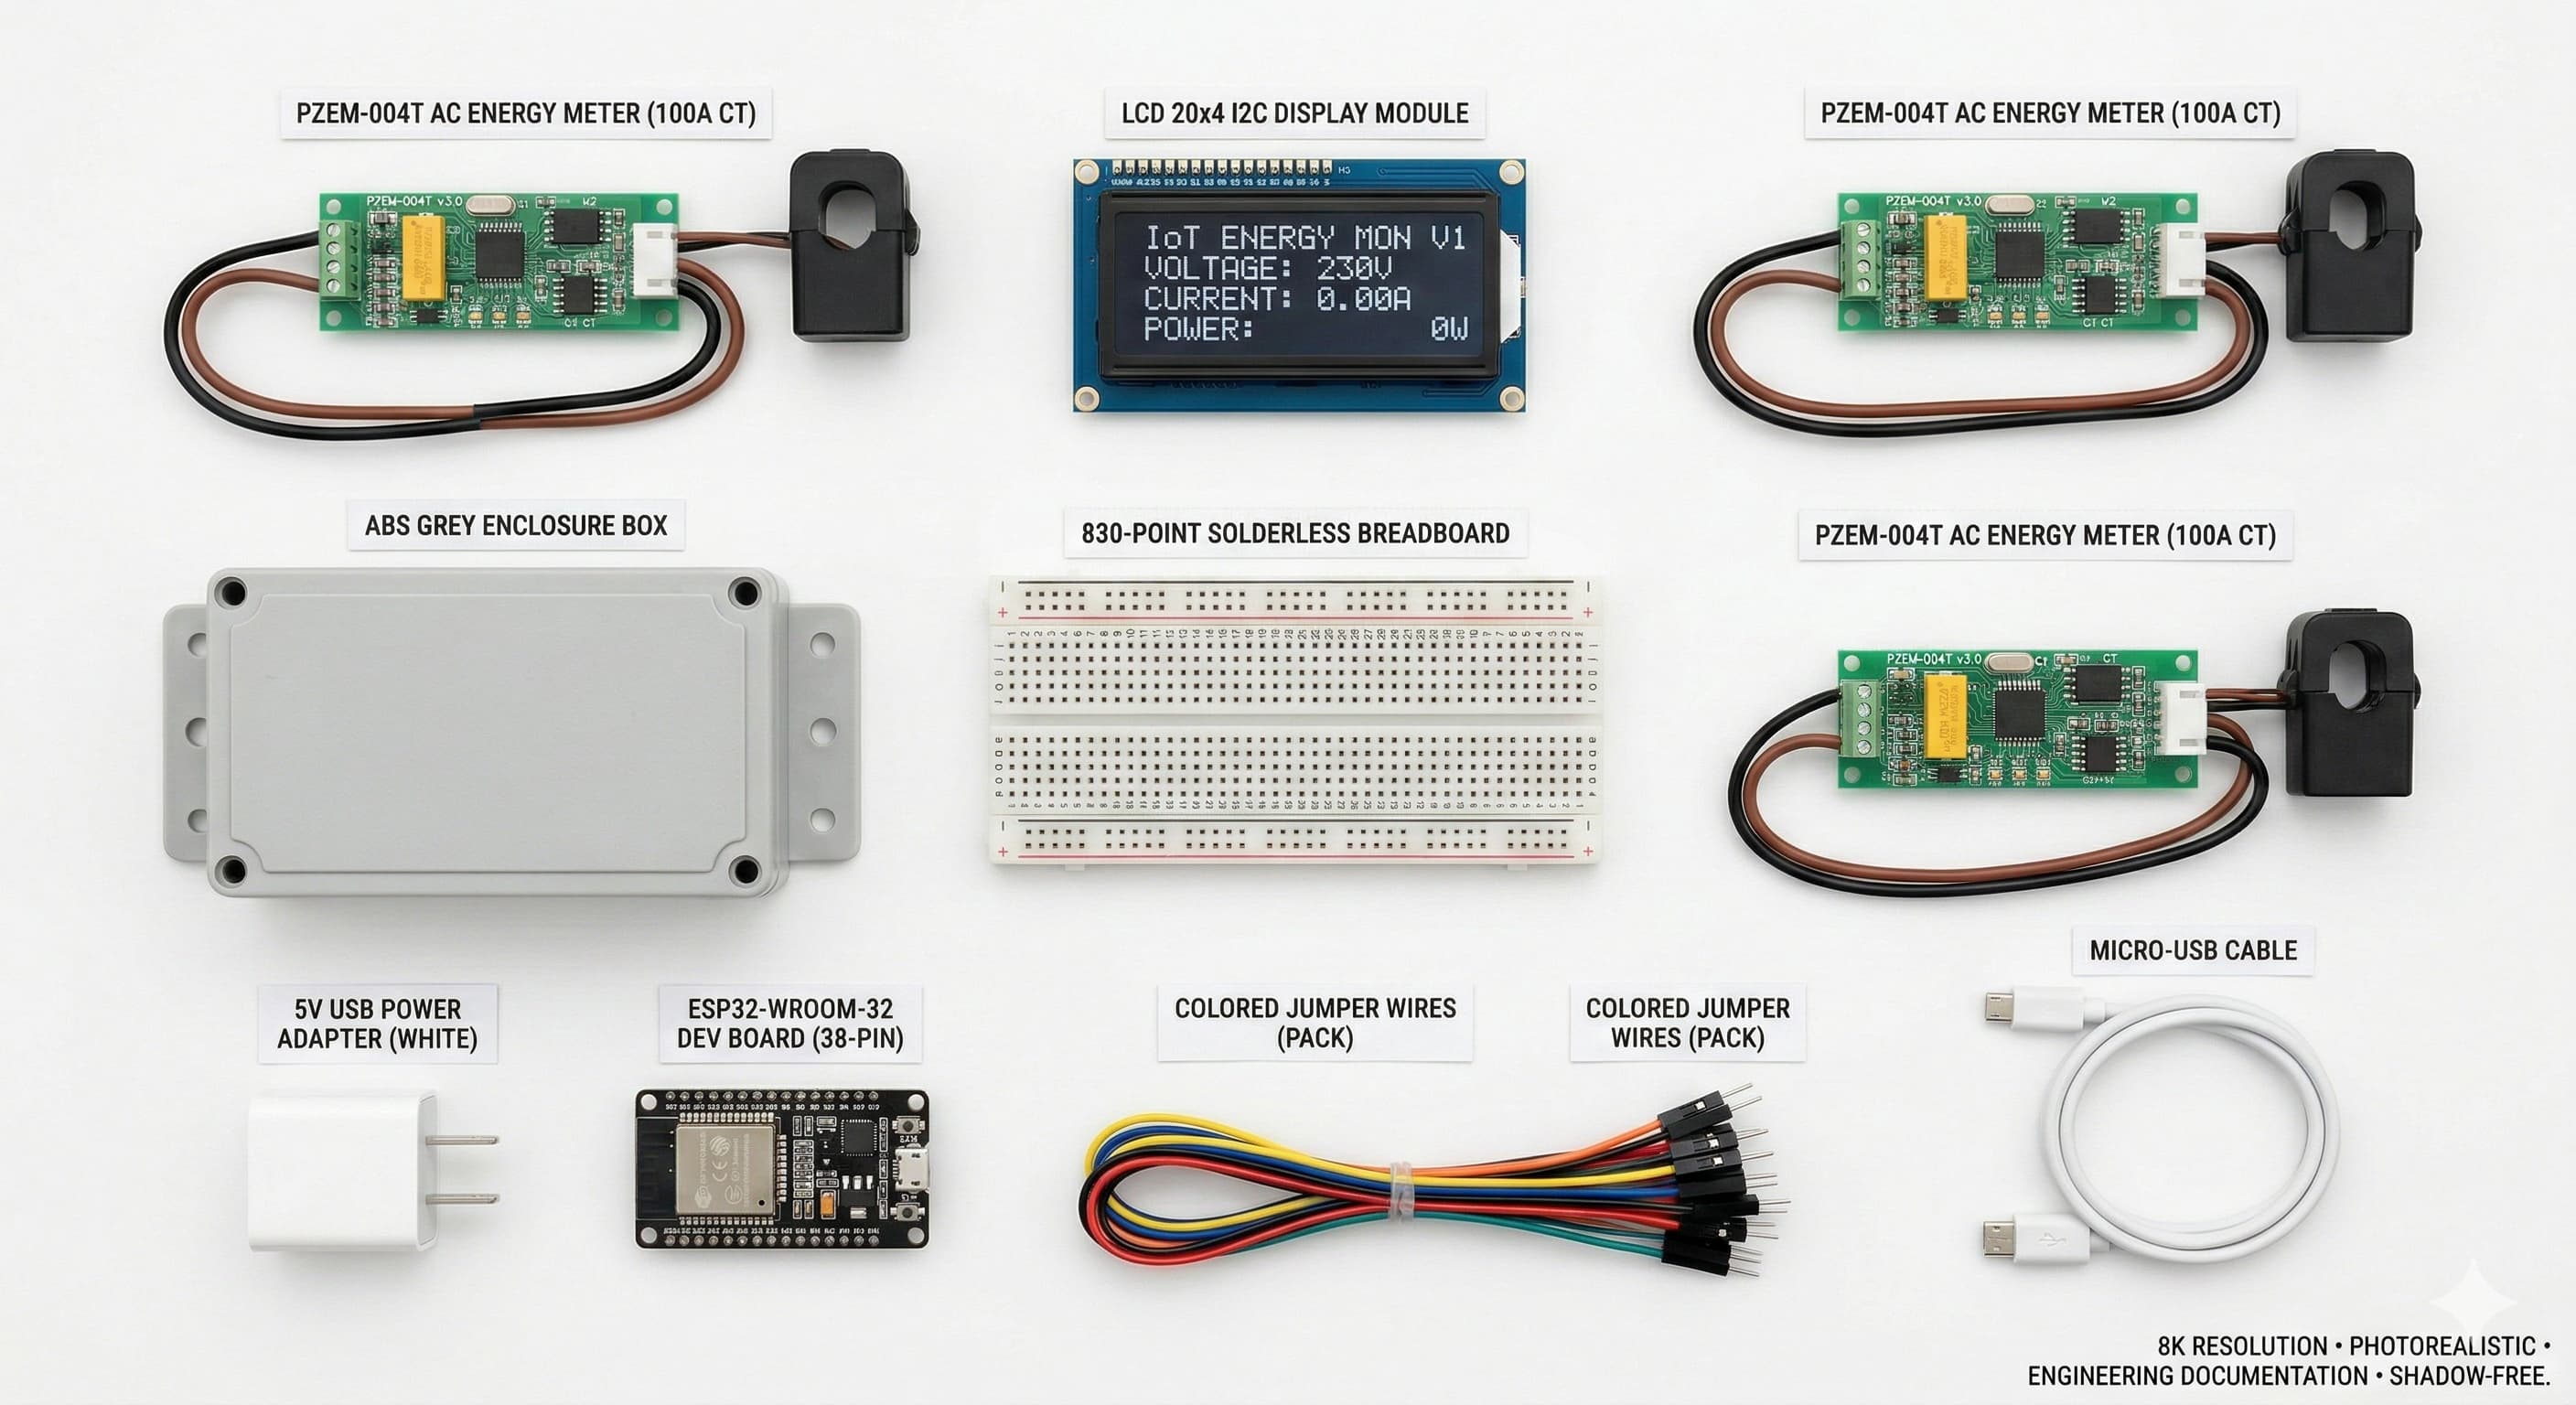
Full kit: ESP32-WROOM-32U, 3x PZEM-004T v3.0, 3x 100A split-core CT clamps, 20x4 I2C LCD and 5V/3A power supply
-
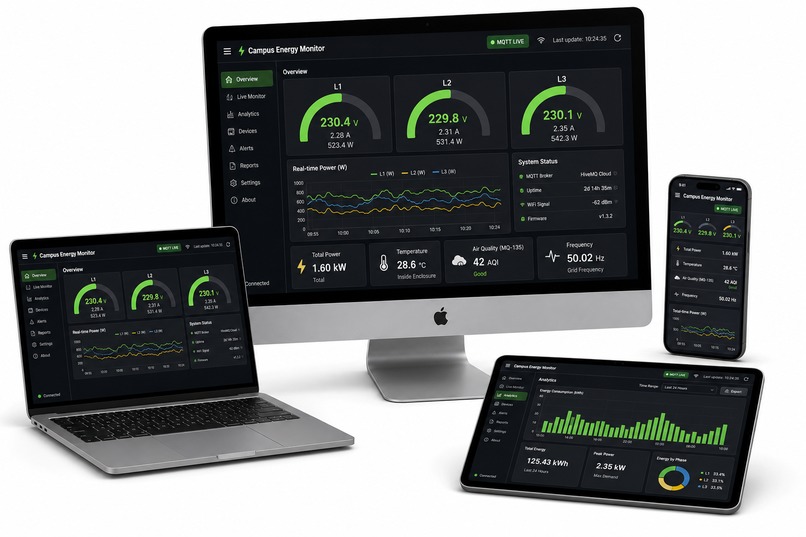
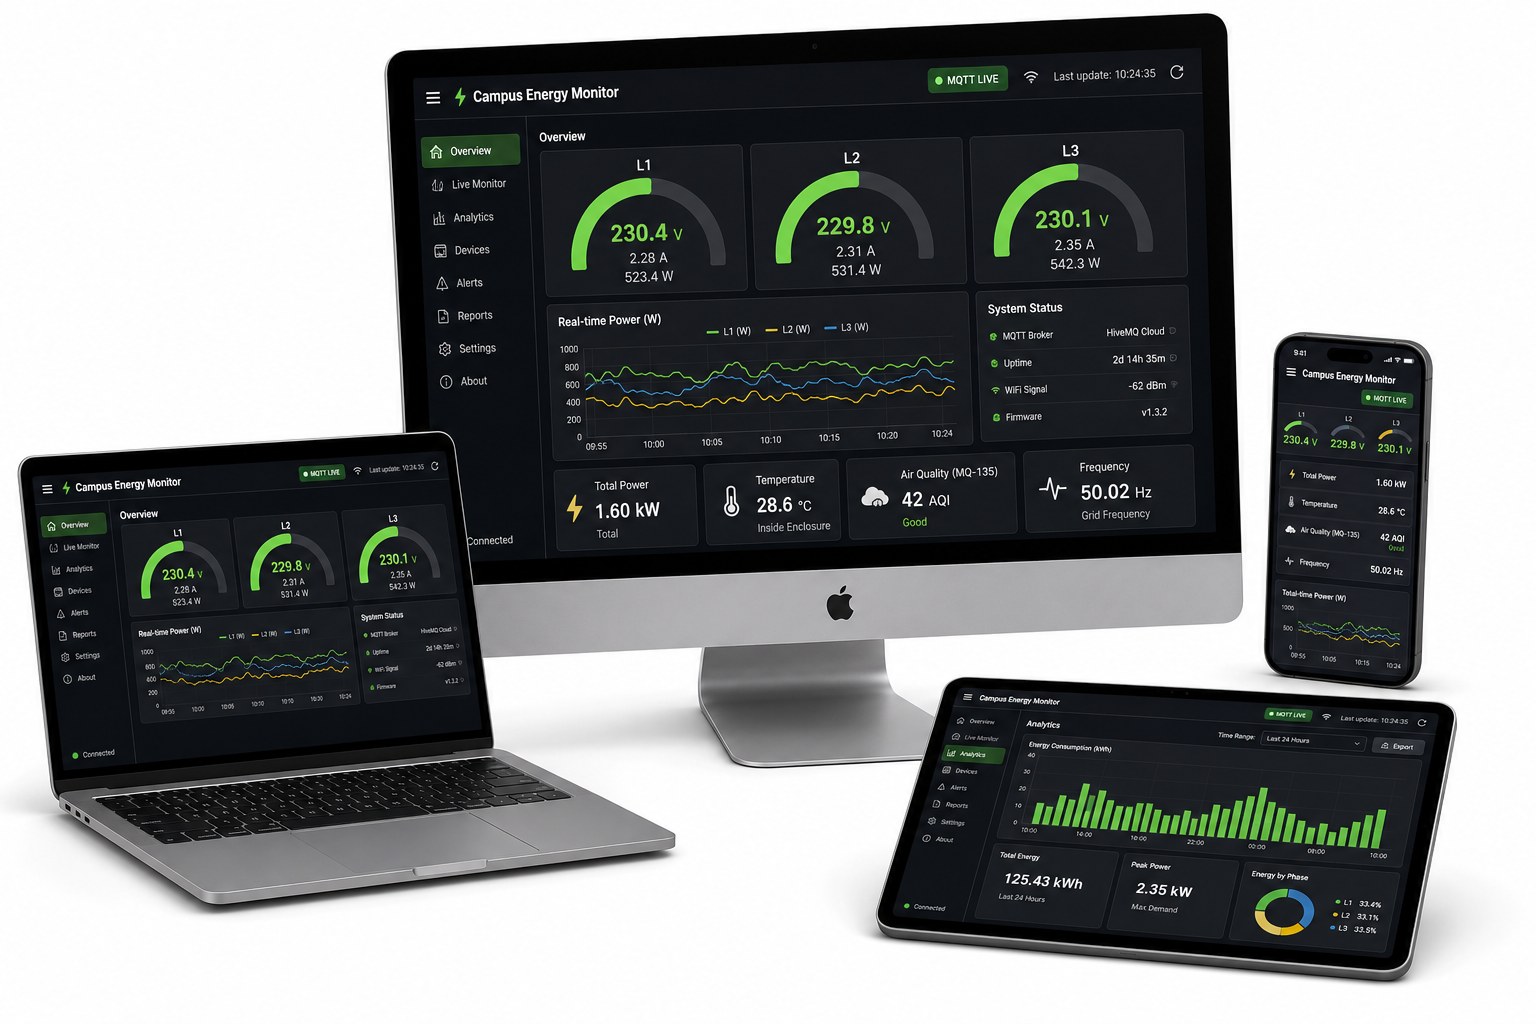
Live 3-phase energy dashboard across devices - real-time voltage, current, power factor and kWh via MQTT WebSocket
-
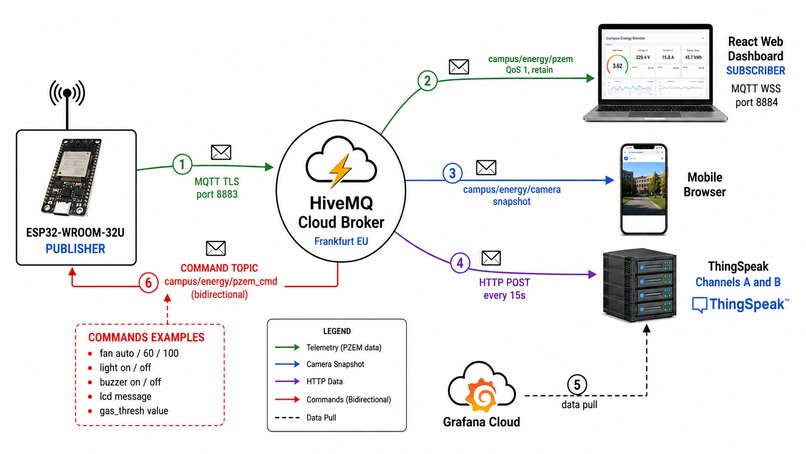
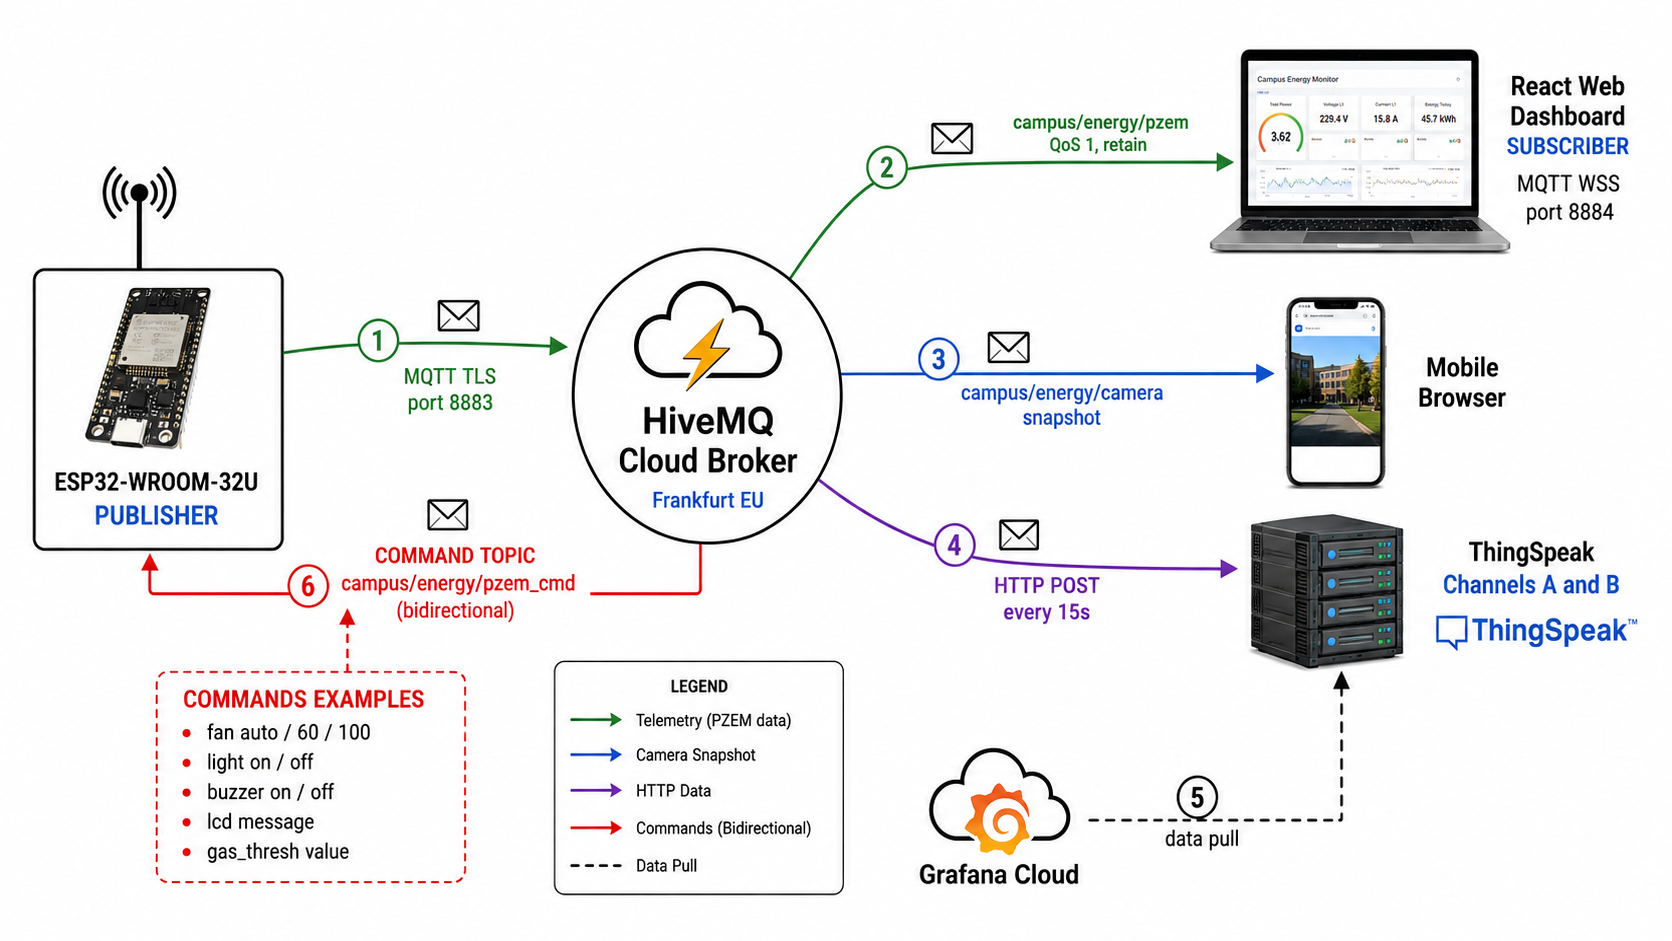
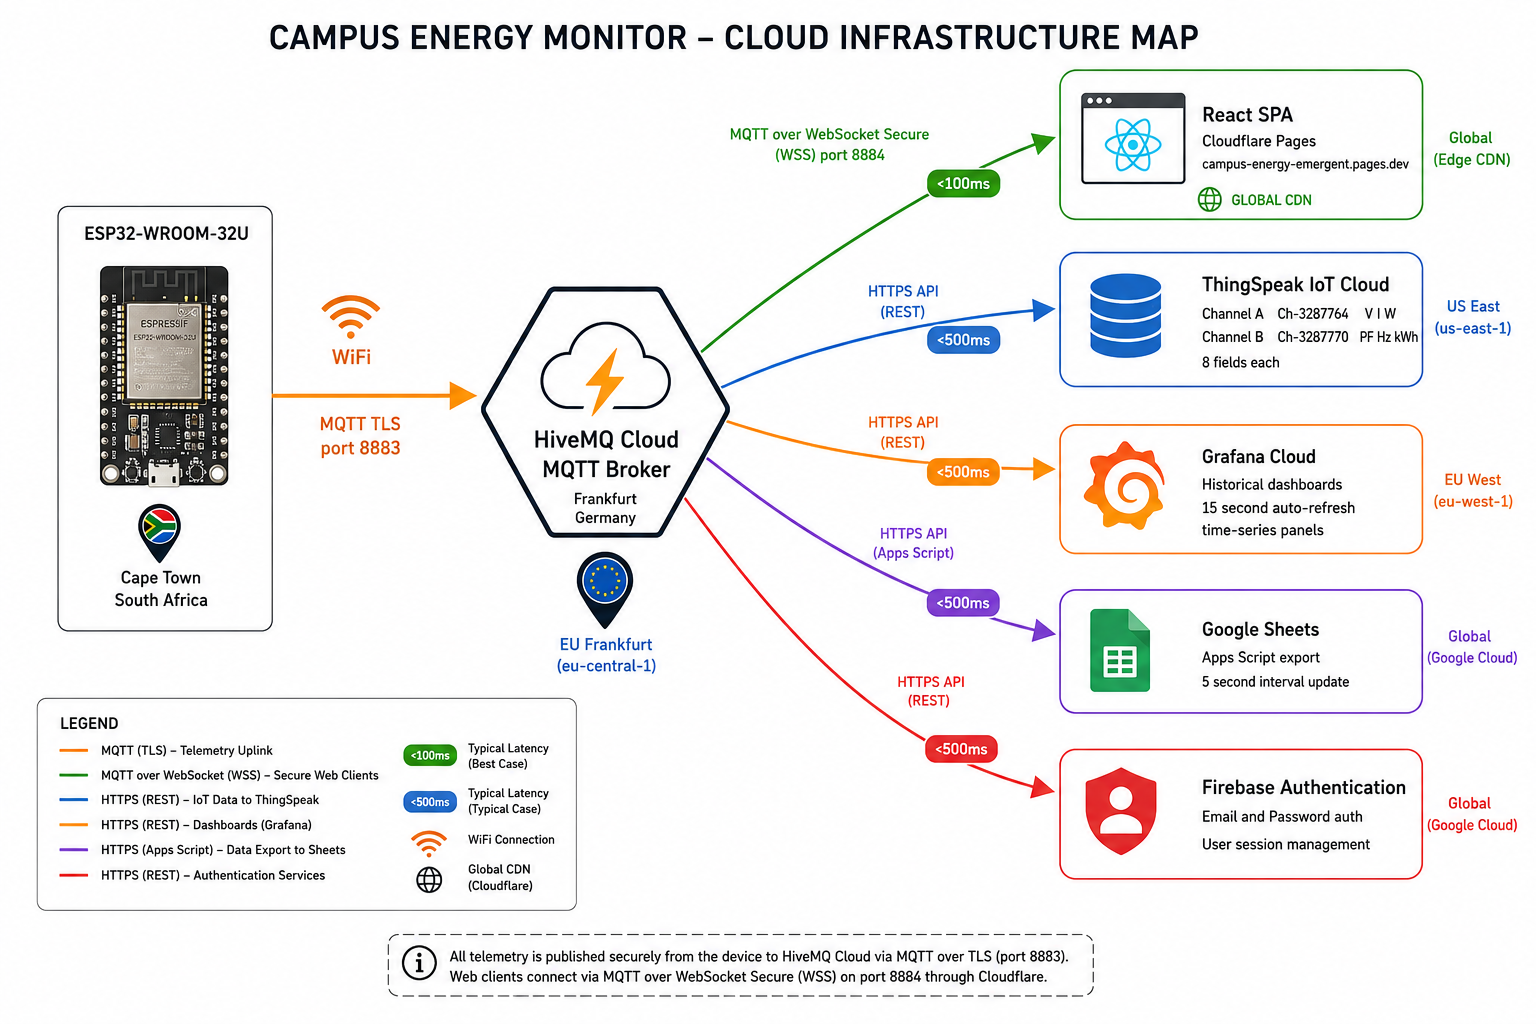
Data pipeline: ESP32 Modbus RTU to HiveMQ Cloud MQTT TLS, then to ThingSpeak, Grafana Cloud and Google Sheets
-
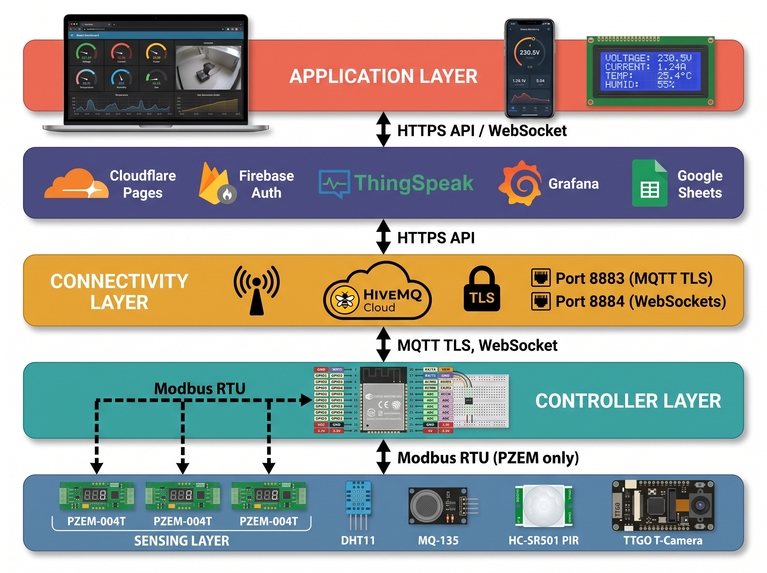
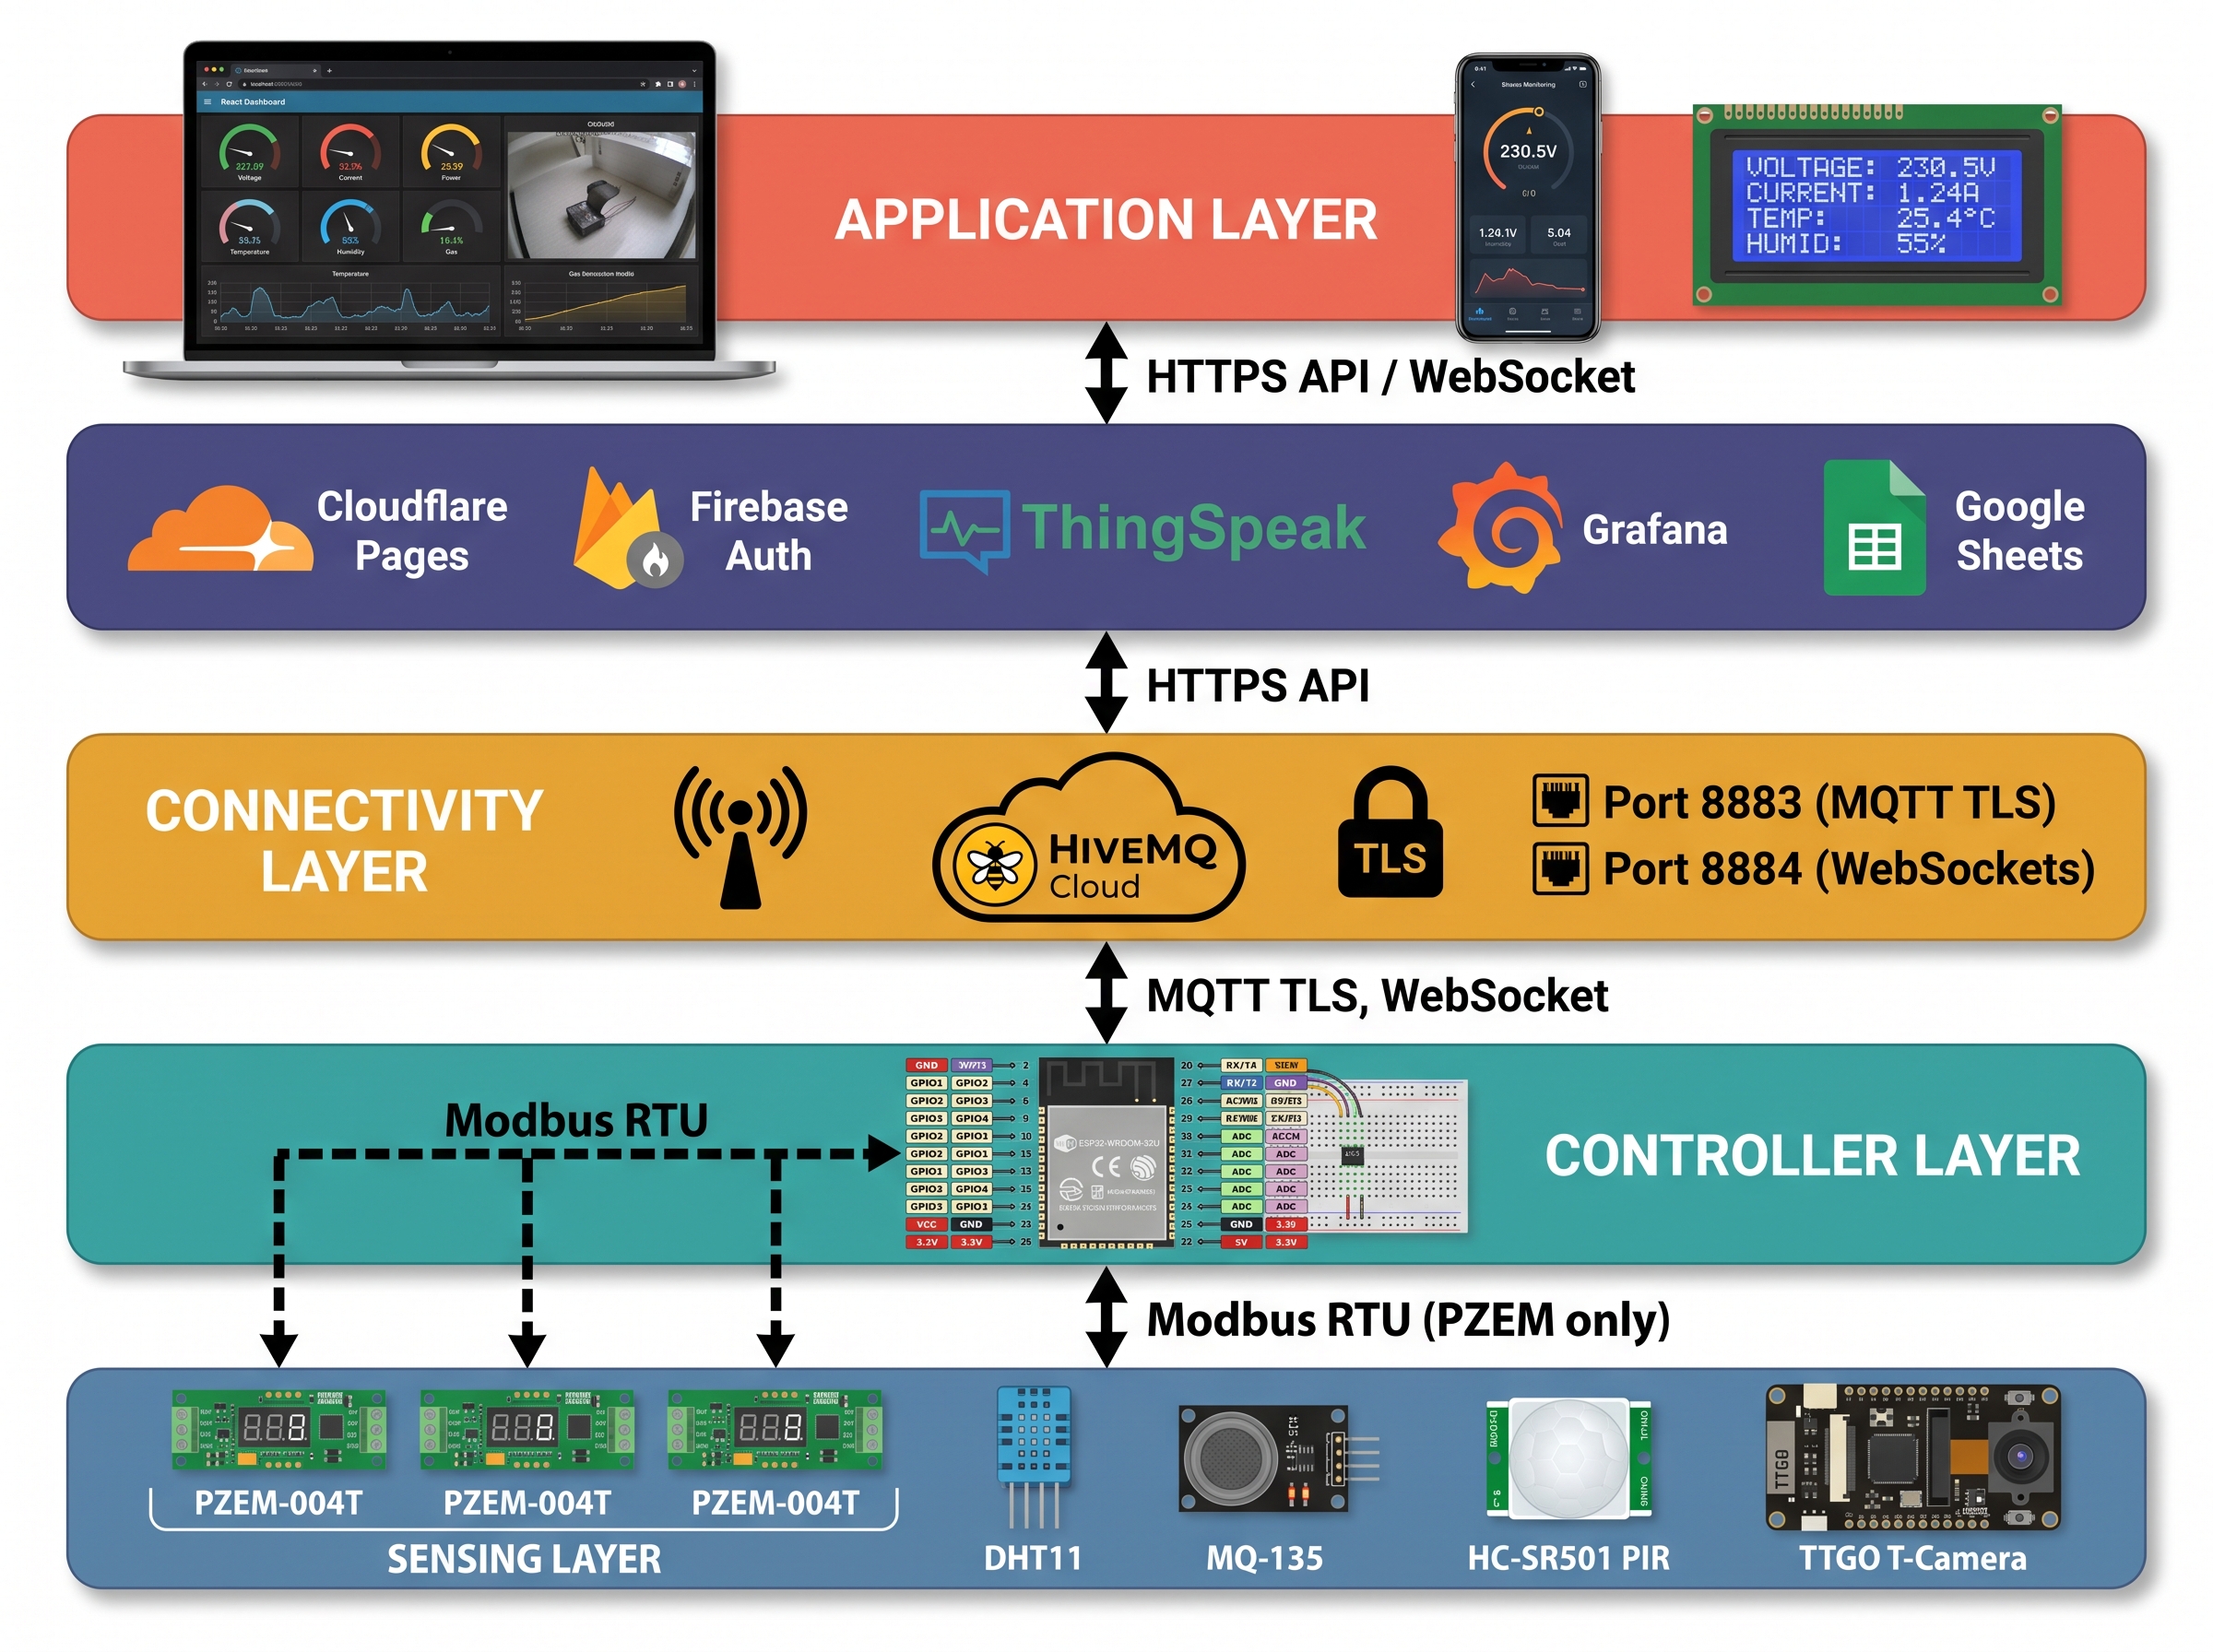
Five IoT layers: PZEM-004T sensing, ESP32 controller, HiveMQ MQTT connectivity, cloud analytics and React dashboard
-
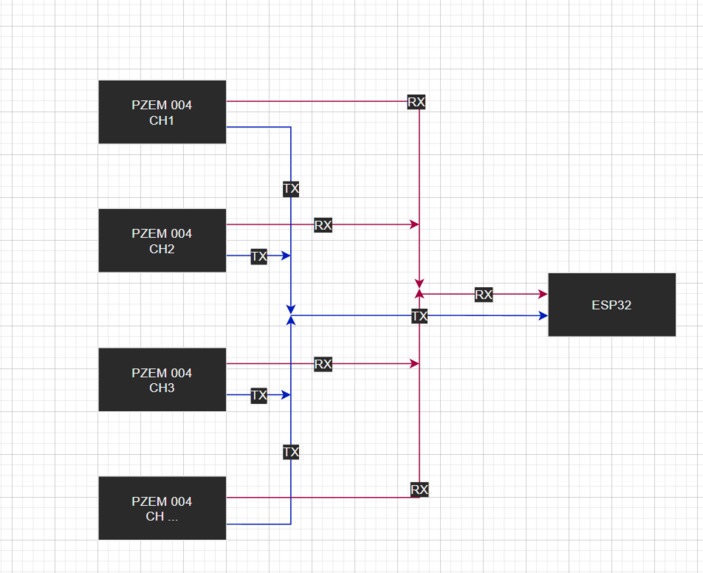
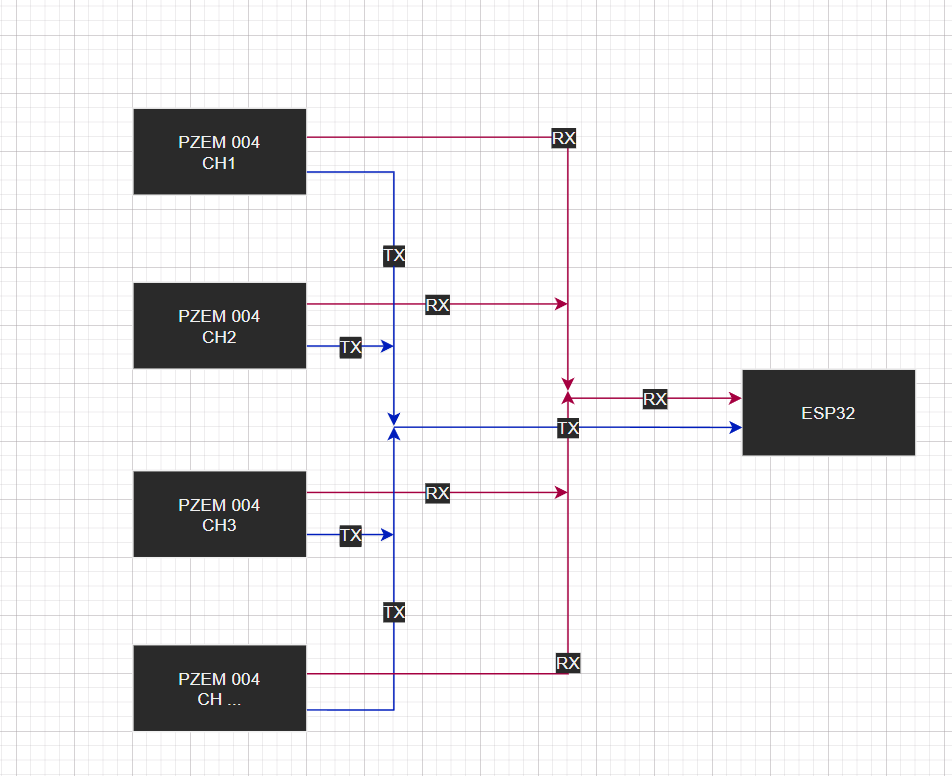
RS485 Modbus RTU connecting three PZEM-004T meters to the ESP32 master, with MQTT uplink and dual ThingSpeak channels
-
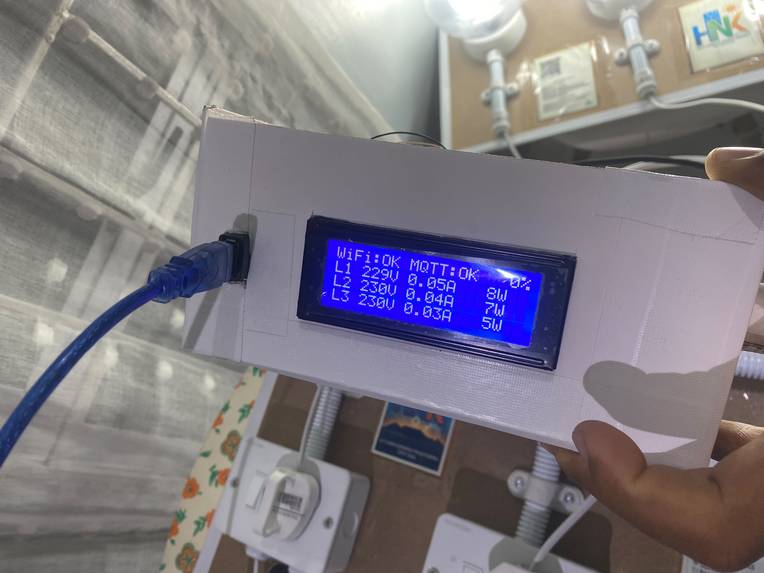
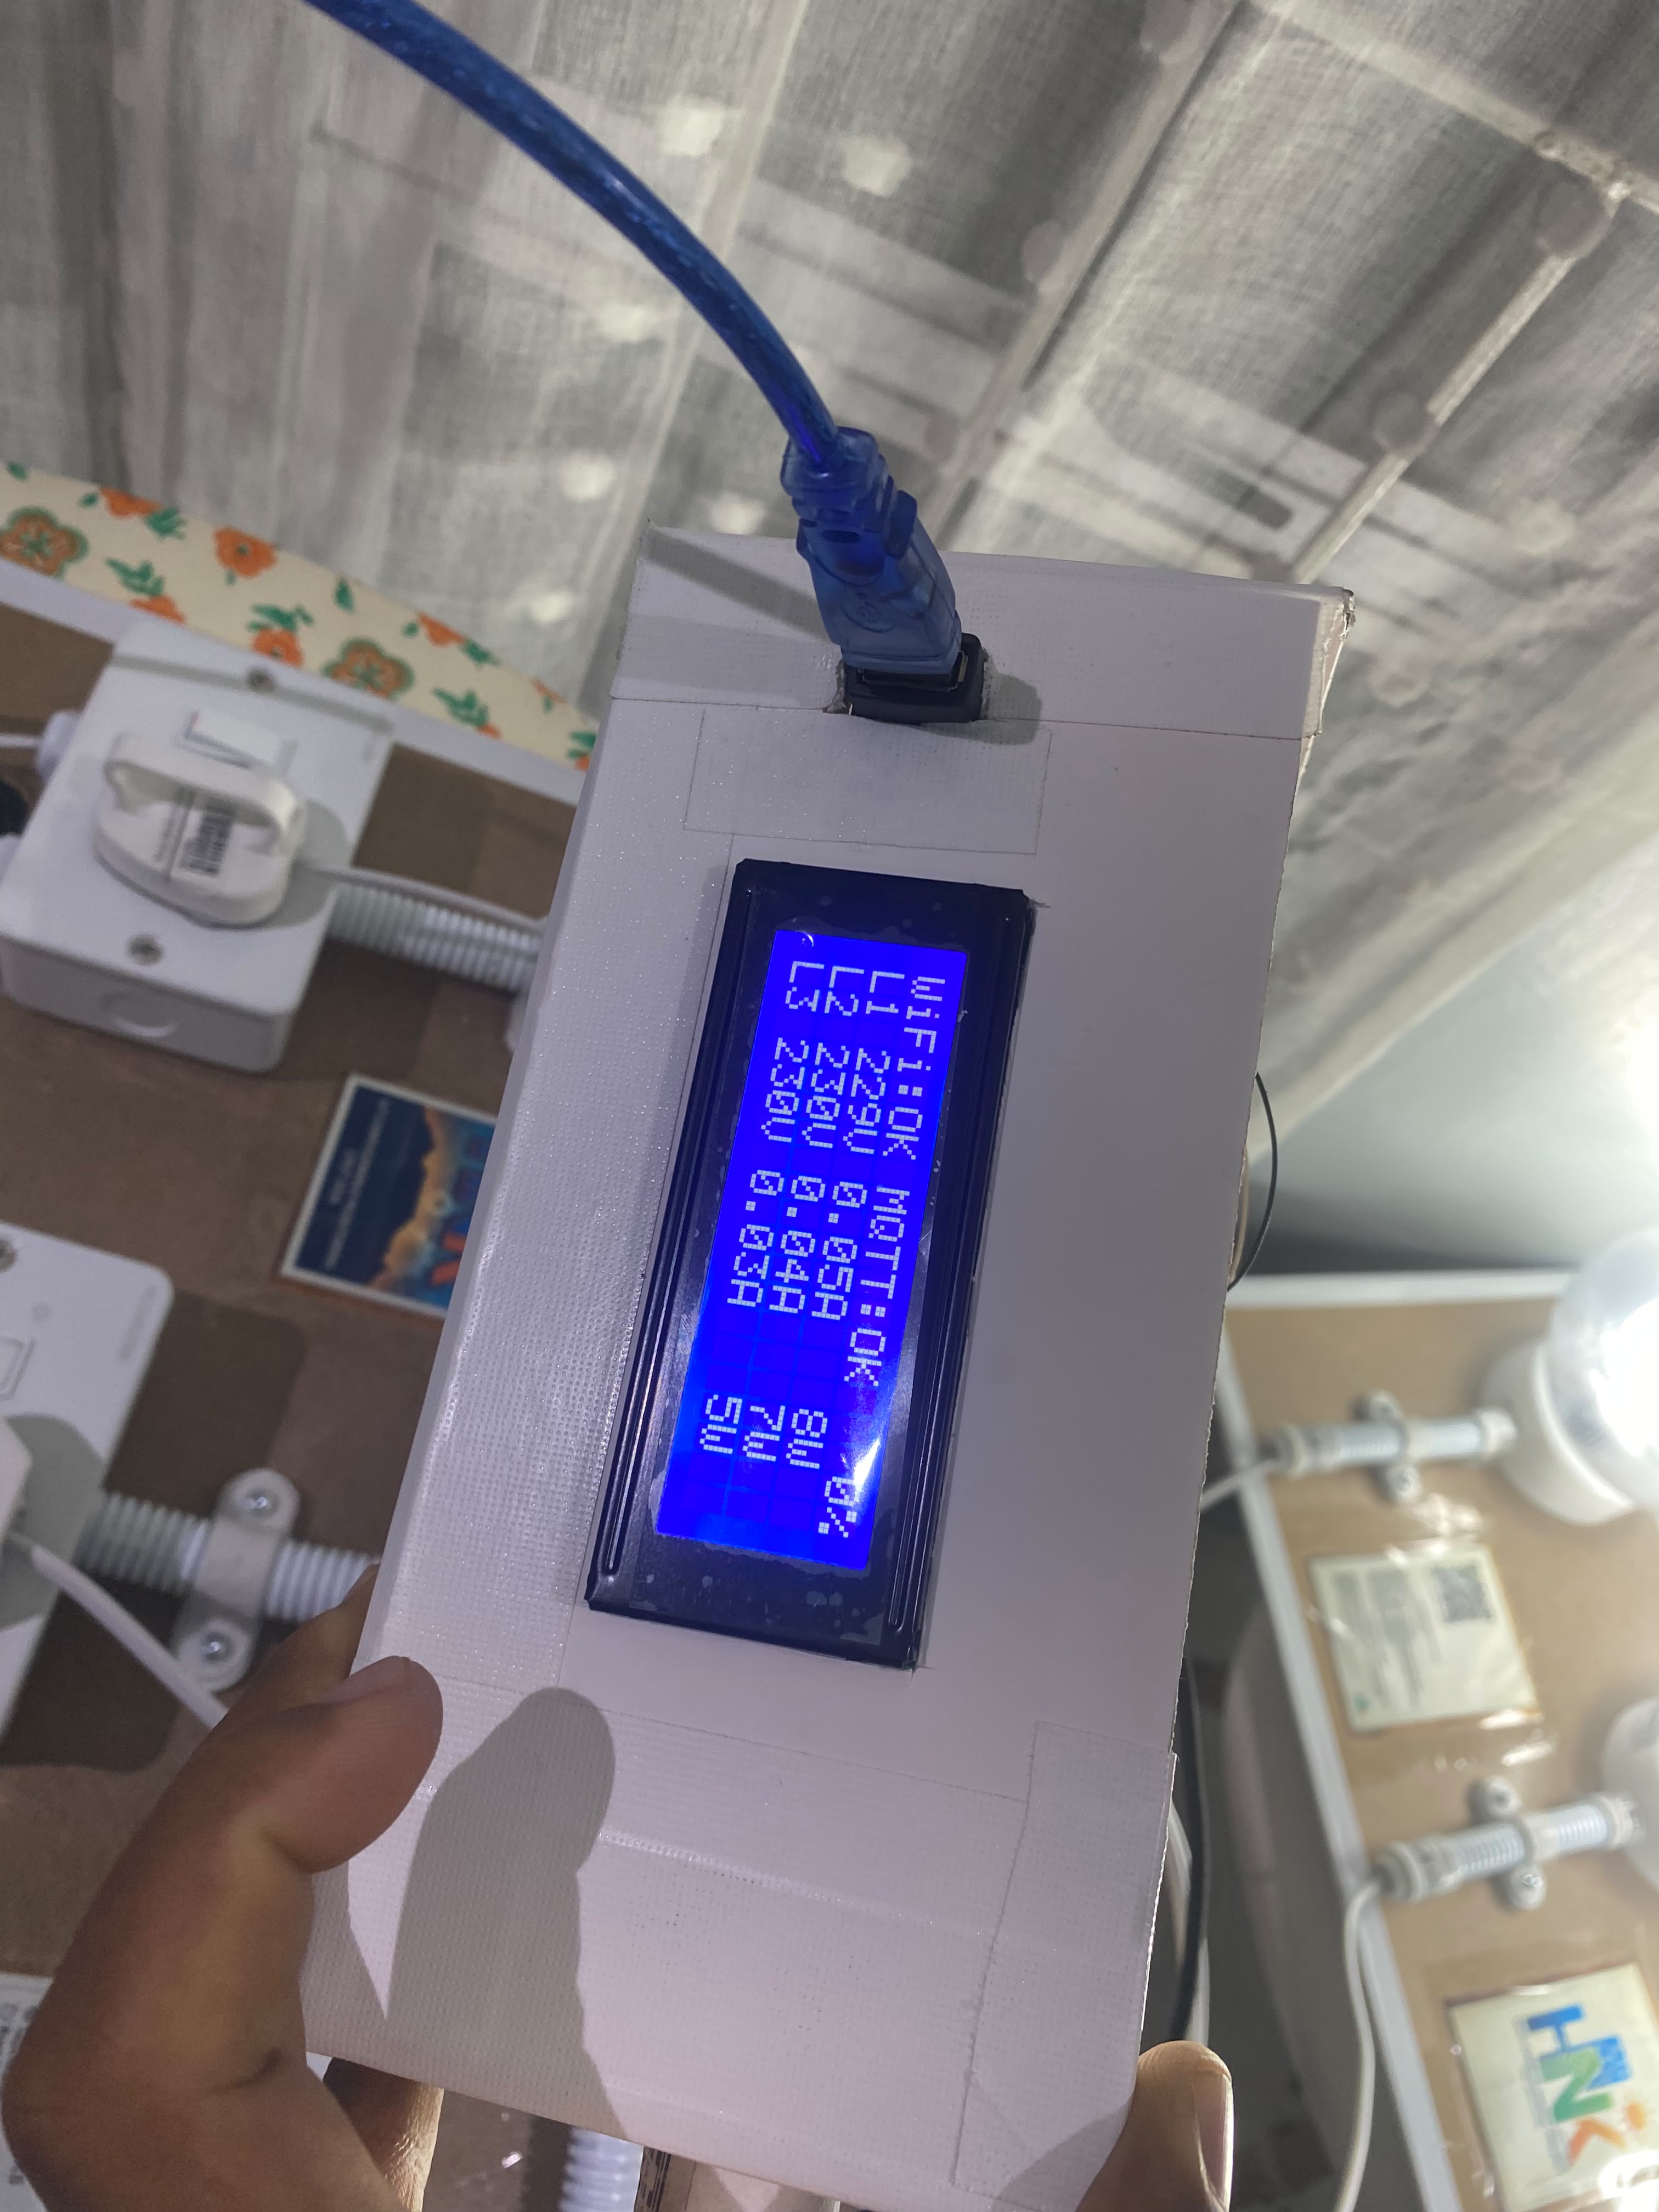
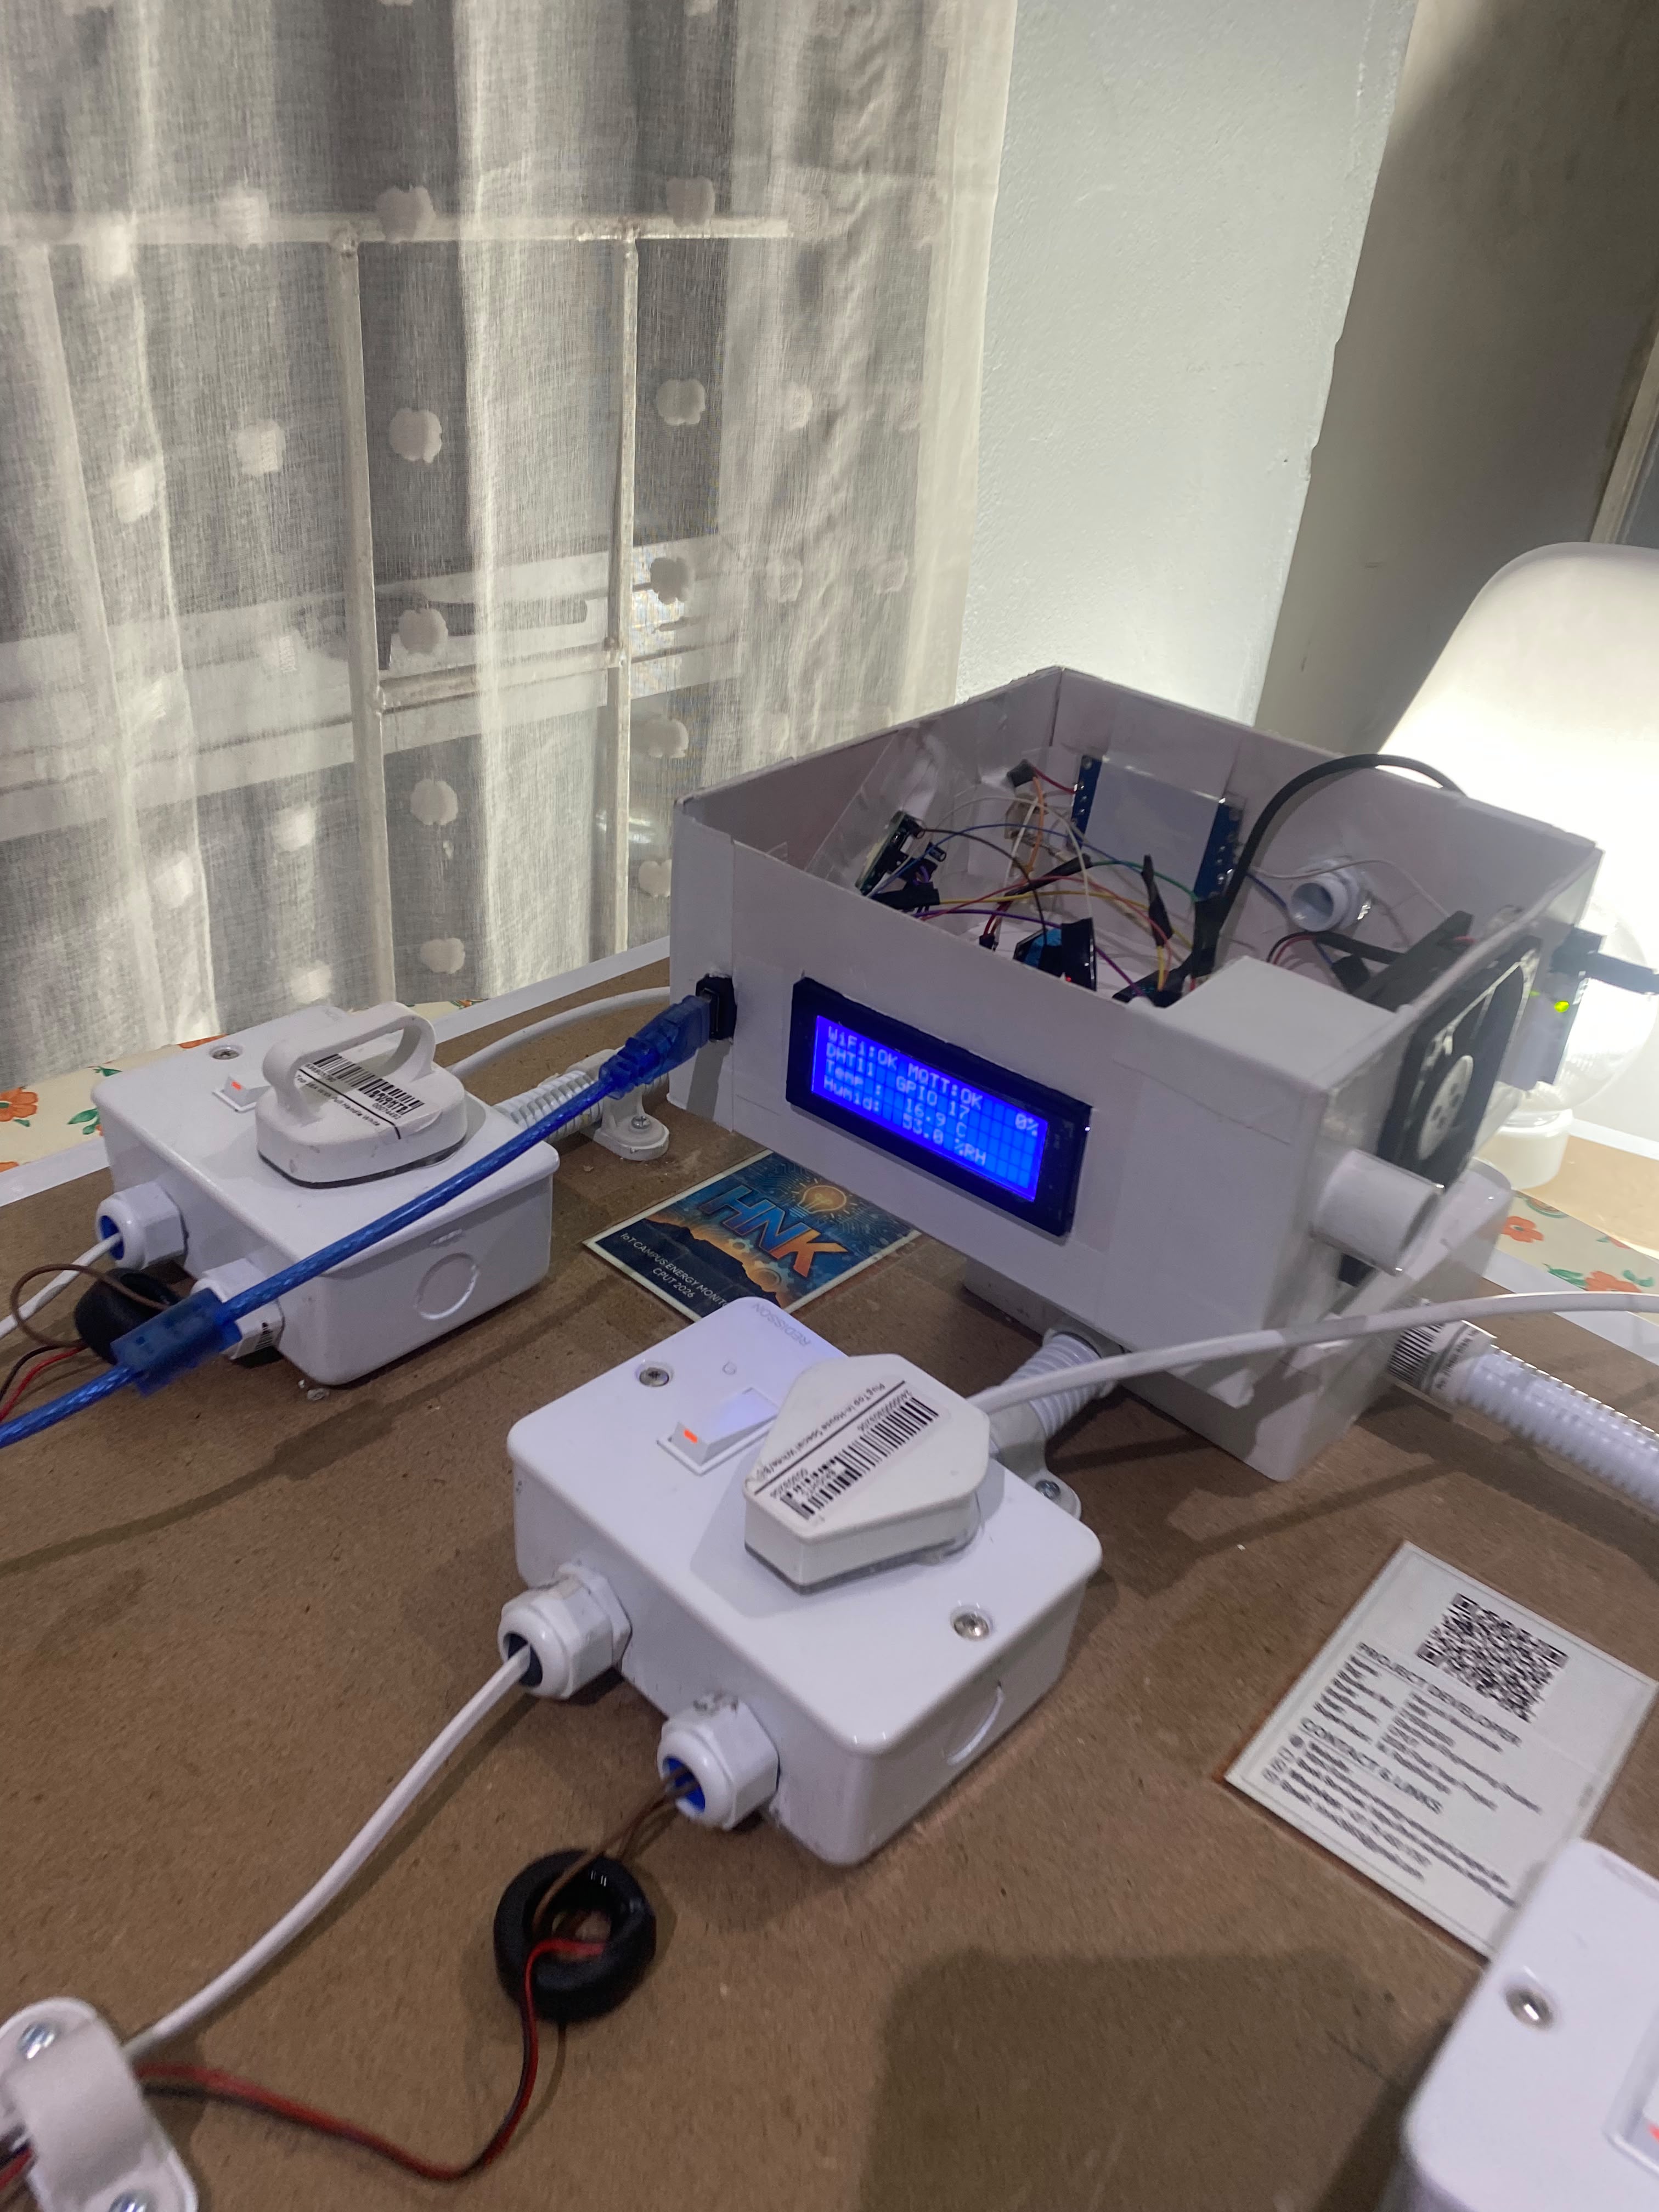
20x4 I2C LCD showing live WiFi:OK, MQTT:OK, L1/L2/L3 frequency at 50.1Hz and individual phase power factors
-
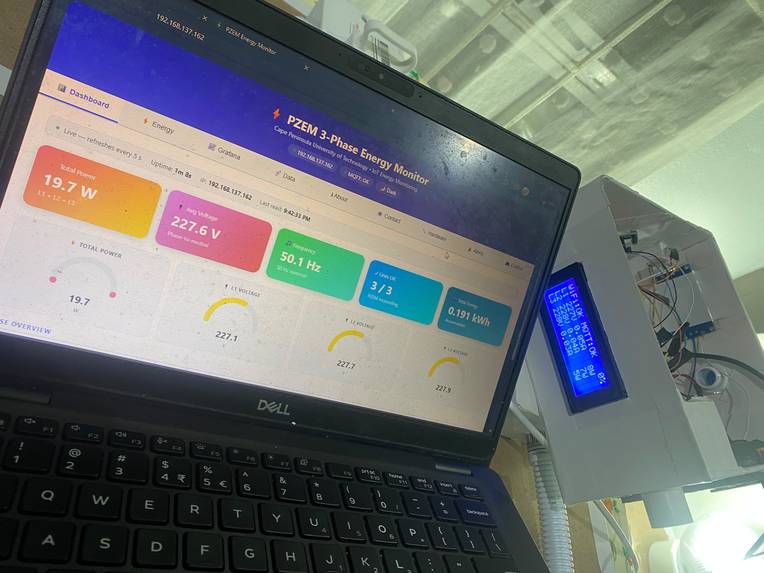
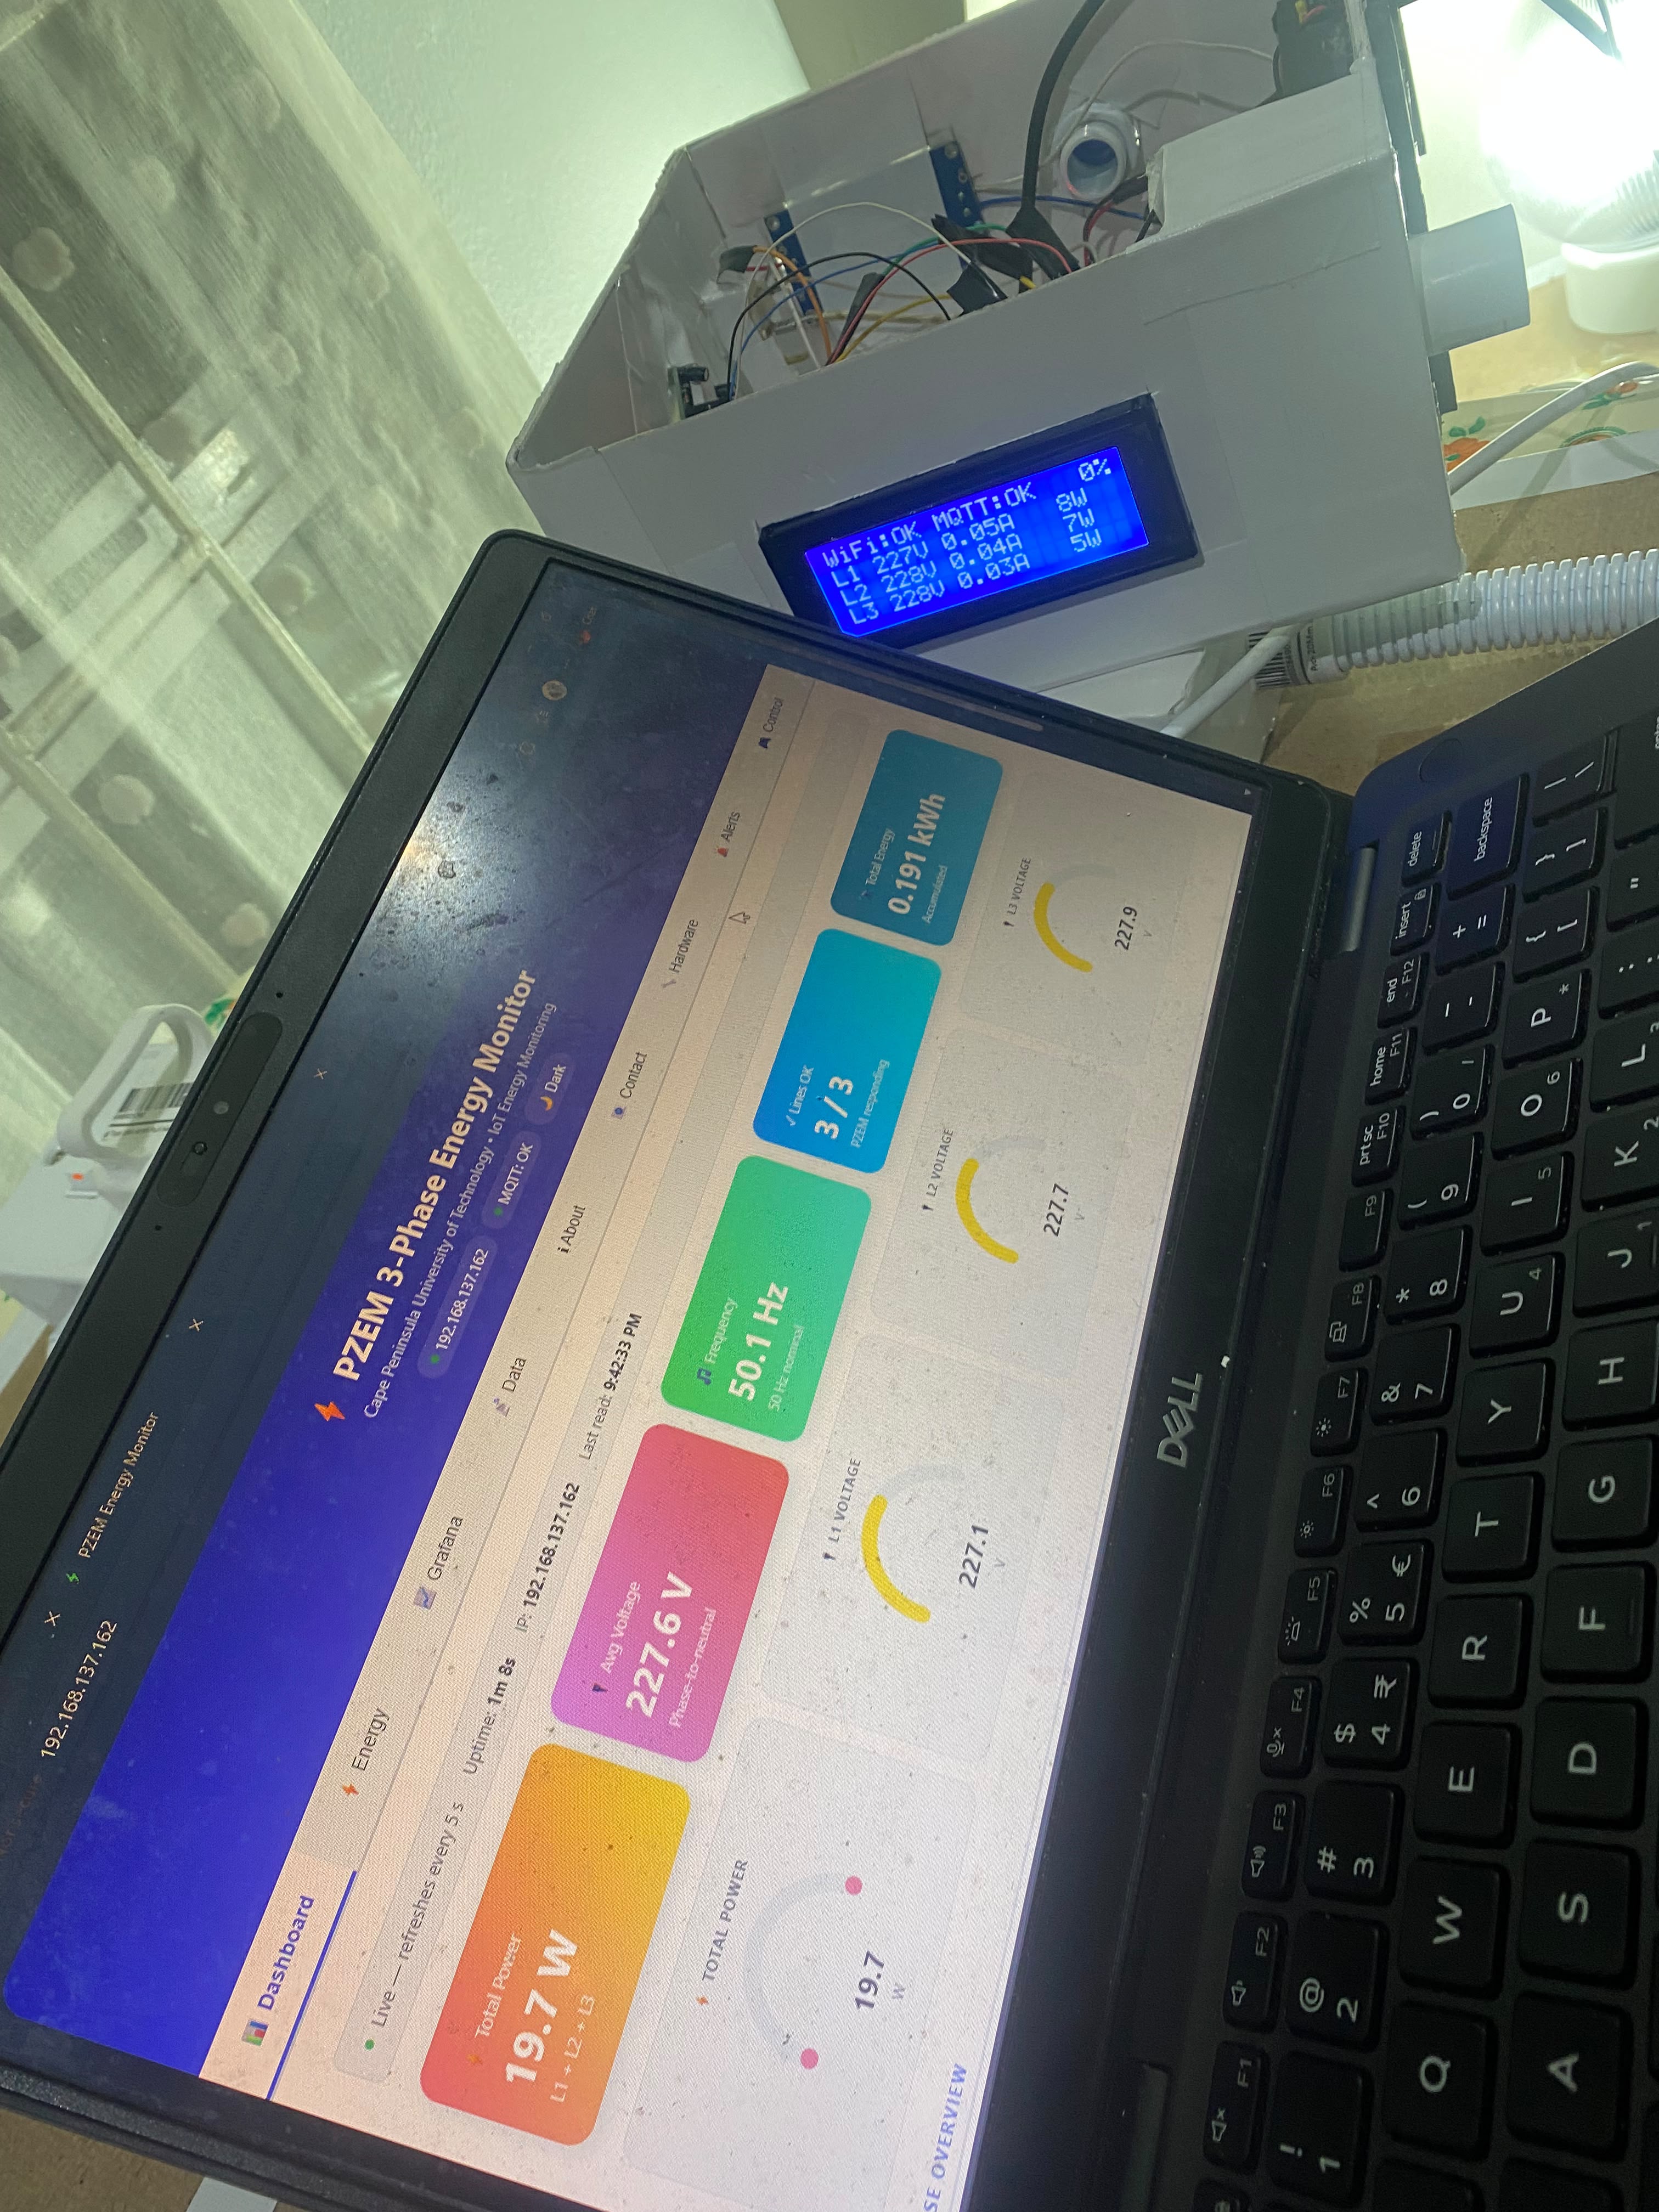
Controller enclosure streaming live 3-phase data while the React dashboard shows 19.7W total power and 227.6V avg voltage
-
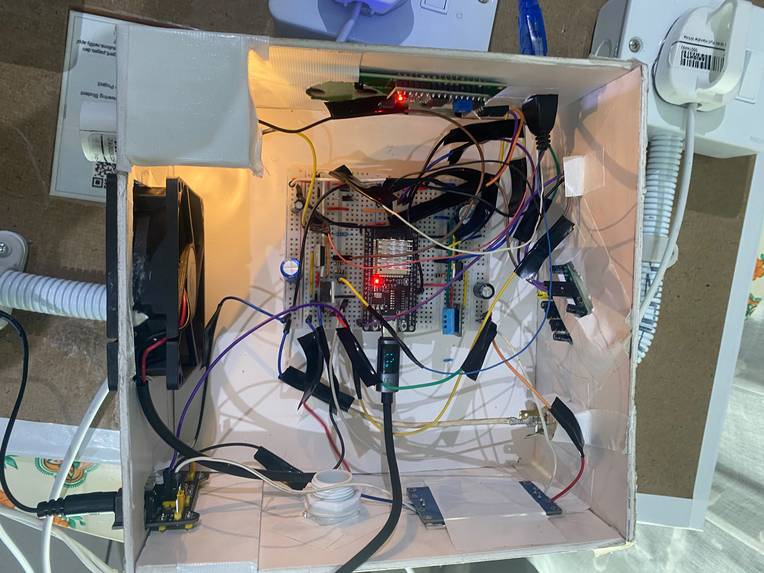
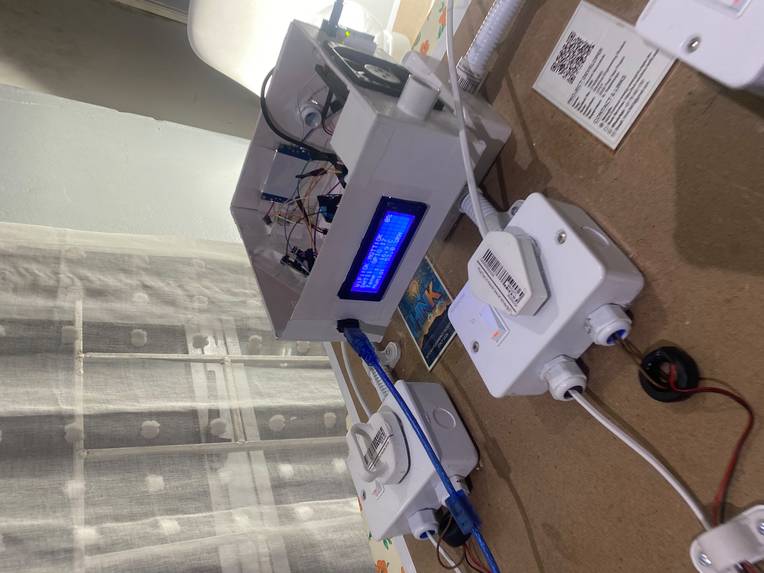
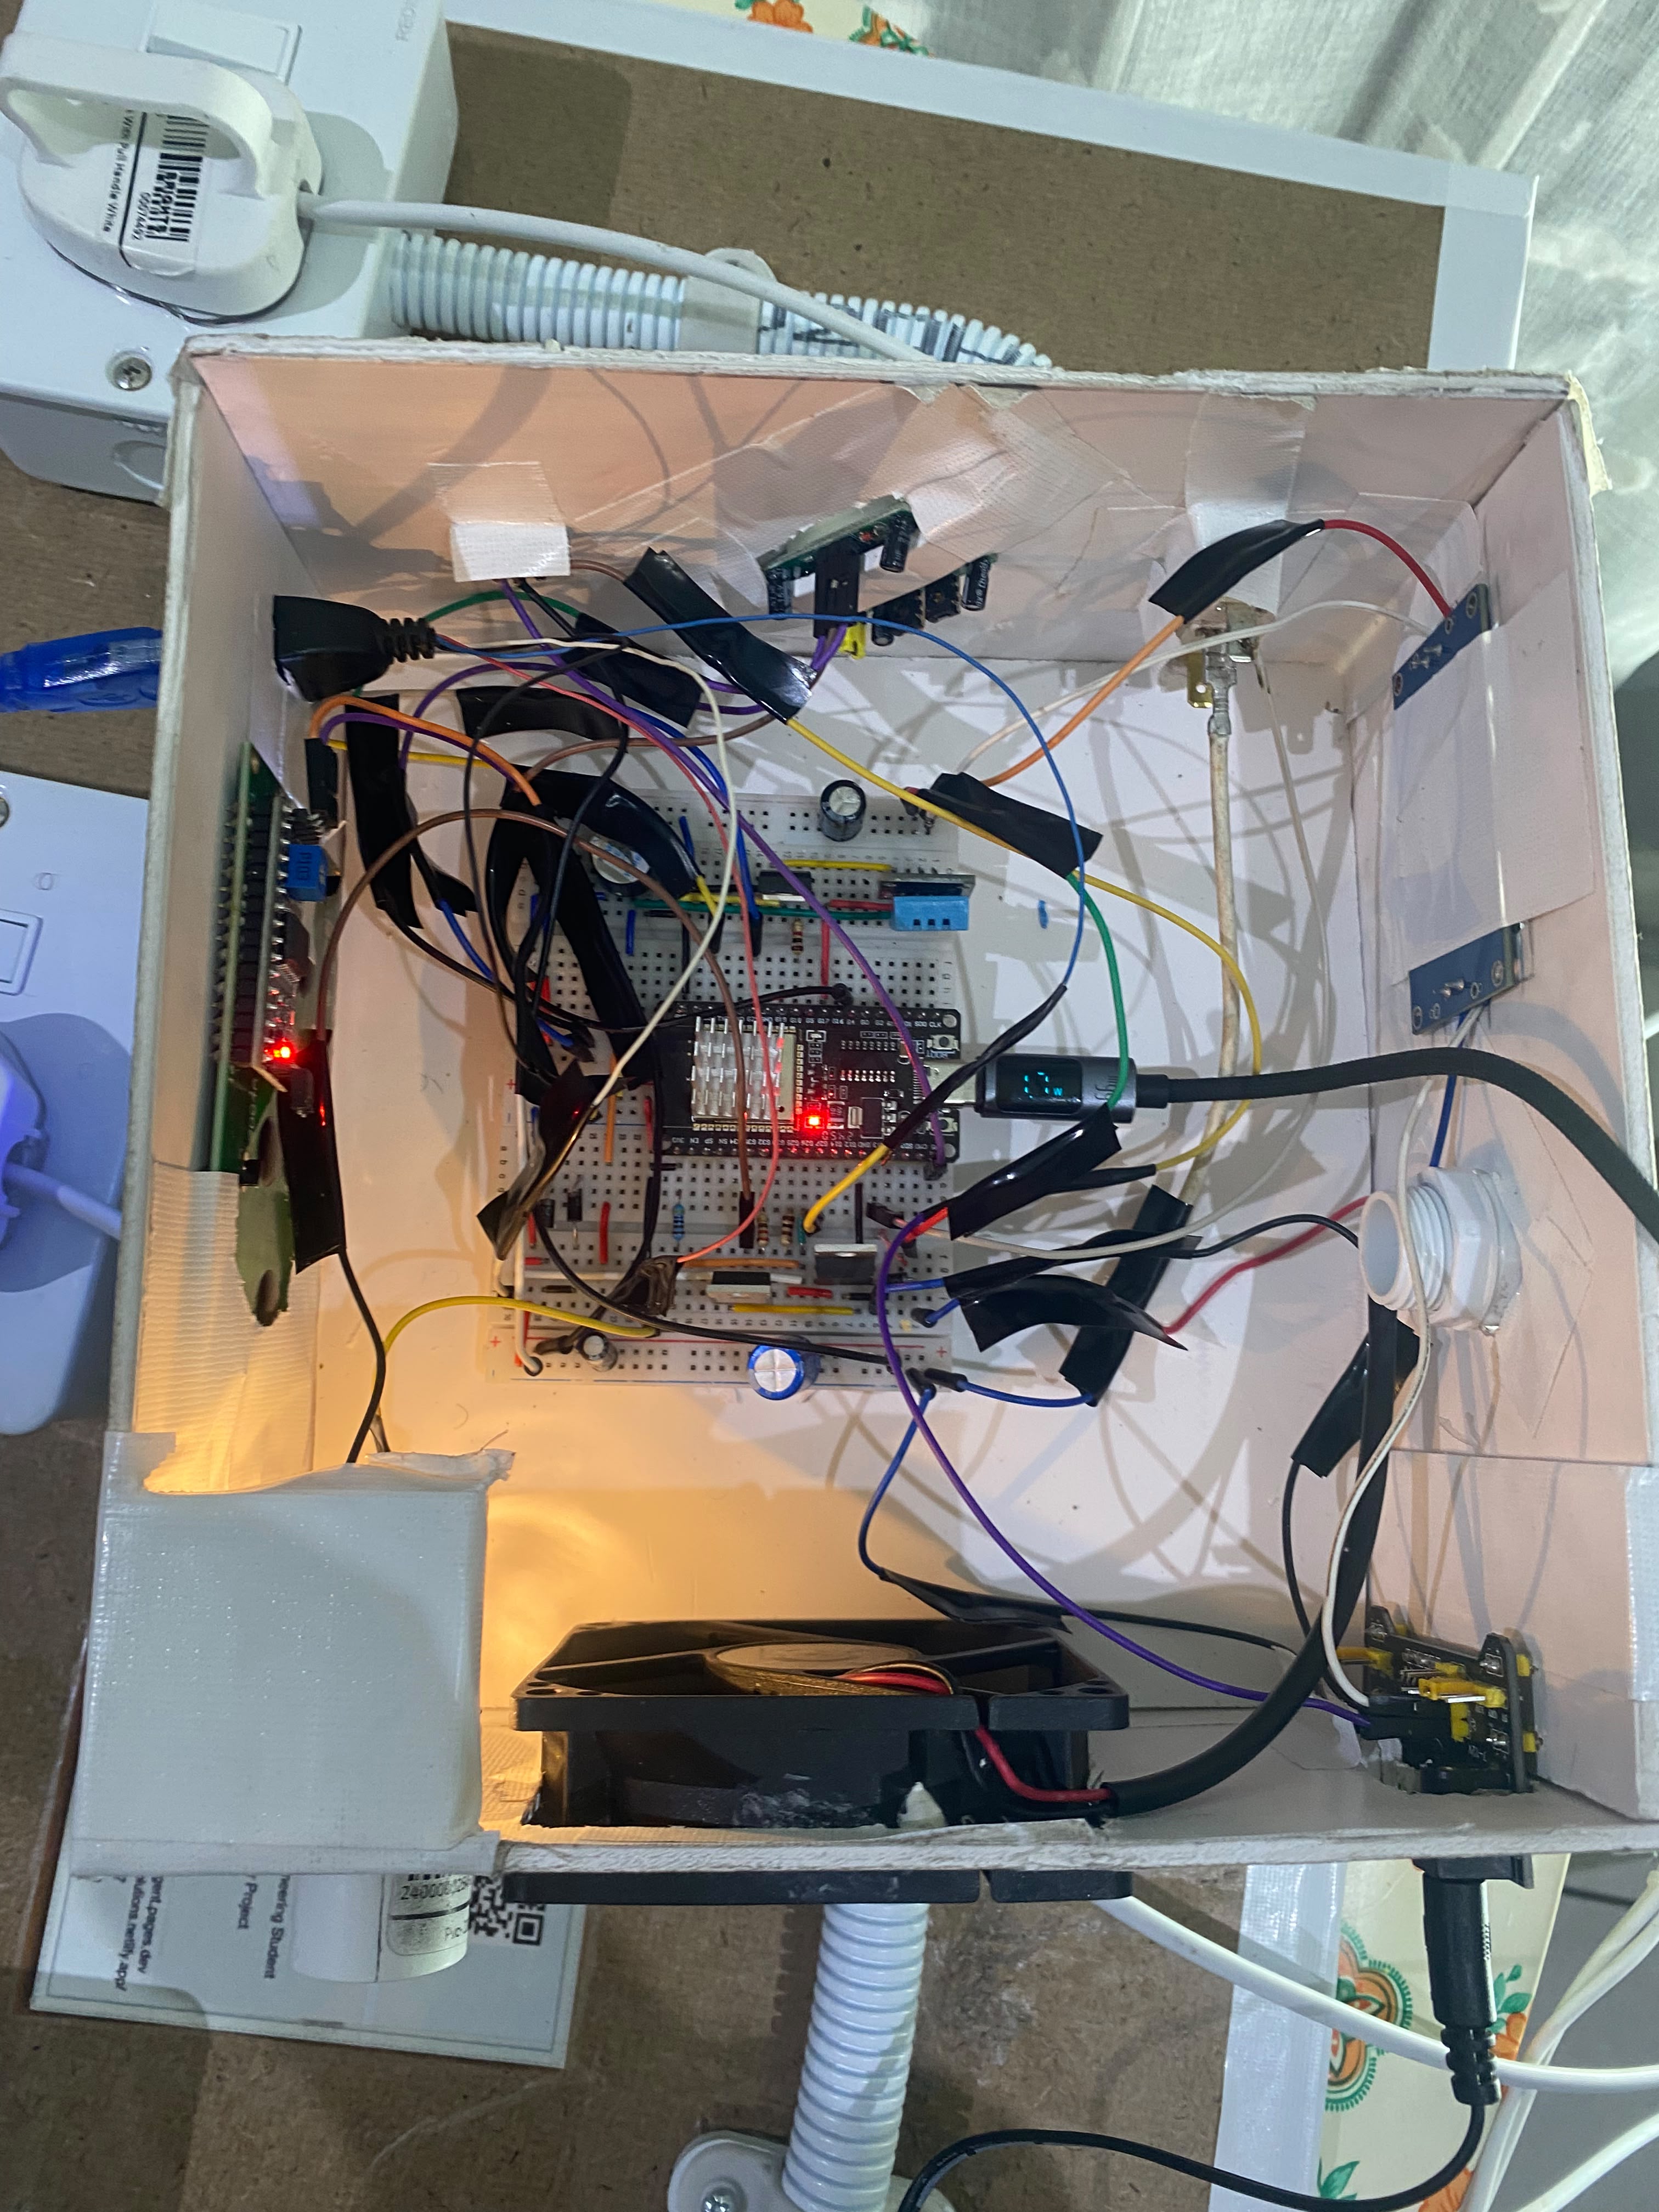
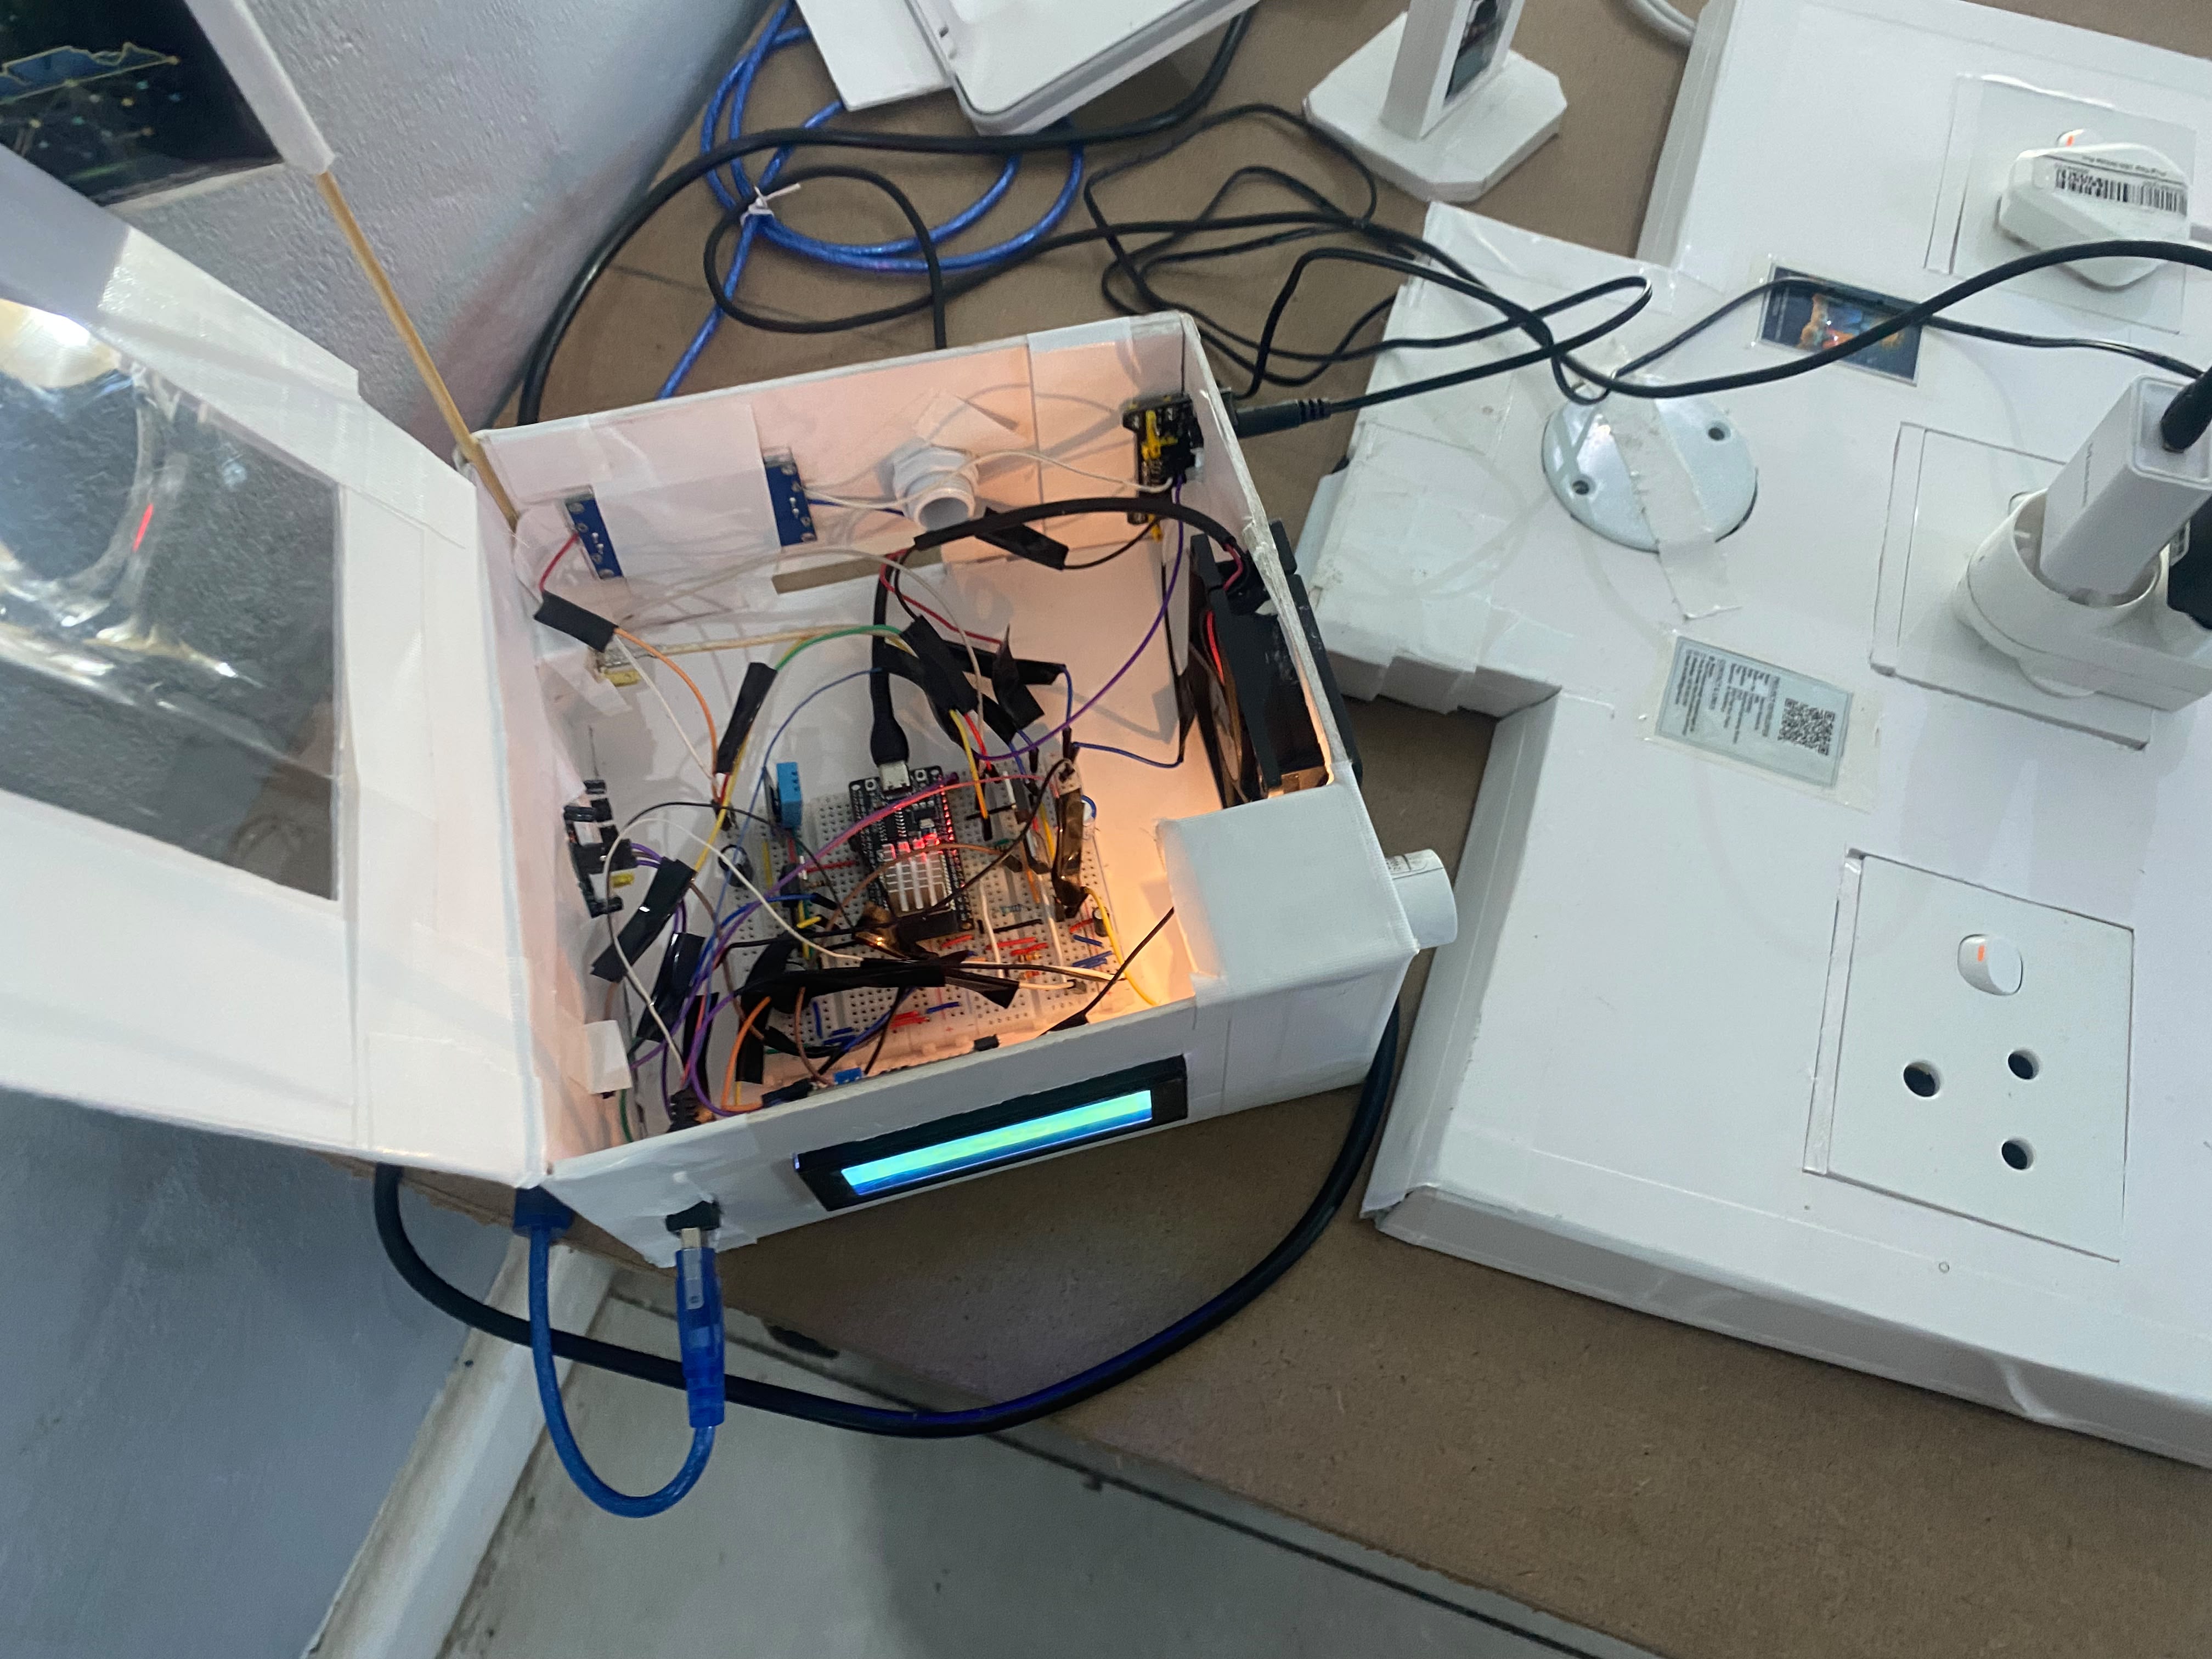
Inside the controller: ESP32 on breadboard, DHT11, MQ-135 gas sensor, HC-SR501 PIR and IRLZ44N MOSFET fan driver
-
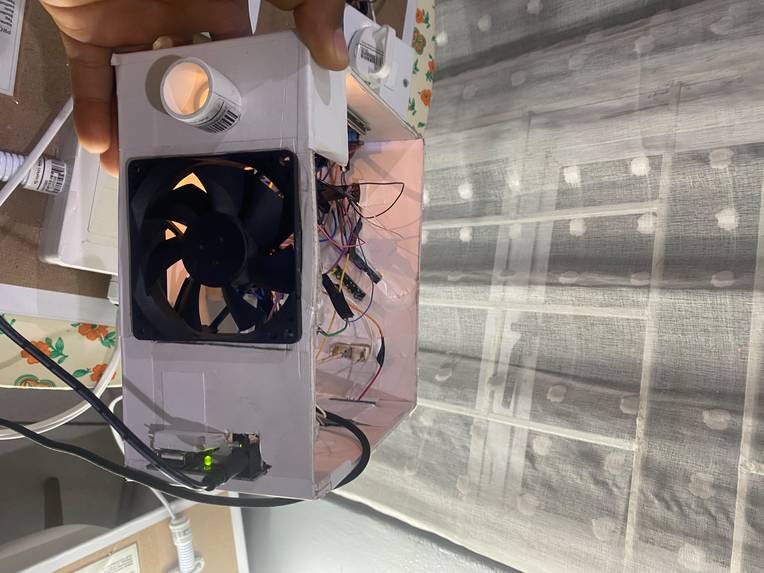
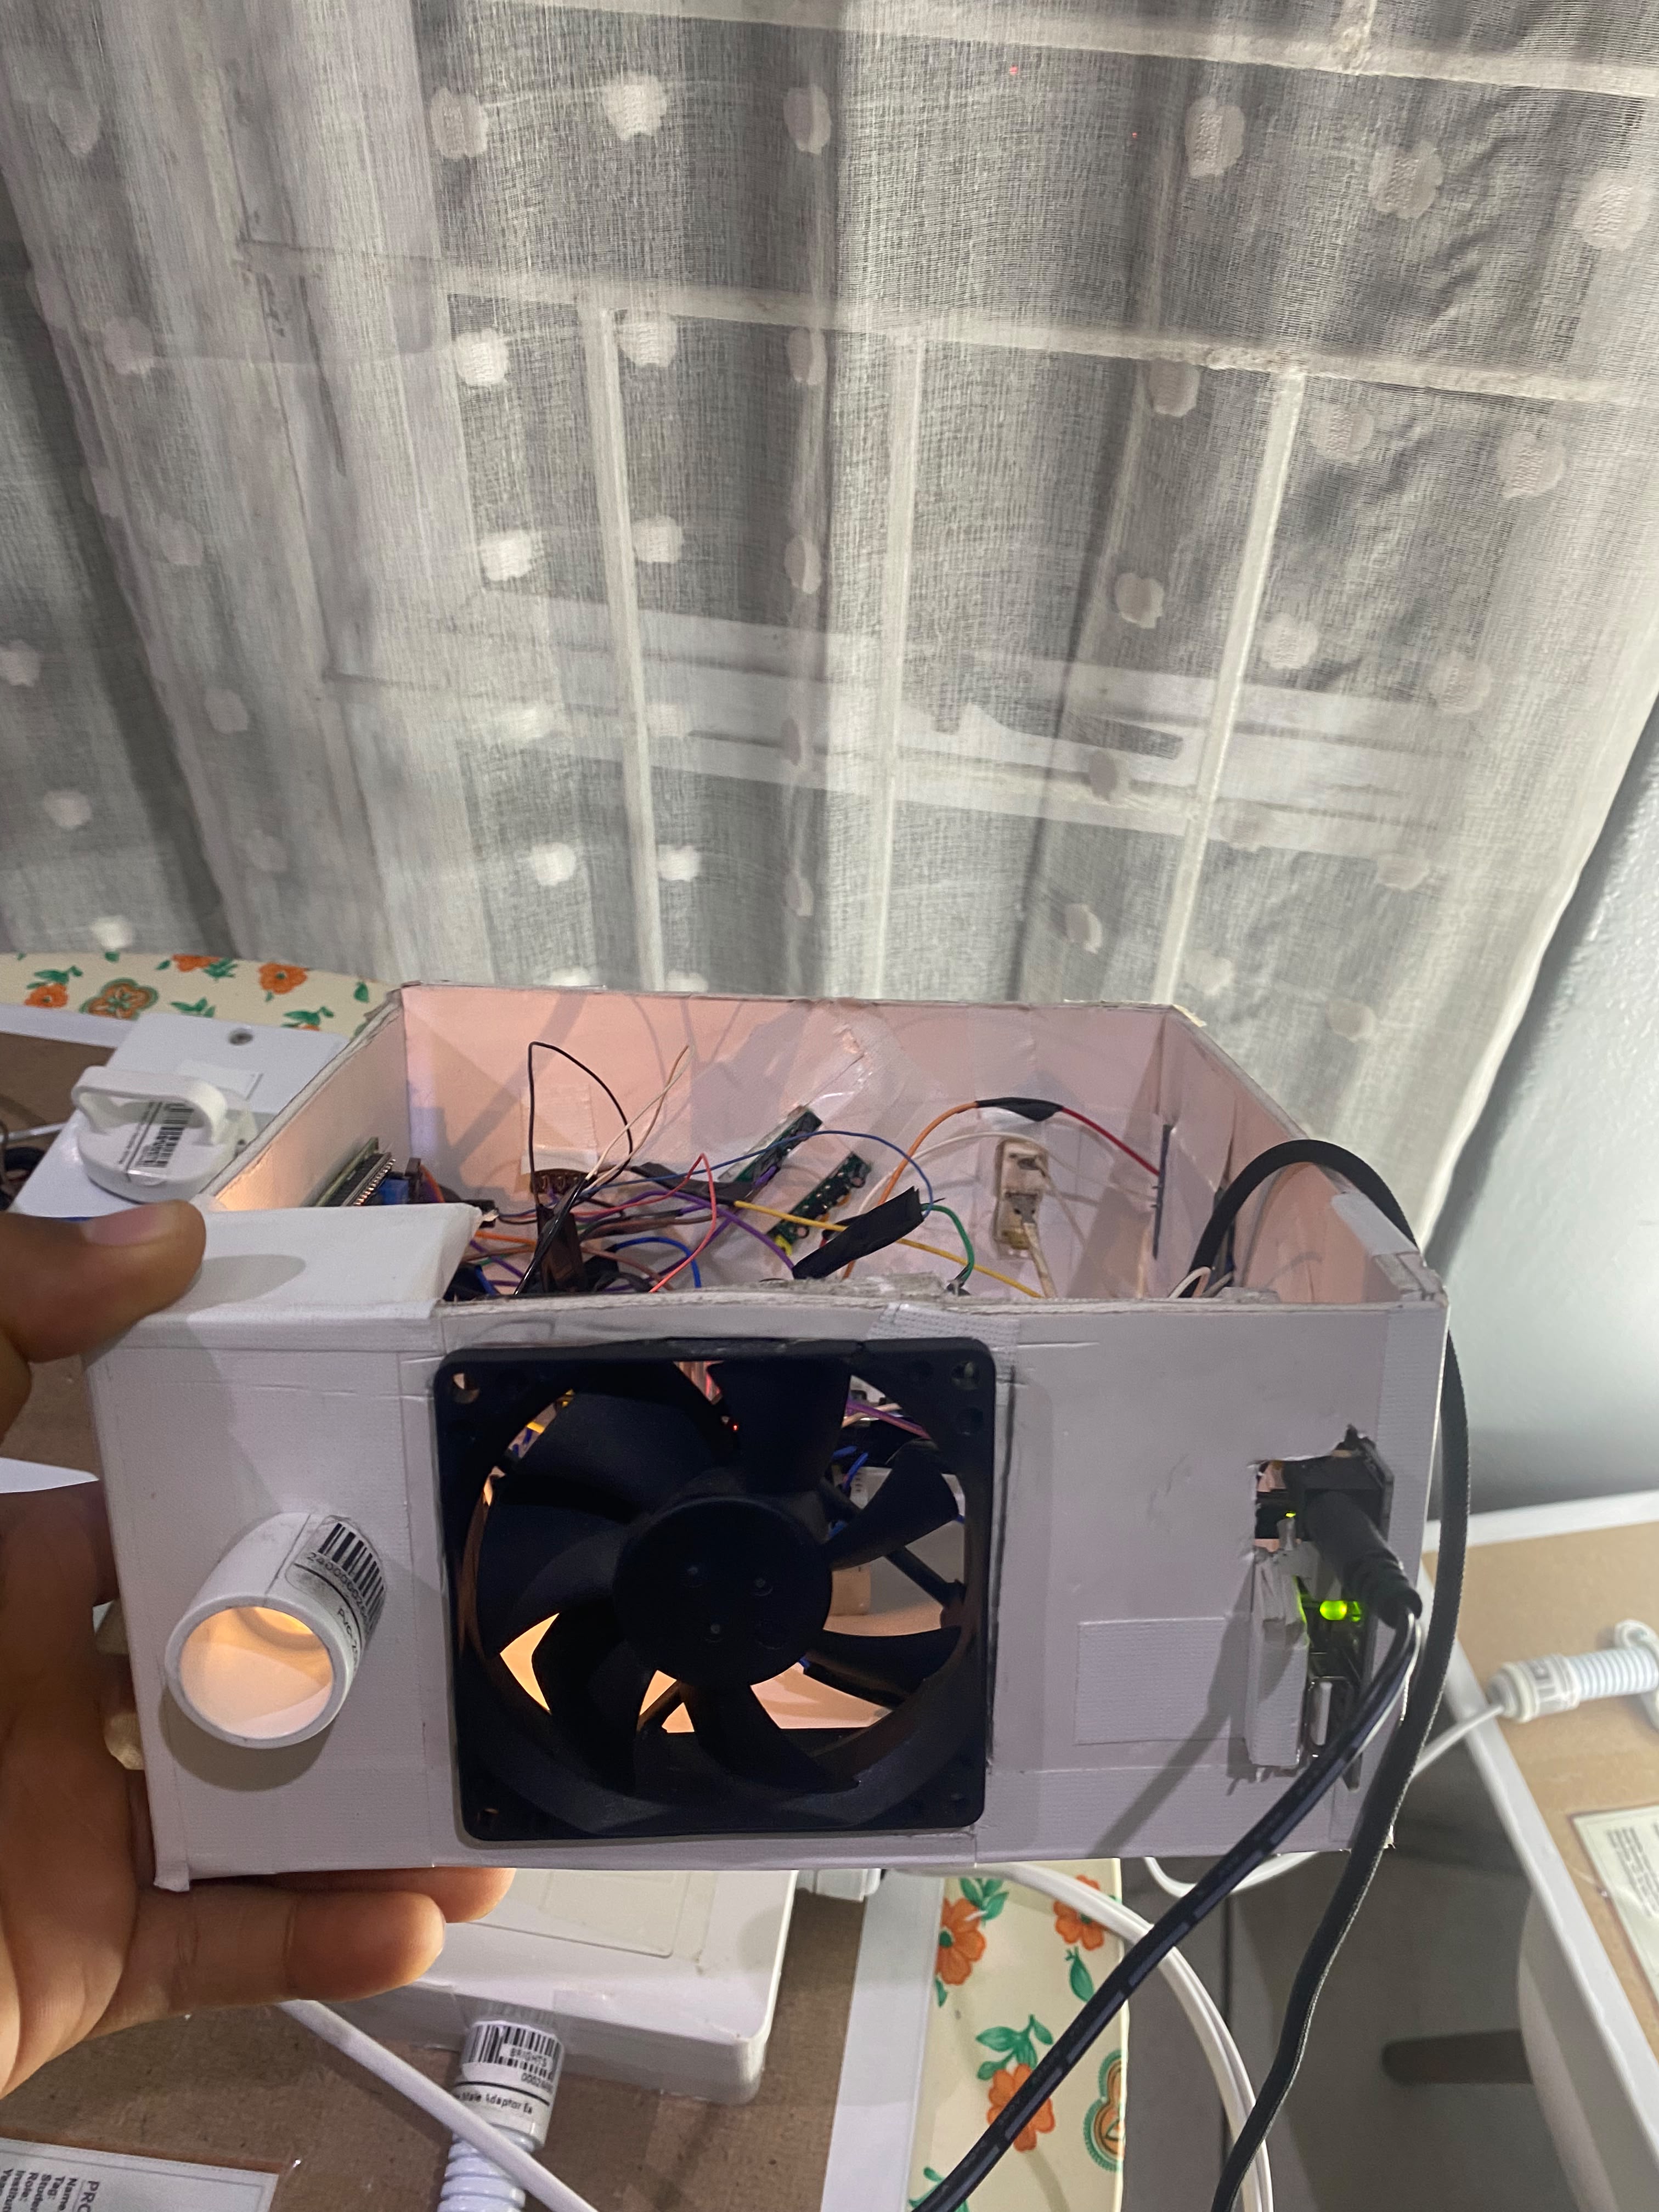
Enclosure side panel: 12V boost converter with red voltage display, cable gland and 3-phase wiring connections
-
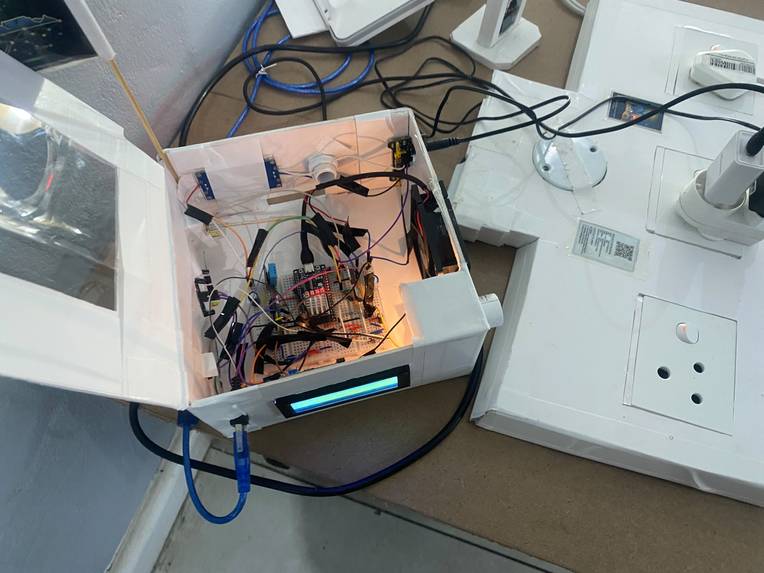
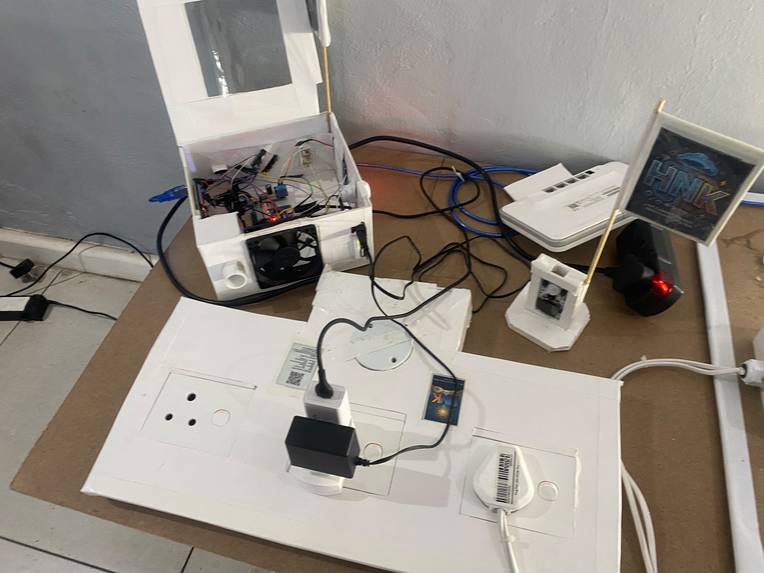
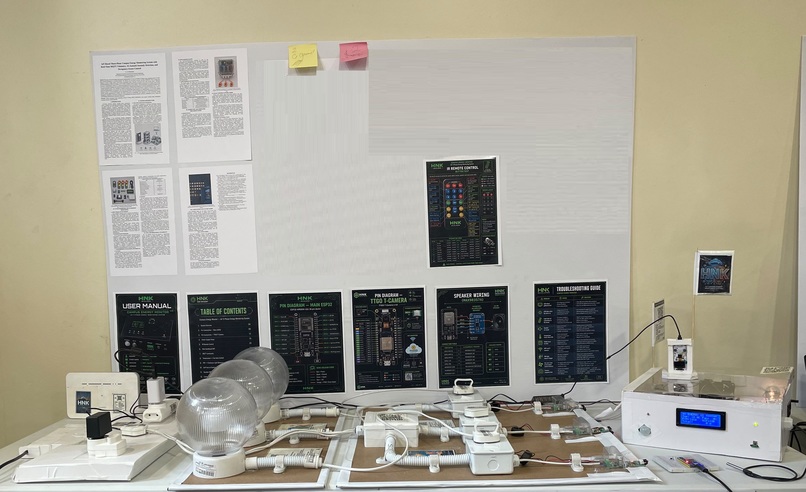
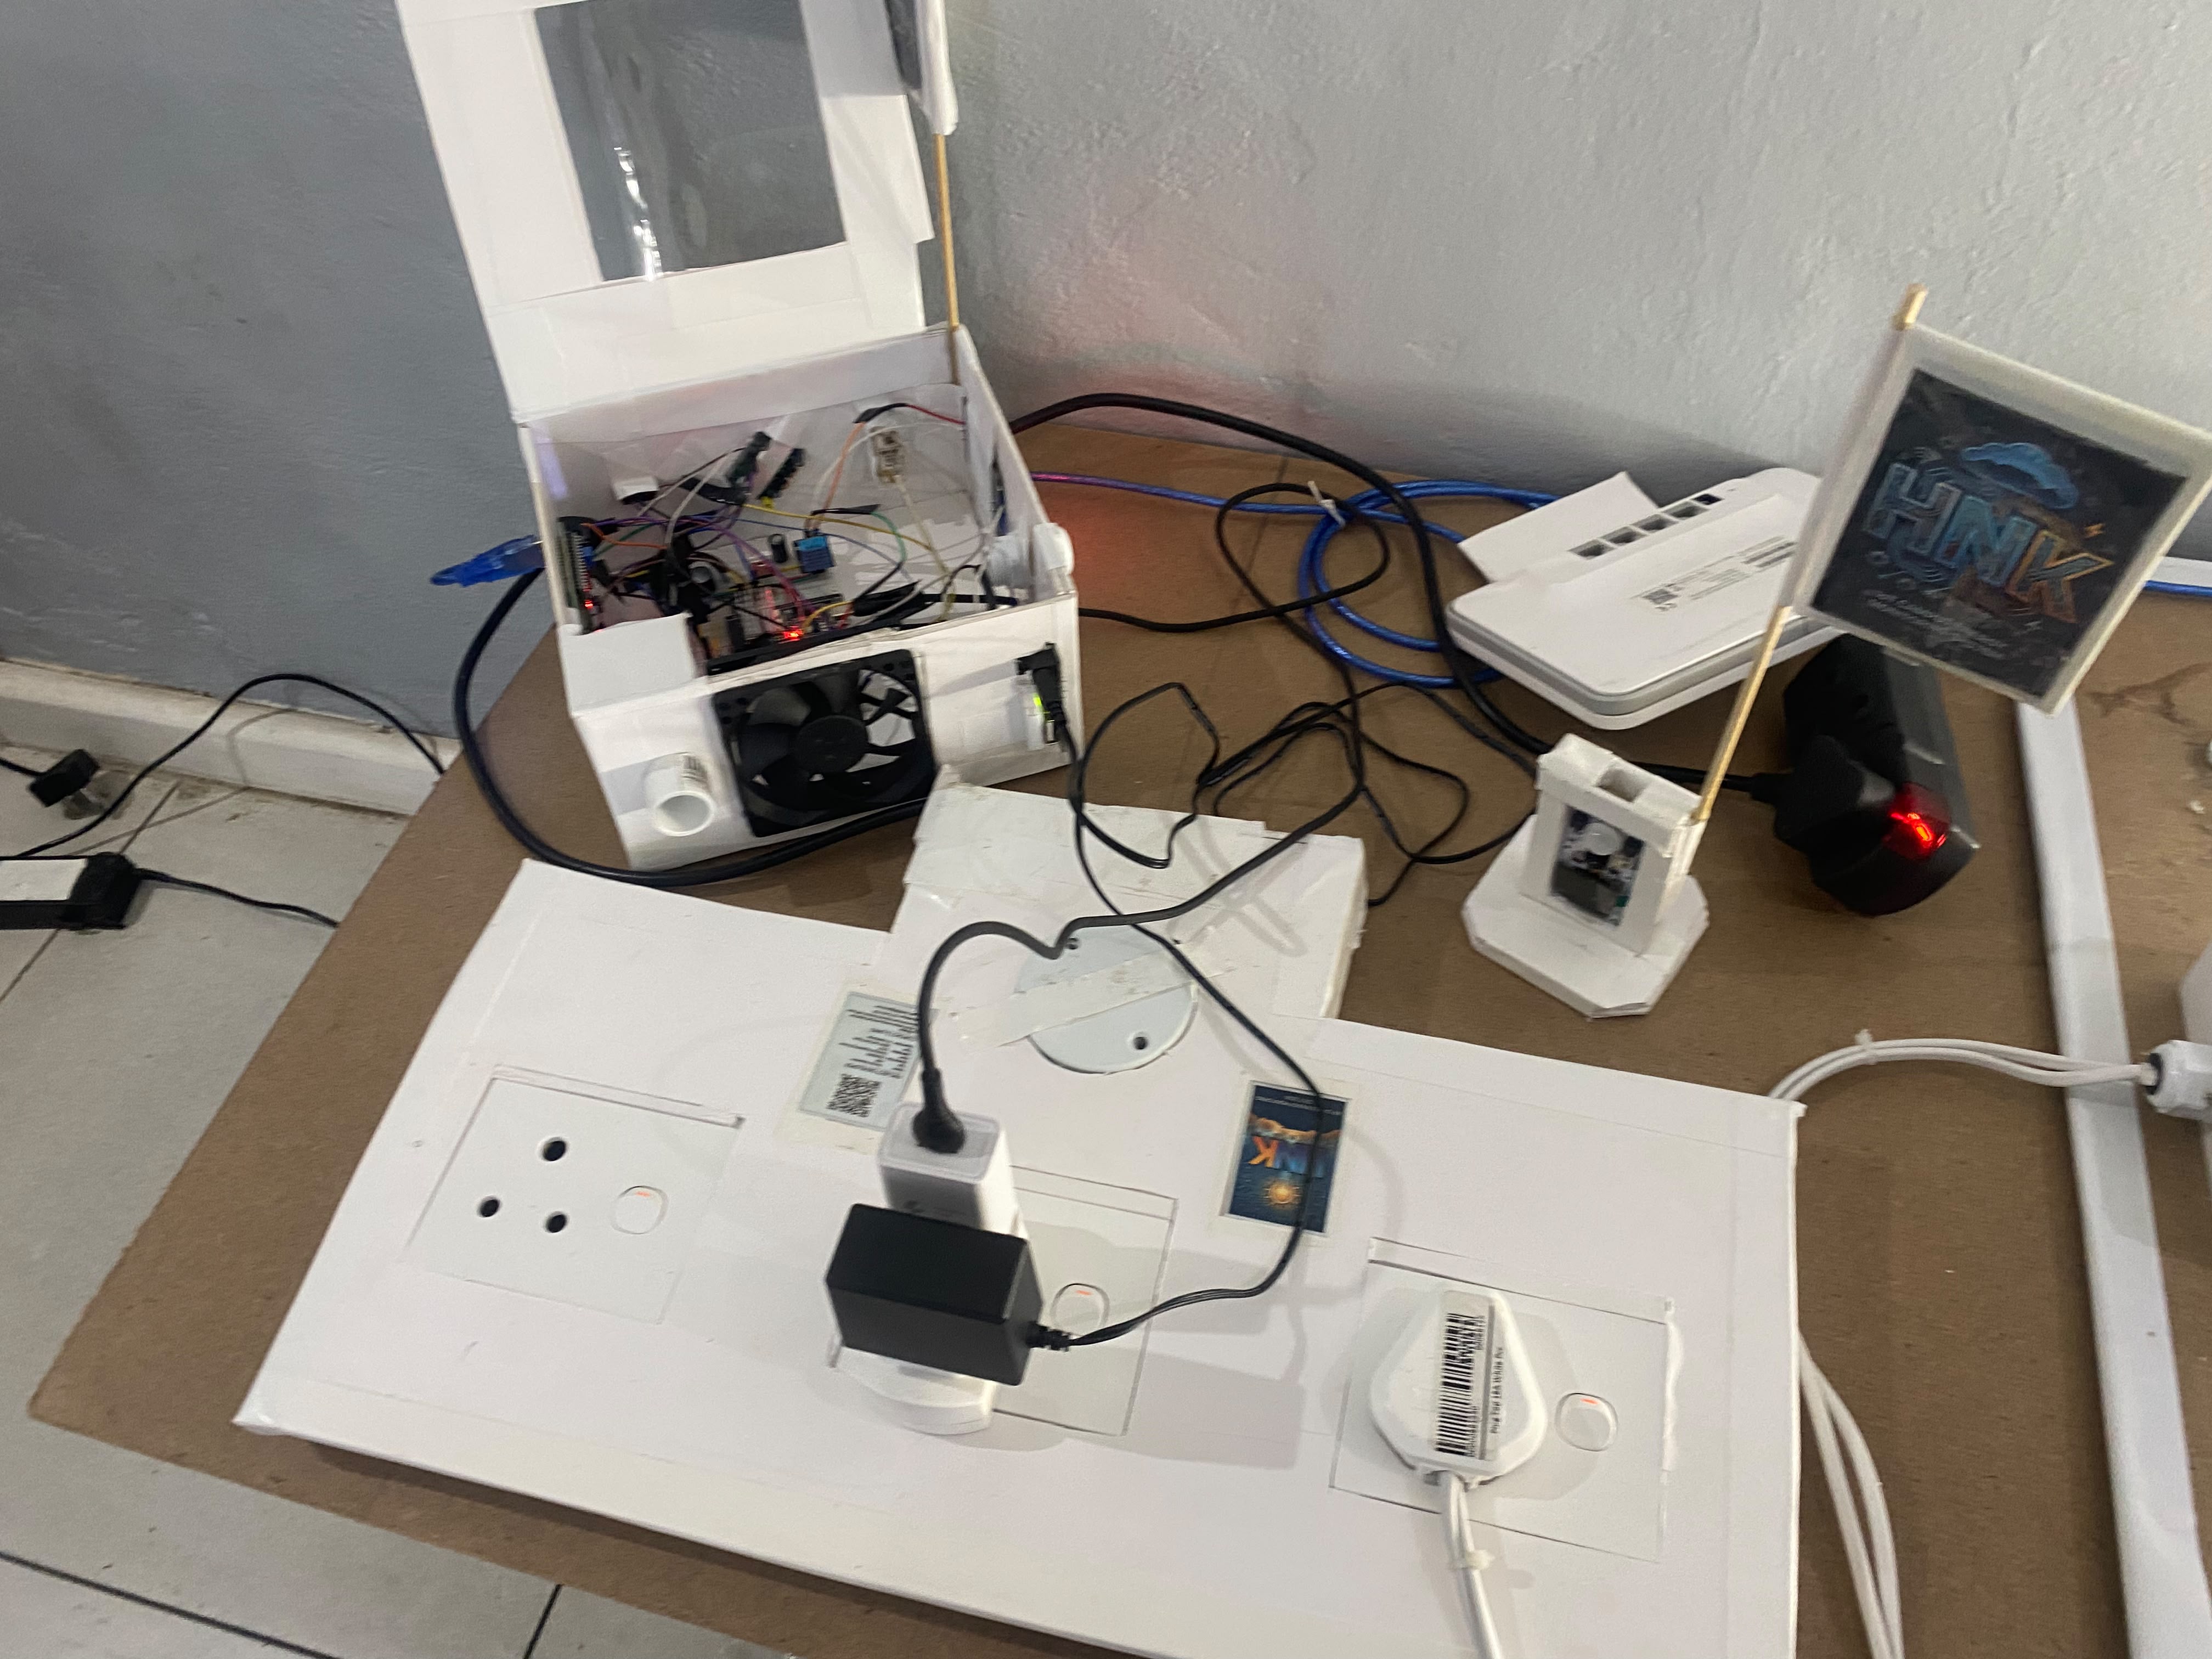
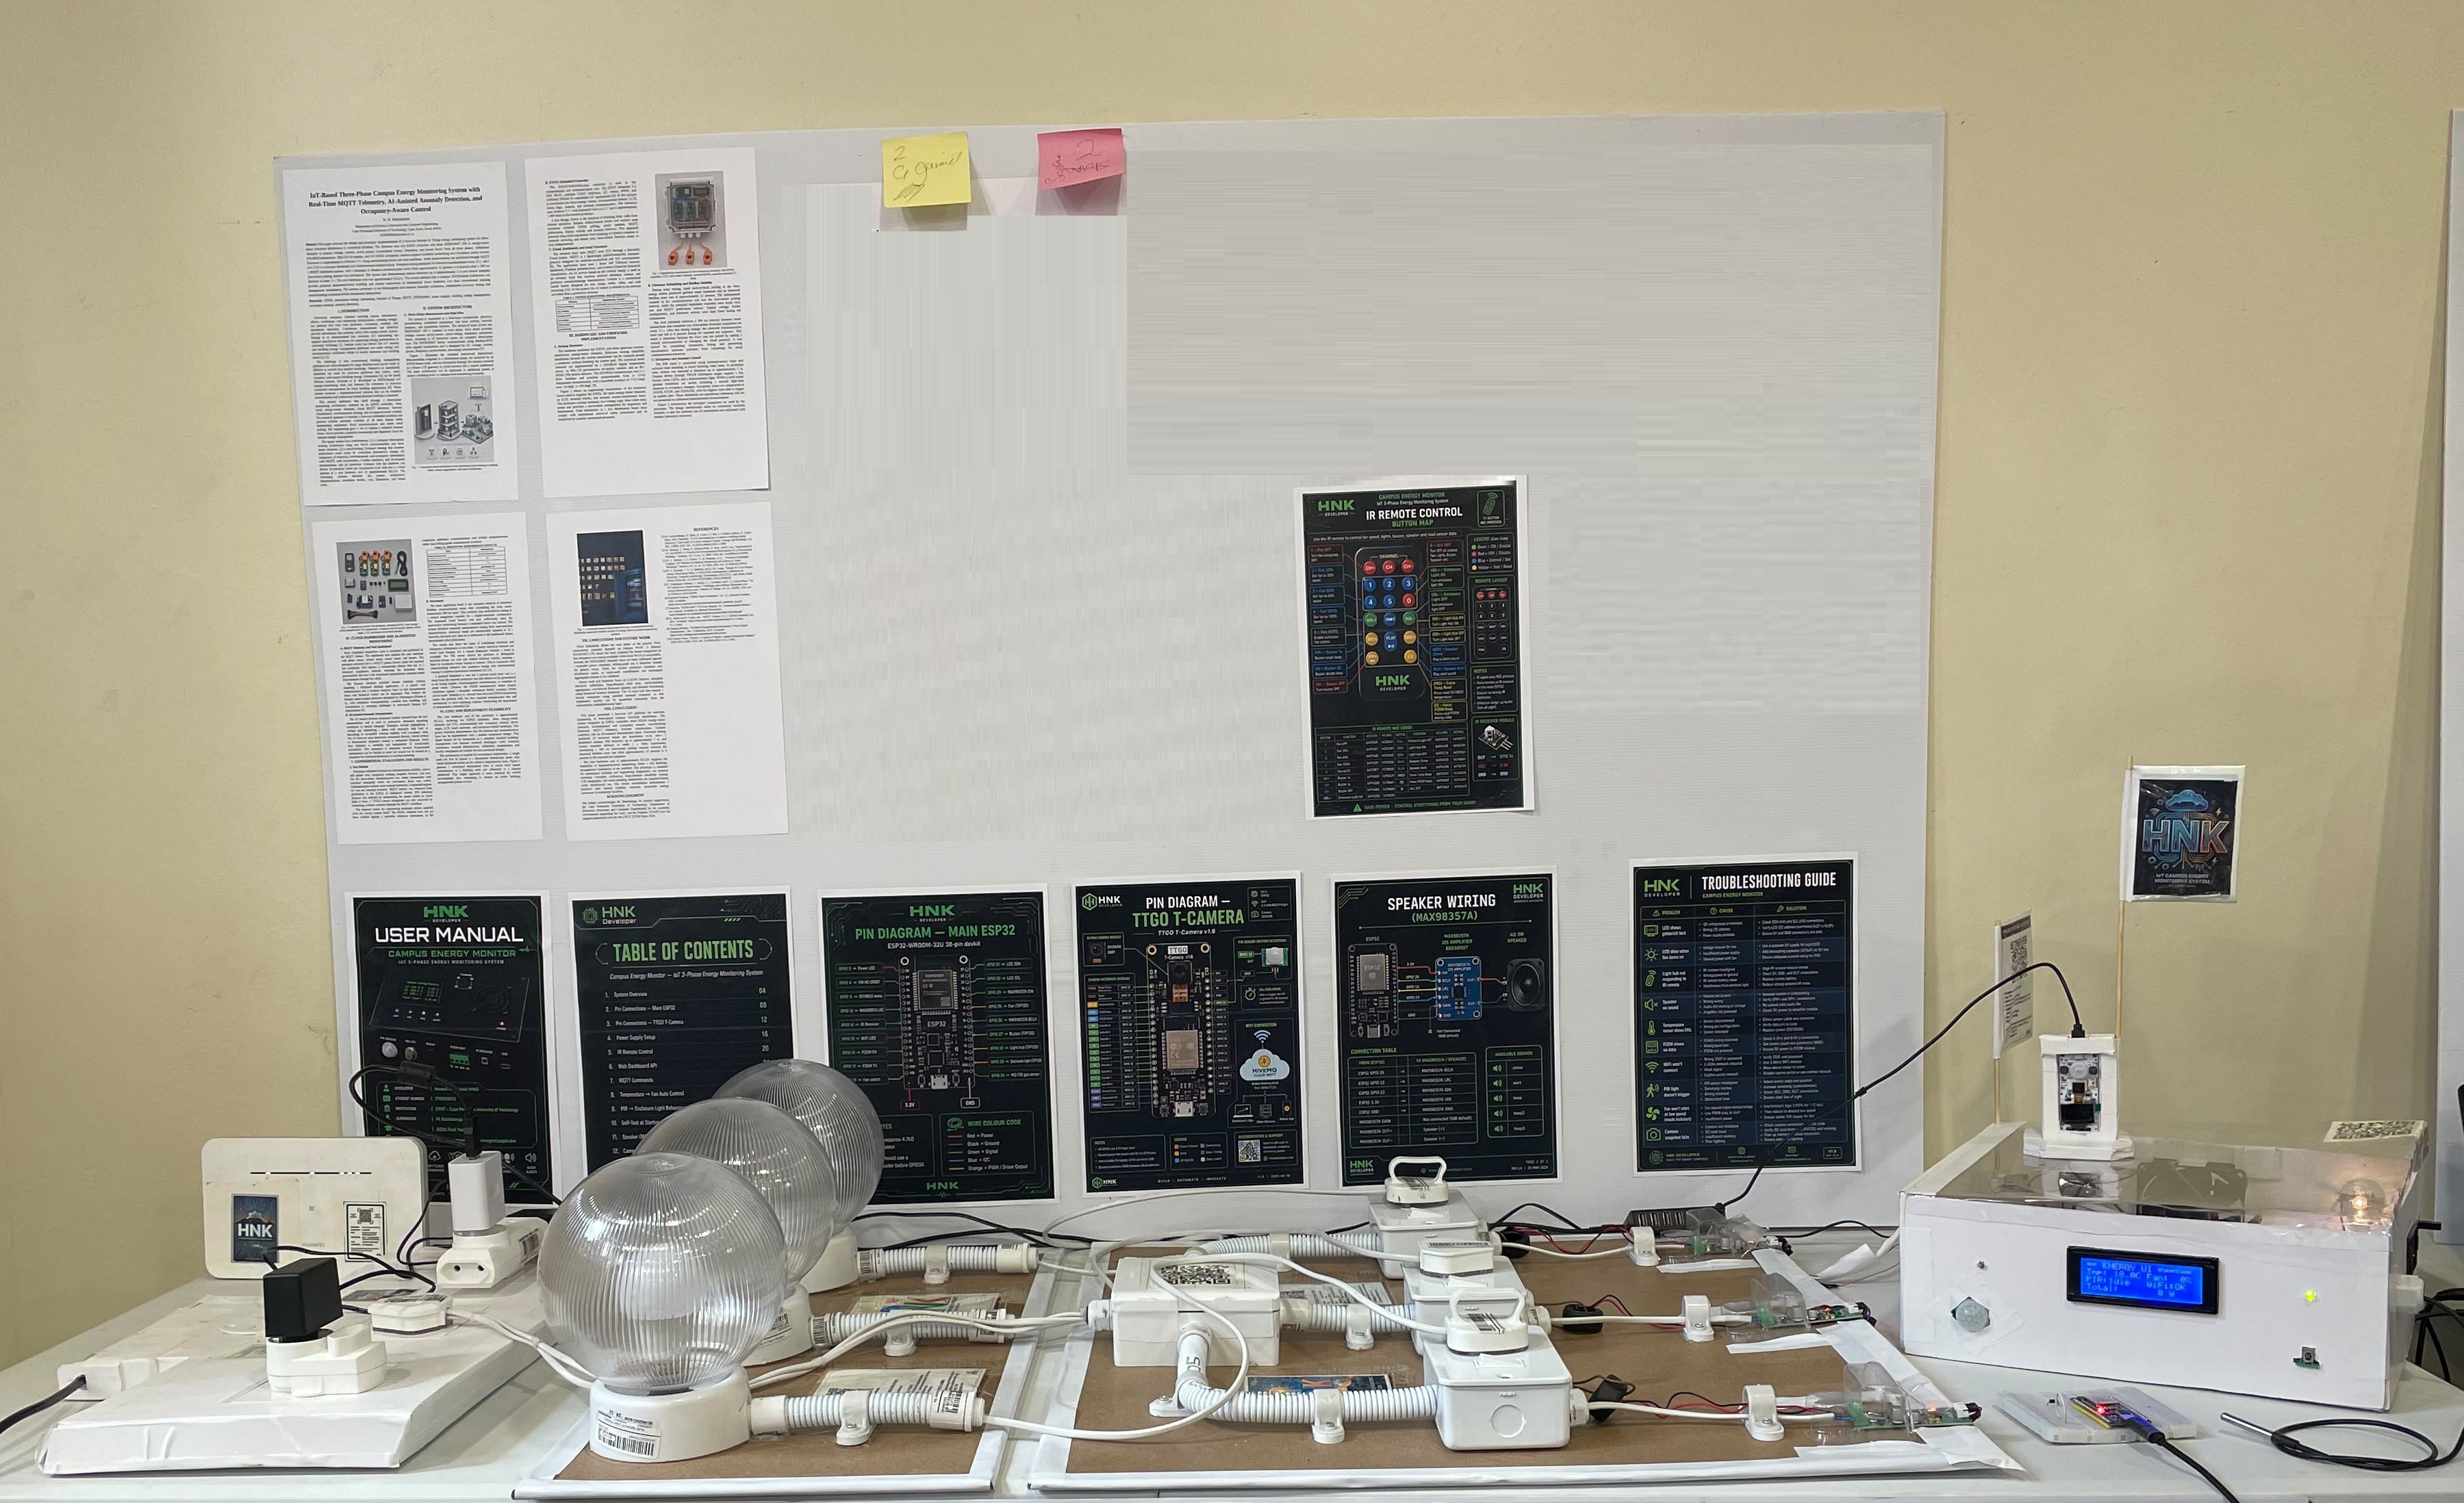
Complete bench test: controller enclosure, TTGO T-Camera on stand, LTE router and 3-phase load panel all running simultaneously
-
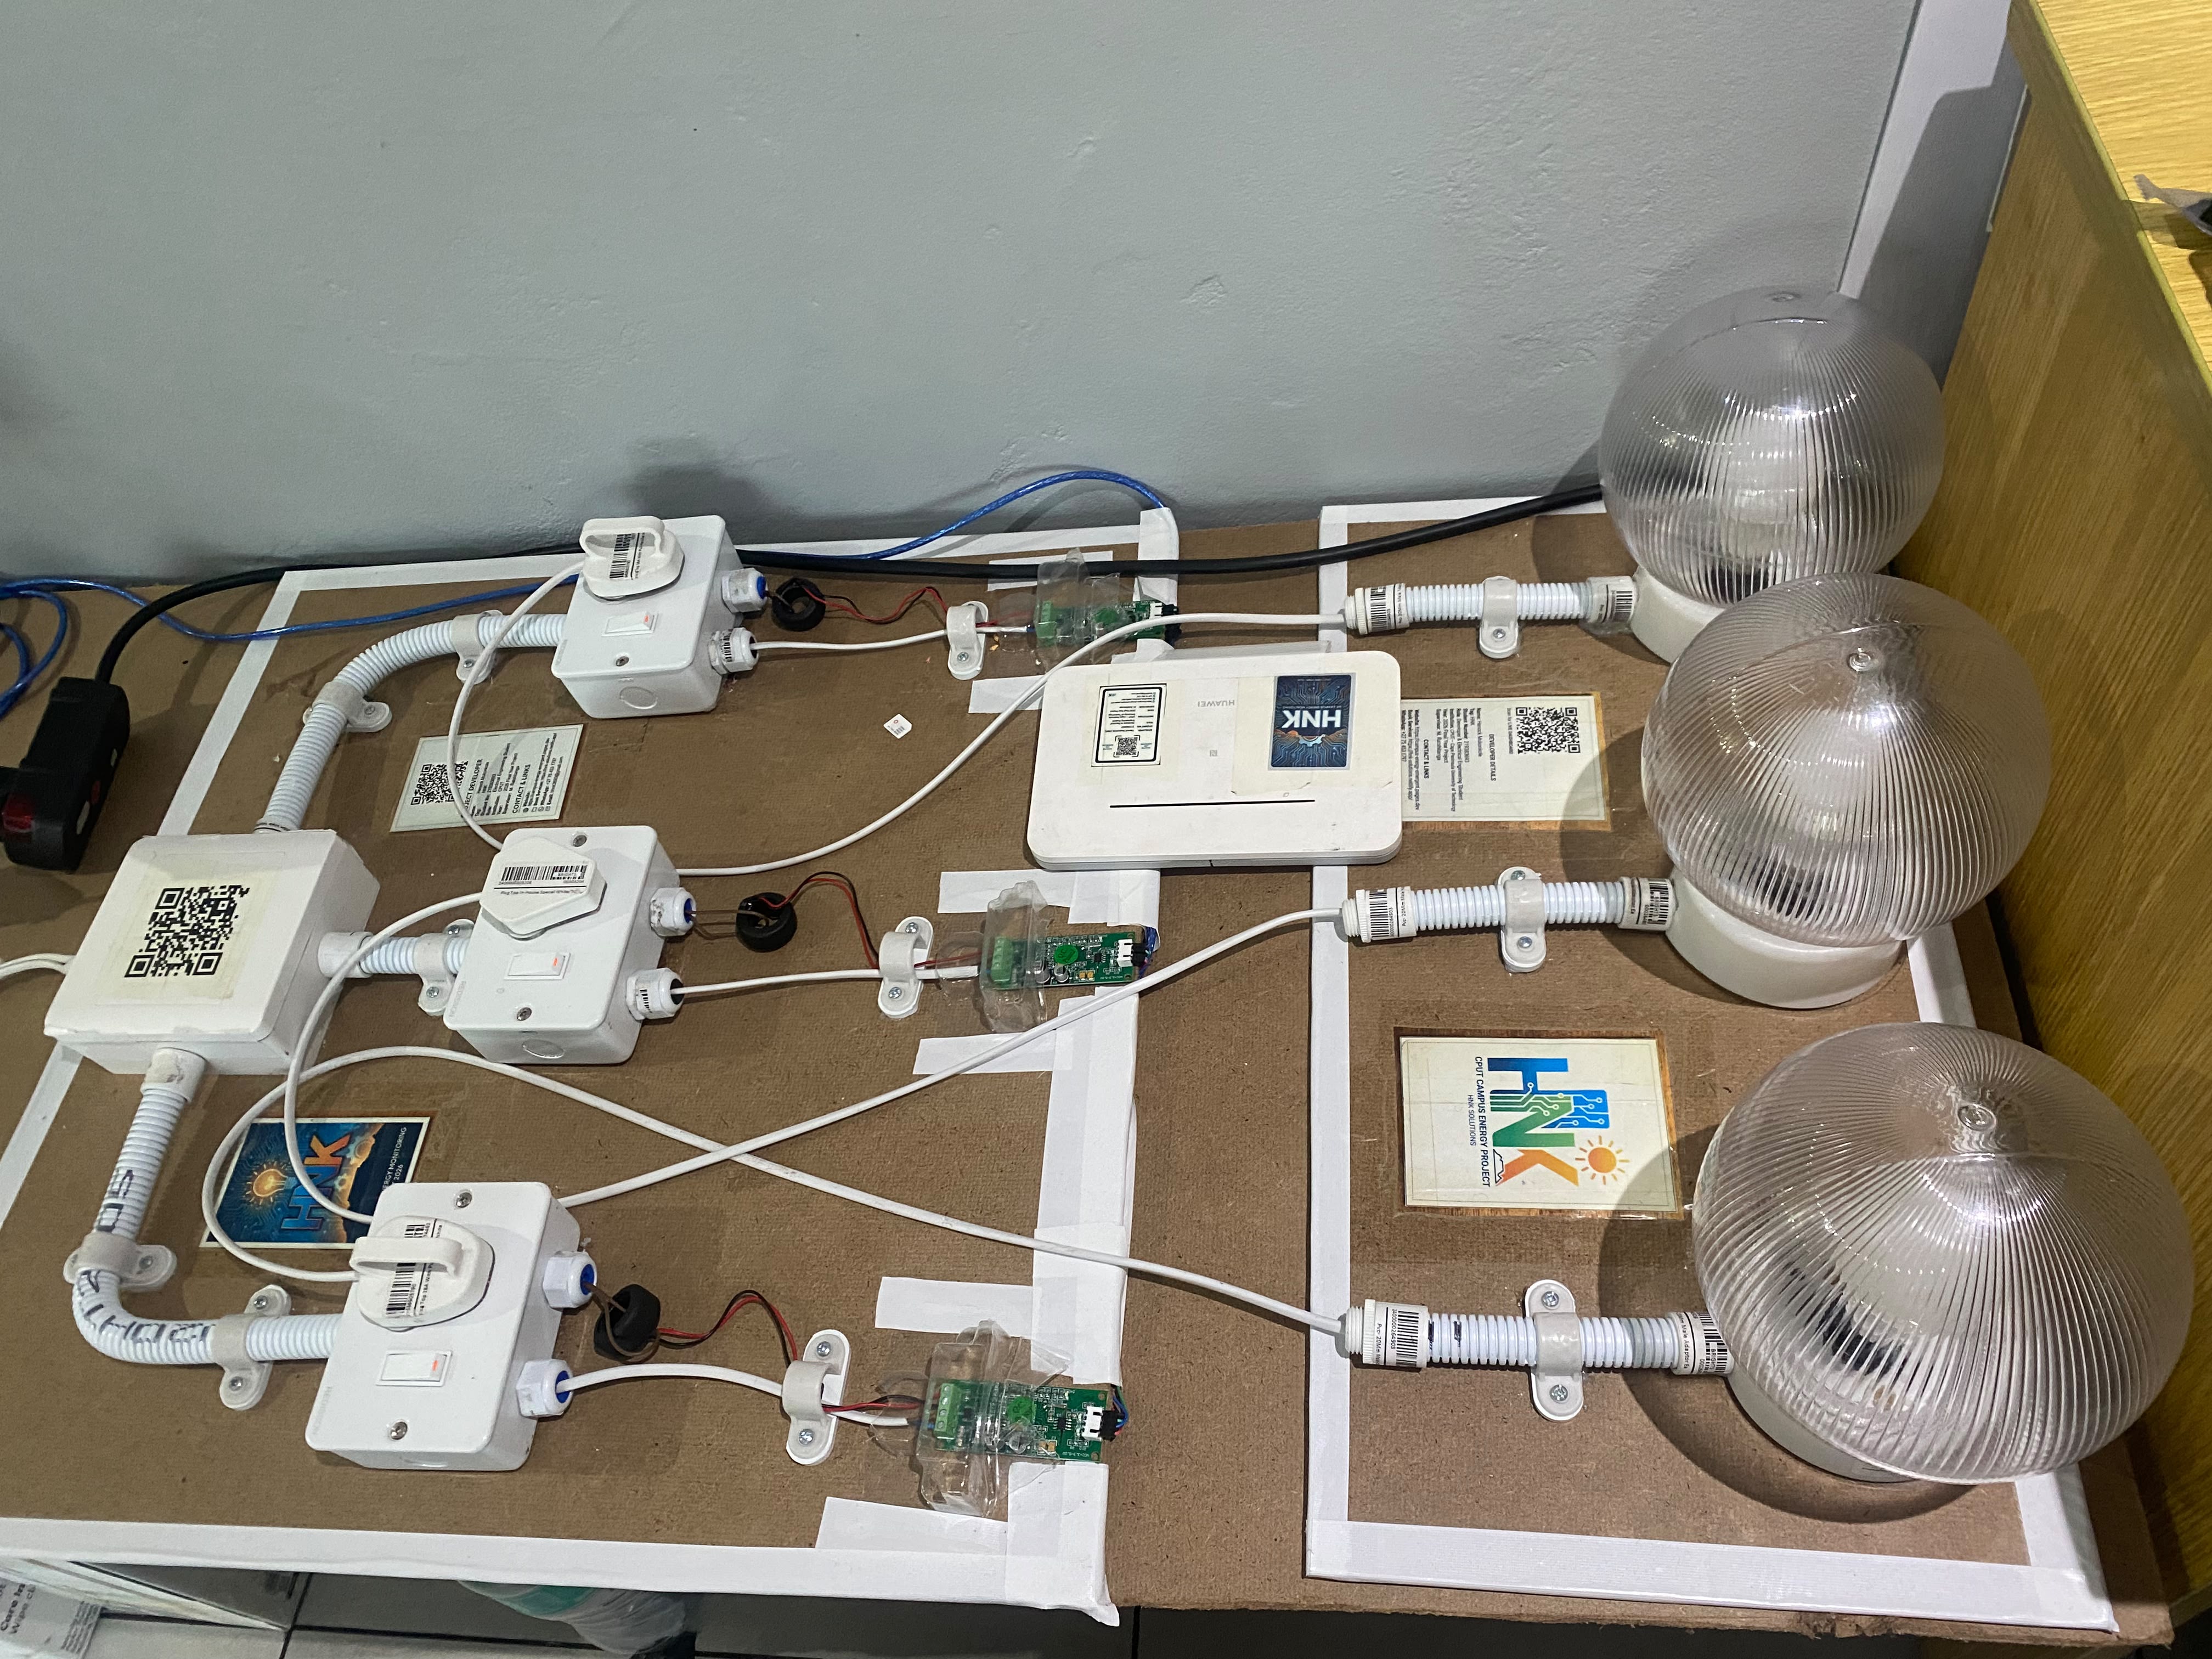
3-phase load board: three independent switched lamp circuits, each metered by a dedicated PZEM-004T sensor
-
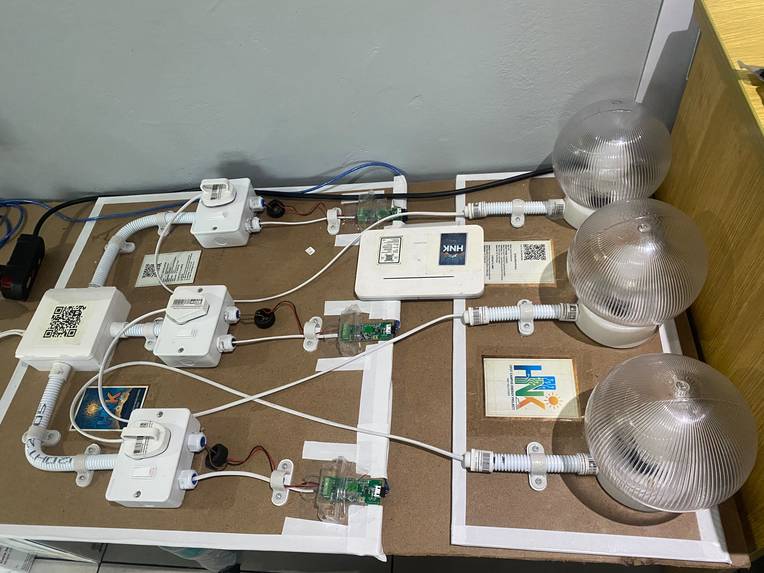
3-phase load board: three independent switched lamp circuits, each metered by a dedicated PZEM-004T sensor
-
Real installation: PZEM-004T modules, MCB breakers, neutral bars and CT clamps in a live distribution board
-
Front panel close-up showing the 20x4 LCD with live L1, L2 and L3 phase readings during field installation
-
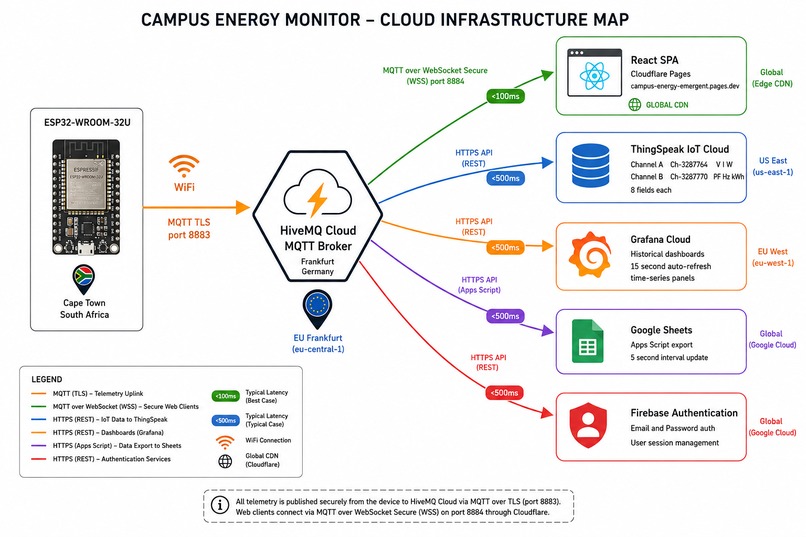
Cloud map: Cape Town ESP32 to HiveMQ Frankfurt, then ThingSpeak US East, Grafana Cloud EU West, Google Sheets and Firebase Auth
Inspiration
Shared living situations, student residences, rented flats, shared houses, budget hotels, almost always run on one electricity meter split evenly between everyone. The person who is out at work or class all day pays the same as the person running a heater around the clock. There's no way to prove who used what, so disputes happen and the people being careful with electricity end up subsidizing the people who aren't.
Commercial building energy management systems solve this at scale, but they are priced for large commercial buildings, not a landlord with four rooms or a student res committee working on a tight budget. That gap is what EnergyLens is built for: real per-unit metering at a cost that a small landlord or shared house can actually justify.
What it does
EnergyLens submeters individual rooms or units using PZEM-004T energy sensors connected to an ESP32 microcontroller. Each unit gets its own live reading of voltage, current, active power, and accumulated energy usage (kWh), so billing can be based on what a tenant actually consumed instead of an even split.
The data streams over MQTT to the cloud in real time and is visualized on a live dashboard, giving a landlord or building manager a clear, ongoing picture of consumption across every monitored unit. On top of the raw metering, an AI layer reviews the incoming data and flags patterns worth a human's attention, for example a unit showing energy draw with no expected activity, or usage that suddenly deviates from a tenant's normal pattern.
How we built it
The core of the system is an ESP32 microcontroller running Arduino/C++ firmware. Multiple PZEM-004T energy sensors are wired to the ESP32 over a shared serial bus (Modbus RTU), one sensor per monitored room or unit. The firmware polls each sensor in turn and publishes the combined readings over WiFi via MQTT to a HiveMQ Cloud broker.
From there, a Grafana dashboard subscribes to the live data stream for real-time and historical visualization, and readings are periodically passed through Google's Gemini API, which looks for abnormal consumption patterns and turns them into plain-language flags rather than leaving a human to read raw numbers off a graph.
Challenges we ran into
Getting multiple PZEM-004T sensors to communicate reliably on a single bus was the main hurdle. Each sensor needed a unique Modbus address assigned before the ESP32 could tell their readings apart, otherwise the data collided and produced unreliable numbers. On top of that, some of the sensor units had their communication lines wired in the opposite direction relative to the others, so a diode had to be added to correct the polarity before the signal would read correctly. Once the addressing and wiring were sorted, the ESP32 could poll each sensor individually and forward clean, per-unit data over MQTT.
Accomplishments that we're proud of
Getting a full pipeline working end to end, sensor hardware, MQTT transport, cloud dashboard, and an AI layer that actually interprets the data rather than just displaying it, on hardware that costs a small fraction of a commercial submetering system. The approach has already been tested in a real deployment setting, not just on a bench.
What we learned
Most of the hard problems in a project like this aren't the sensors themselves, they're the communication layer between them. Addressing and wiring polarity on a shared bus will silently break a system in ways that look like a bad sensor when the real issue is bus configuration. Getting that right early made everything downstream (MQTT, dashboarding, AI analysis) straightforward.
What's next for EnergyLens
- A tenant-facing view so each person can see their own usage and running cost, not just the landlord
- Automated monthly billing summaries generated directly from the collected data
- Expanding the anomaly detection to flag potential faults or safety issues (not just cost-related patterns)
- Piloting the system across more units to validate accuracy and reliability at scale
Built With
- arduino
- c++
- cloudflare
- esp32
- iot
- mqtt
- web

Log in or sign up for Devpost to join the conversation.