-
-
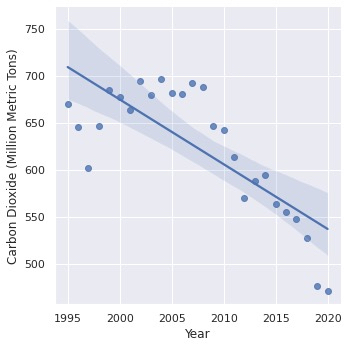
Graph 3
-
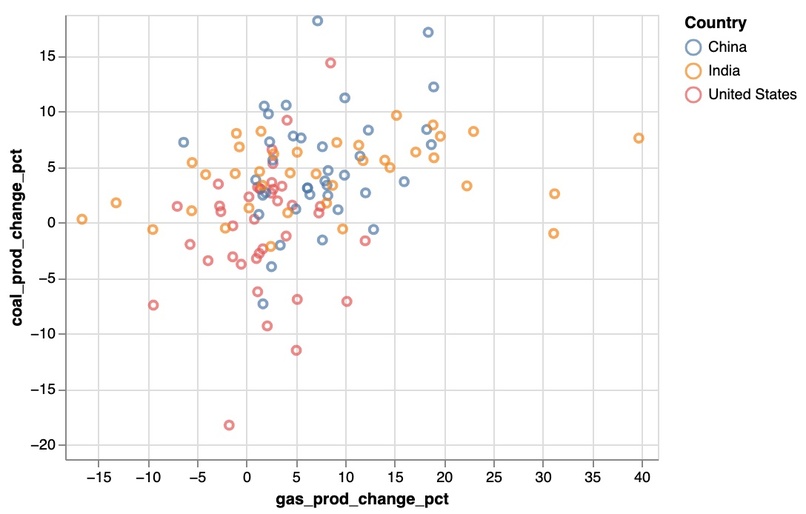
Graph 1
-
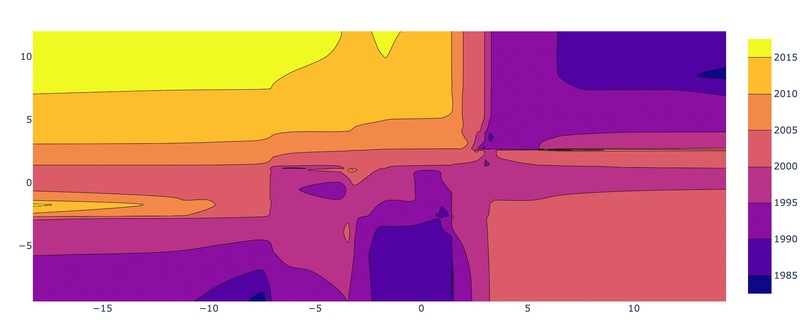
Graph 2
-
Homepage 1
-

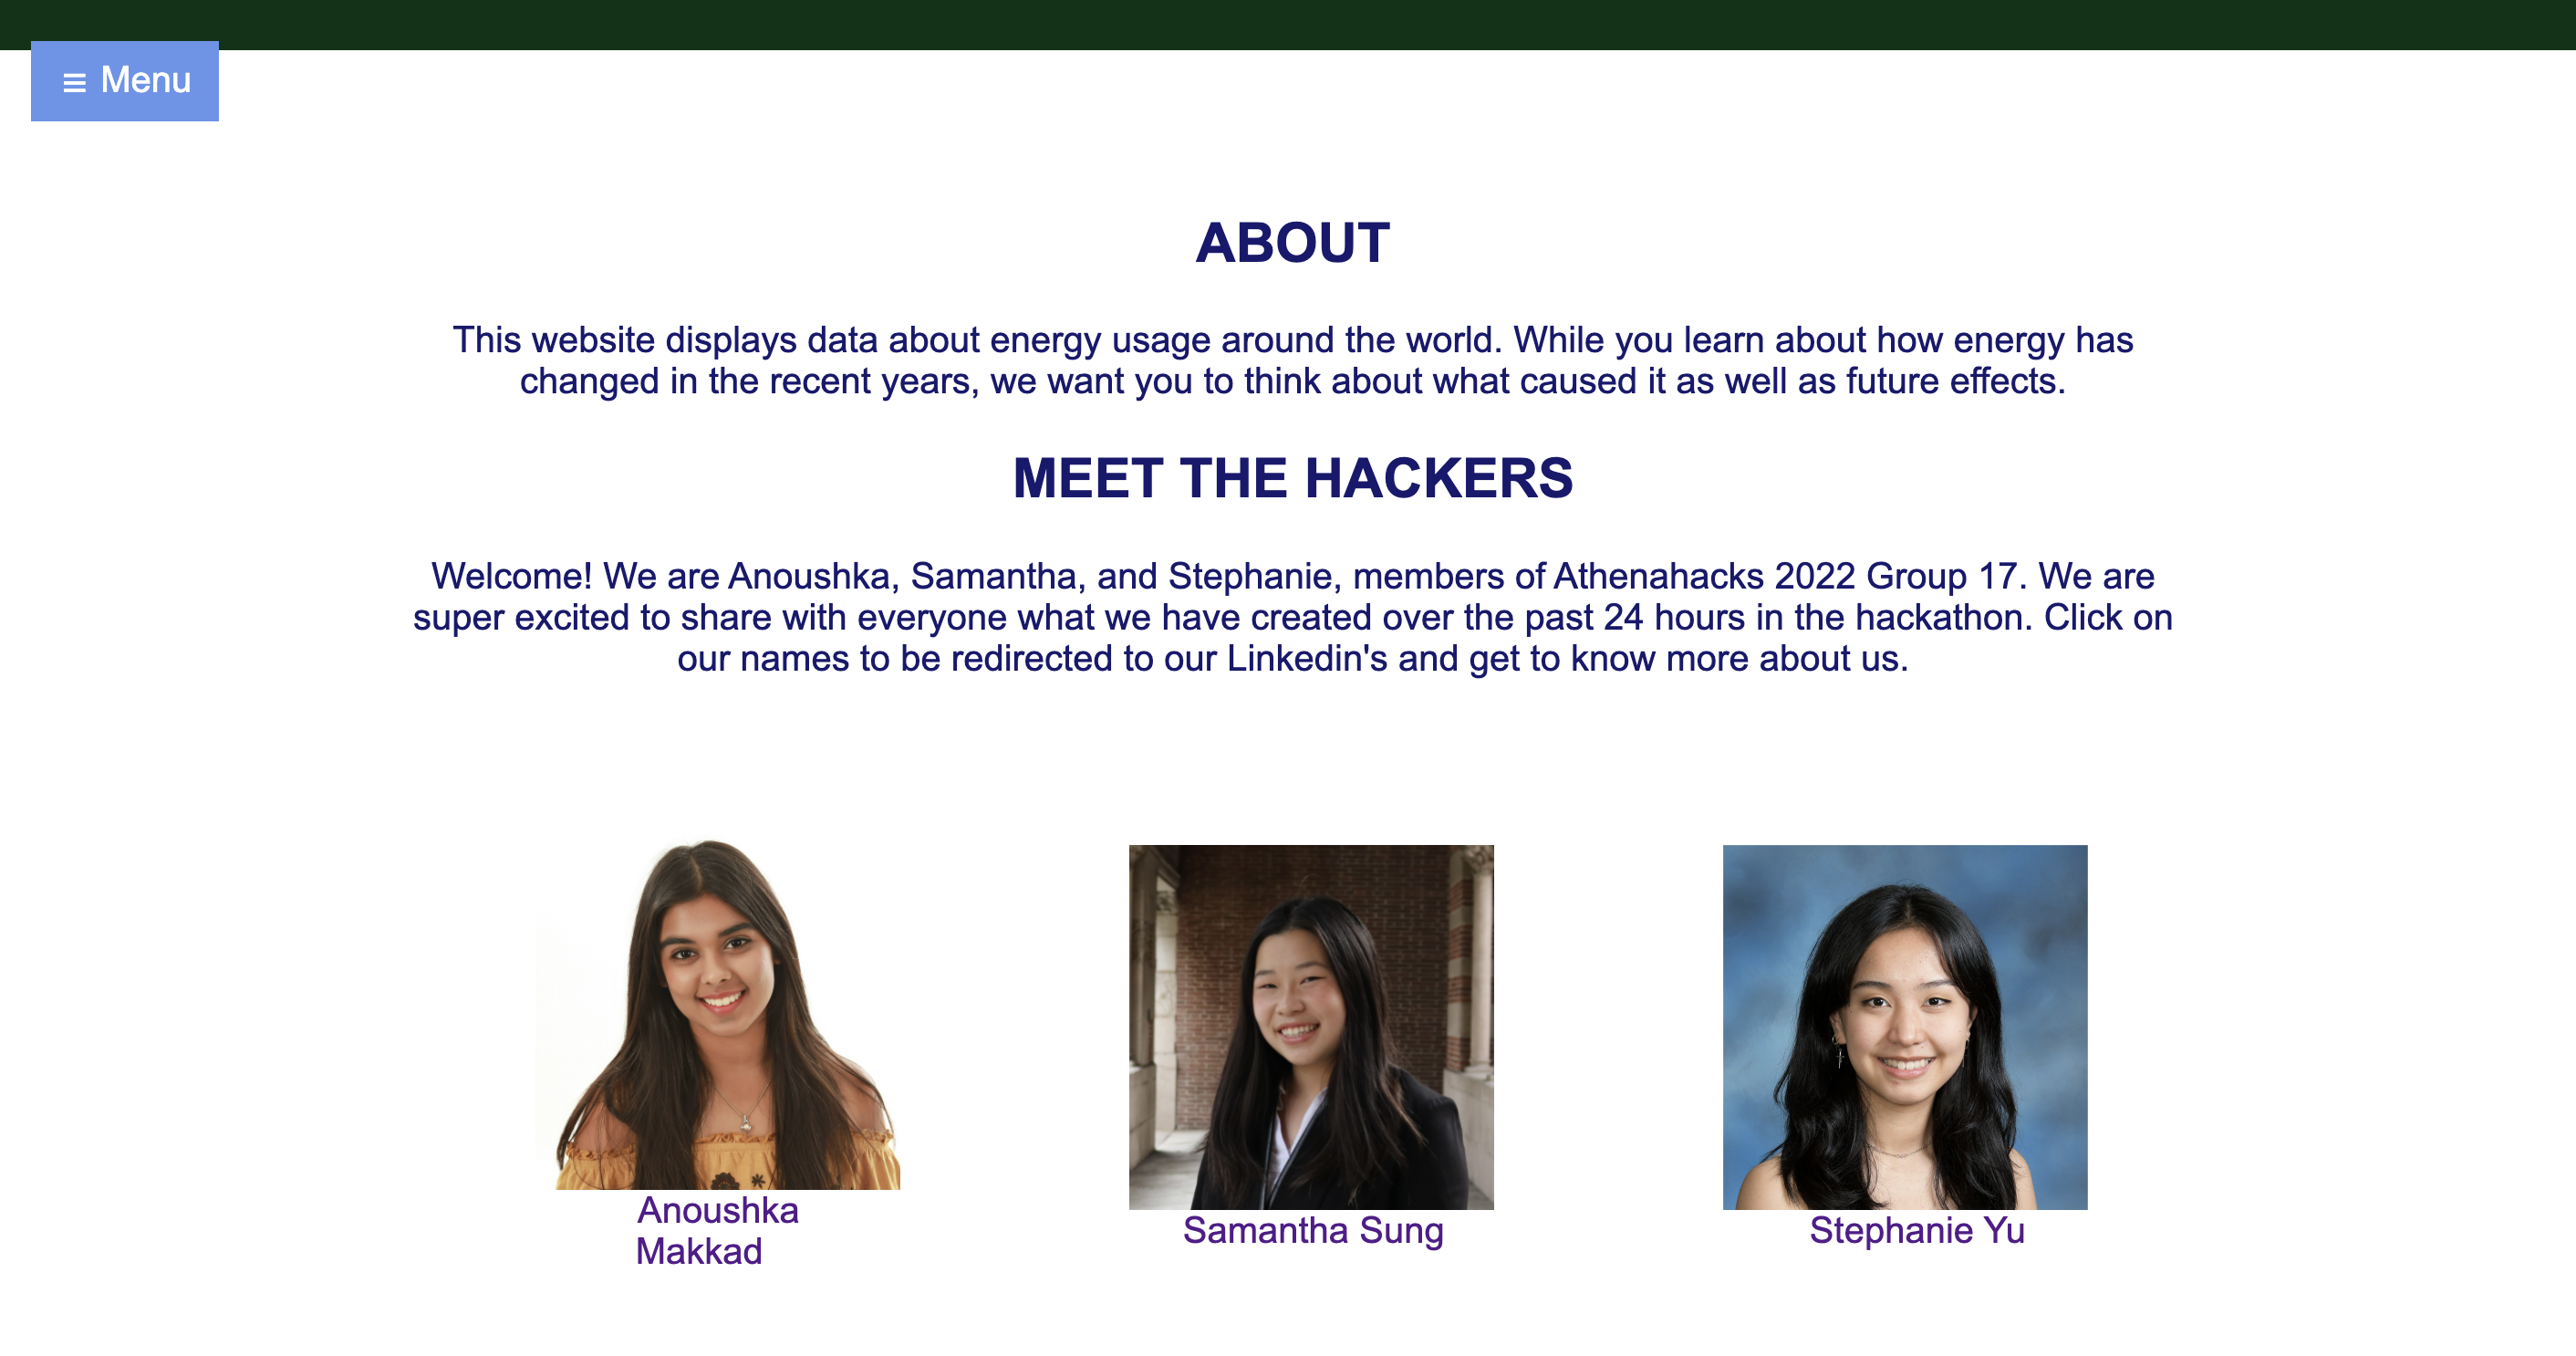
Homepage 2


Inspiration
Our inspiration was the change in energy consumption and production throughout the years. We wanted to see if there was a trend and why that was.
What it does
Our project is a website that displays energy data.
How we built it
We used HTML and CSS to create the website. Our graphs were created using Python on Google Colabs.
Challenges we ran into
We faced challenges with graphing, specifically using Pandas and Seaborne.
Accomplishments that we're proud of
We are proud of creating a pwetty website with pwetty graphs. As women in STEM, we were always looked down upon, but now we know that we can create a project from scratch all by ourselves.
What we learned
We learned that we can do it! We also learned how to implement different coding languages.
What's next for Energy
We want to explore more data sets and different methods of graphing energy consumption around the world.

Log in or sign up for Devpost to join the conversation.