-
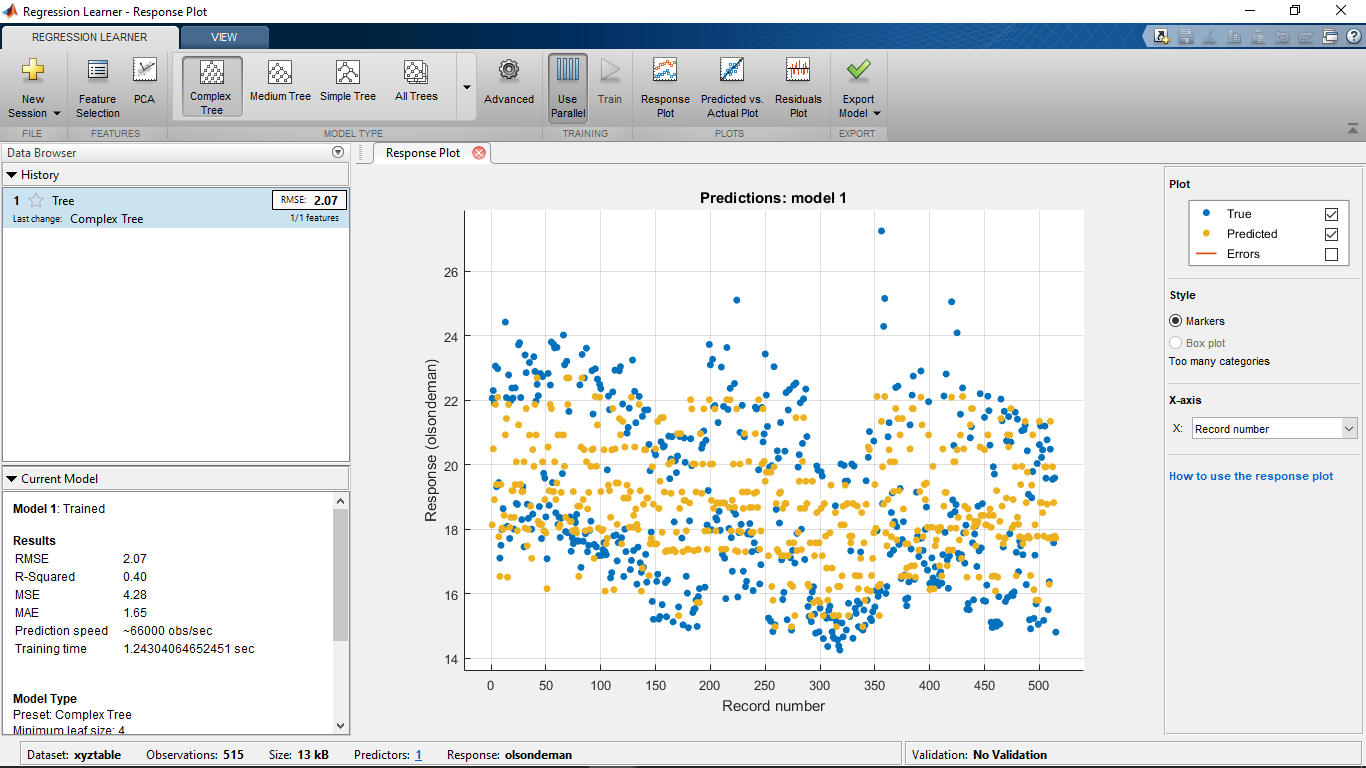
Olson Hall
-
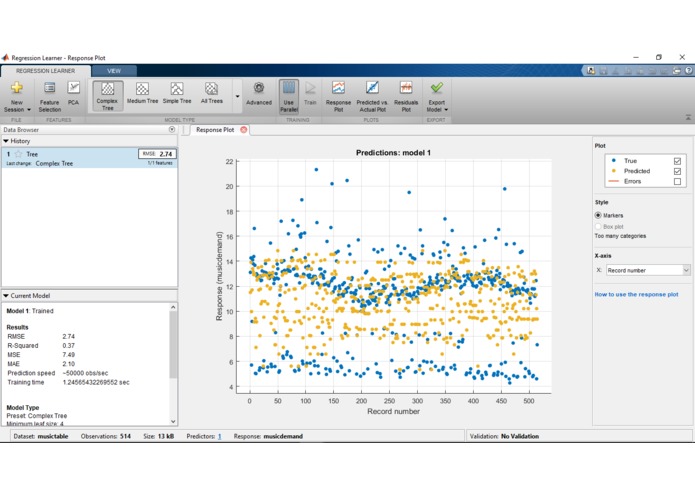
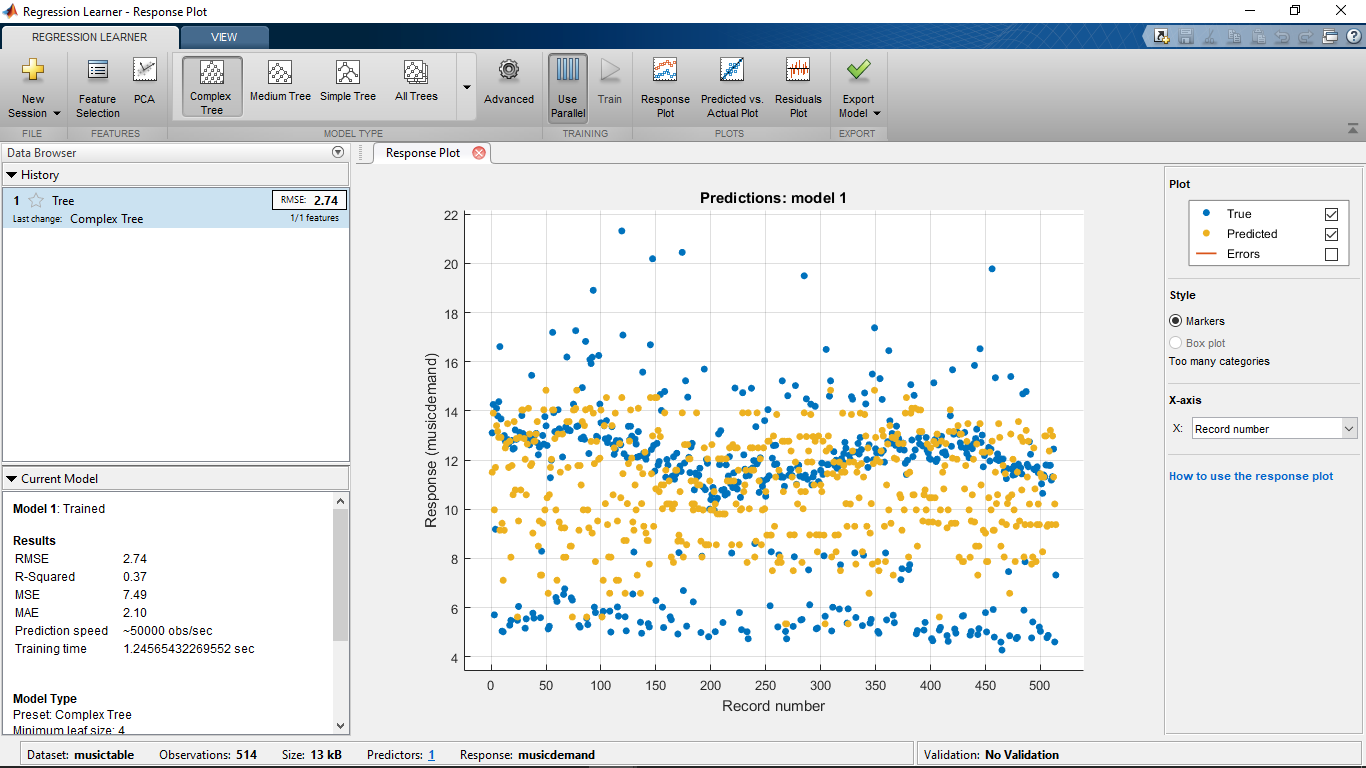
Music Hall
Inspiration
This is our first Hackathon ever! We wanted to learn something new. After OSIsoft's workshop, we were inspired to create something with PI Web API.
What it does
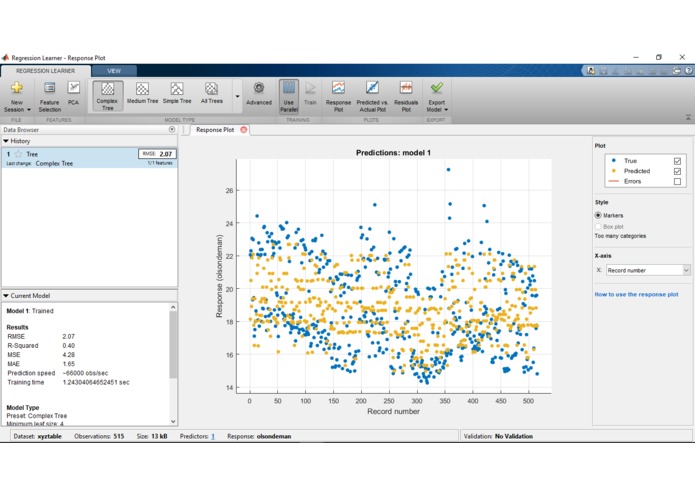
The MATLAB script uses data entered to create a prediction plot for the energy demand for a specific building.
How I built it
We used Python scripts to obtain the data from API. We then used the data in MATLAB to create relationships.
Challenges I ran into
We spent hours trying to obtain the correct range of data points from the API. The data we got from the API was excessive and redundant so we had to use a Python script to get the exact values for different dates.
Accomplishments that I'm proud of
We were able to learn and implement a new API. Derek and Shivam beforehand have never dealt with an API before! In addition, we were able to use data from our own college to not only create a environmentally sustainable usage of energy.
What I learned
Furthermore, we learned more about the weather through our graphs. For example, we observed that the weather takes on the shape of a sine wave.
What's next for Energgie
We want to see if we can obtain access to the API again to create another implementation of another data set with a greater scale. For example, we can see if there is data on Naji's college, Fresno State, and analyze the data there. Naji, who had to leave early, is already planning to email OSIsoft for access to start on it!

Log in or sign up for Devpost to join the conversation.