-
-

Loading screen
-
Main Page

Inspiration
Renewable grids don't fail because there isn't enough energy, they fail because the energy shows up at the wrong time. The sun sets right as the evening demand peak hits; the wind dies during a heat wave; and somewhere in that gap an operator has to decide in seconds which source to lean on and how hard to push the battery. We wanted to make that decision visible. Most energy dashboards show you numbers after the fact, and none of them let you break a grid on purpose and watch something intelligent put it back together and more importantly, tell you why it did what it did. Renewable dispatch is usually a black box of load-flow solvers and utility jargon, but we thought the reasoning was the interesting part, and that it should be the part you can actually see.
What it does
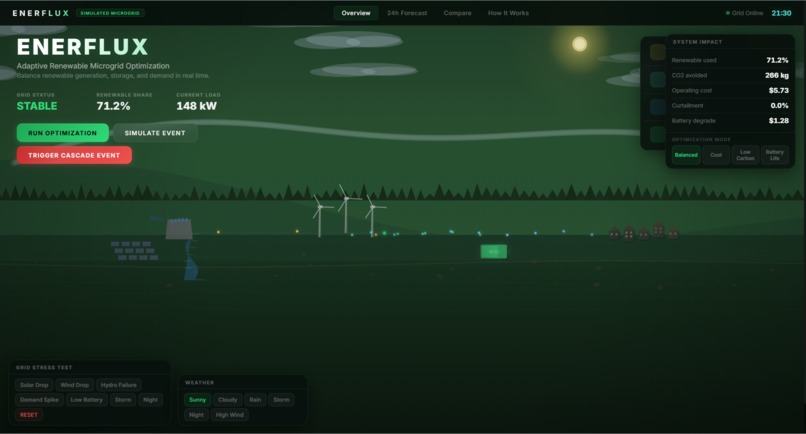
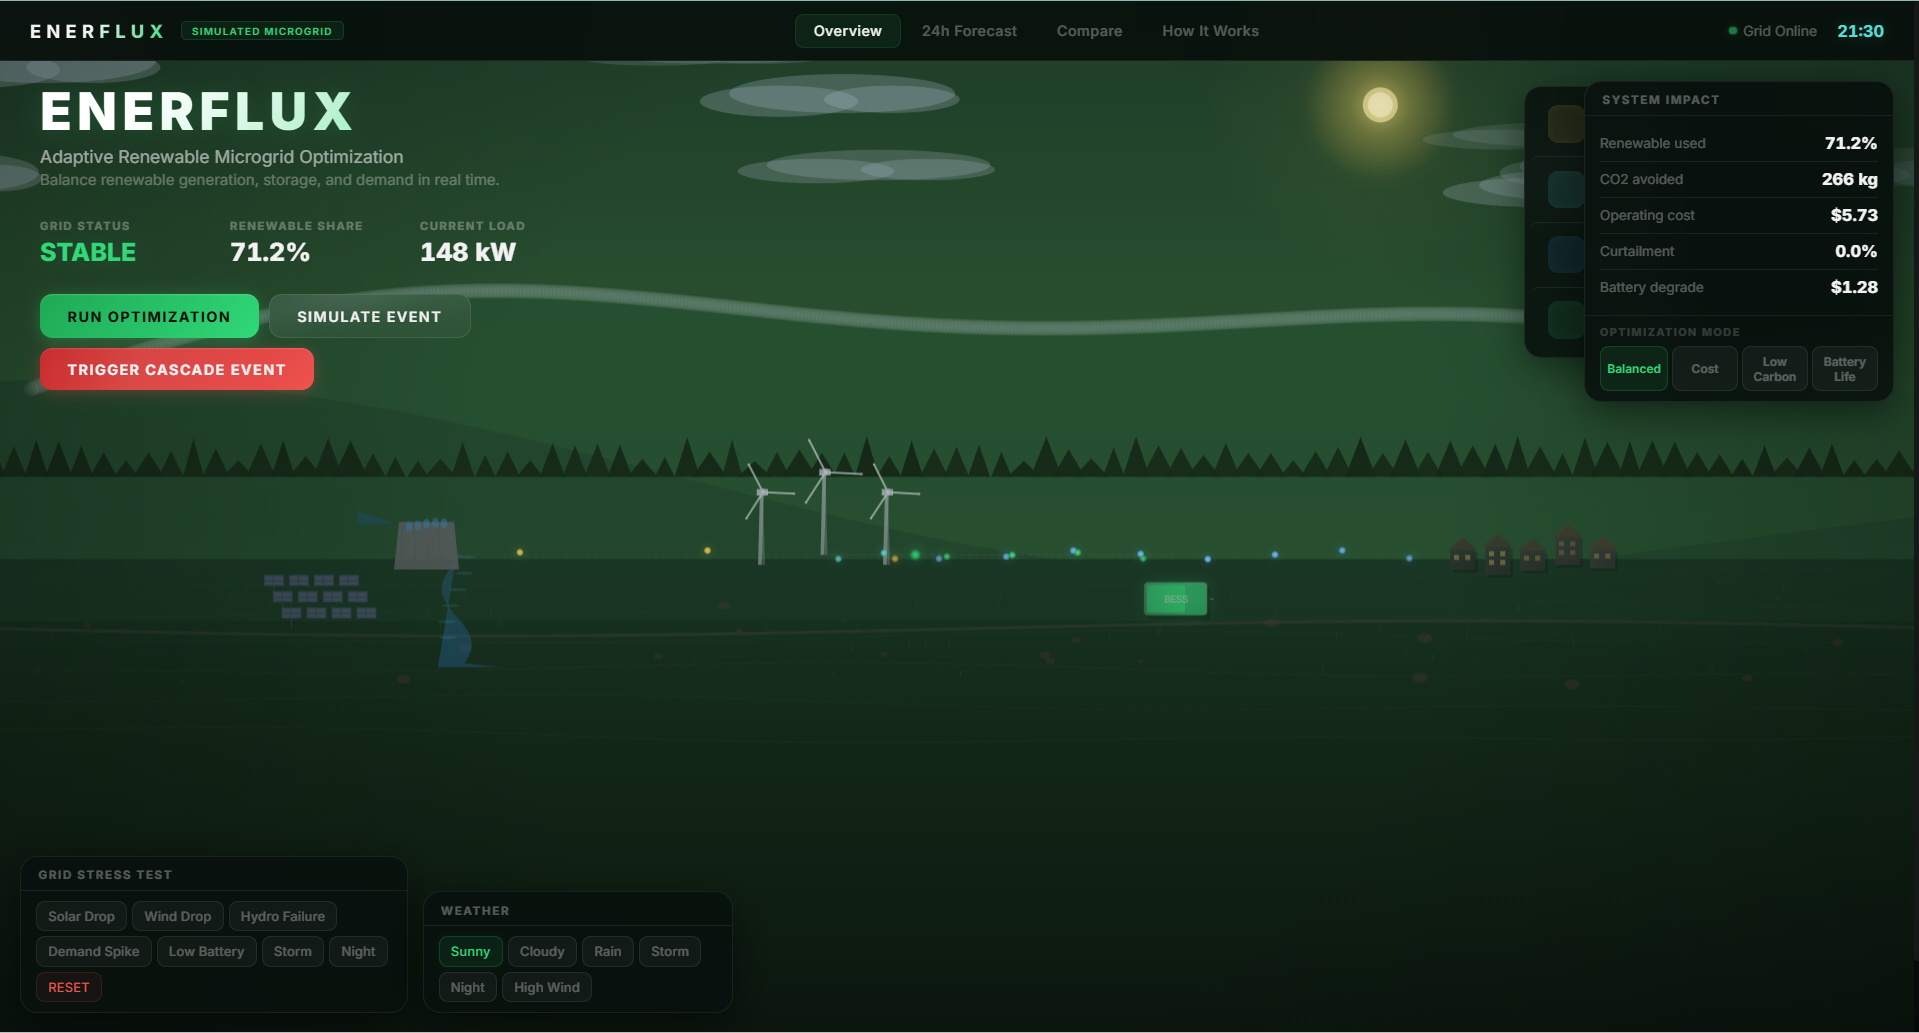
EnerFlux is an interactive microgrid simulator with a real optimization engine underneath. A physics-based simulation drives the whole system, solar follows an irradiance bell curve peaking at 13:00, wind runs a genuine turbine power curve (3 m/s cut-in, cubic ramp to rated at 12 m/s, 25 m/s cut-out), hydro tracks reservoir level and flow, and demand follows a dual-peak load curve split across residential, commercial, industrial, and public sectors. Every state change re-solves a weighted multi-objective dispatch over operating cost, CO₂, battery degradation, curtailment, and unserved demand, subject to per-source capacity limits, 10–100% state-of-charge bounds, and ±100 kW battery power limits, and four operator modes (Balanced, Cost, Low Carbon, Battery Life) re-weight that objective into visibly different dispatch decisions. Each solve emits a plain-English Observation → Constraint → Decision explanation, so you can read the reasoning rather than guess at it. You can stress the grid with seven one-click failures, solar drop, wind drop, hydro failure, demand spike, low battery, storm, night, or fire a cascade event that compromises several sources at once, spikes demand 50%, and drops the battery to 15%, then watch the optimizer stabilize it with a quantified before/after. A 24-hour forecast view projects all five signals across a full day with hour-by-hour scrubbing, and a head-to-head panel runs the same grid state through naive rule-based control and through EnerFlux to show the difference in cost, emissions, battery cycles, and unserved energy. All of it sits on an animated microgrid landscape that's bound to the simulation, panels darken as irradiance drops, turbines spin at speeds derived from actual wind output, and the sky changes with the weather.
How we built it
EnerFlux is React 19 + TypeScript on Vite, with zero runtime dependencies beyond React itself, no charting library, no 3D engine, no state management framework, no UI kit. The physics layer (simulation.ts) is pure functions mapping hour and weather to generation and demand, plus a 24-hour forward forecast generator. The decision layer (optimization.ts) scores each source by a mode-weighted blend of marginal cost, carbon intensity, and dispatch priority, sorts the merit order, greedily dispatches against demand, and then uses the battery as the balancing resource, discharging into a deficit or absorbing excess up to its SOC and power limits, computing operating cost, emissions, battery cycles, curtailment, and the natural-language explanation all in the same pass, so the narration can never drift from the math. A scenario layer (engine.ts) handles weather changes, clock ticks, and the eight stress events, snapshotting pre-event state so the UI can show a real before/after. The entire visual scene is a hand-written Canvas 2D renderer (~600 lines) that draws sky gradients, parallax mountains, animated clouds, solar arrays, turbines, flowing water, and power-flow lines procedurally from live state, and the state itself lives in a ~25-line store built on React's useSyncExternalStore with a silent update path so the 10 Hz cosmetic clock doesn't trigger a re-solve on every tick. Everything is deterministic and runs entirely in the browser: same inputs, same dispatch, every time, with nothing to deploy and no API keys.
Challenges we ran into
The hardest problem was making the optimizer's output legible without lying about it, our first explanation system was a separate templating layer that read the final dispatch and narrated it, and it drifted almost immediately, claiming the battery was charging when the numbers said otherwise, so we moved explanation generation inside the solver where it reads the same constraint variables the dispatch used. Getting the modes to actually differ was a close second: Cost and Carbon initially produced identical dispatch because with all-renewable sources the two merit orders coincided, and we had to introduce nonzero hydro marginal cost, per-source carbon intensities, and a battery-weight term before the modes told different stories. The battery turned out to be a genuine feedback loop, SOC constrains max charge and discharge, and the resulting dispatch then changes SOC, which took several passes on clamping and update ordering before it converged without oscillating or drifting out of bounds. On top of that, running a 60fps canvas, a ticking clock, and a re-solving optimizer through naive React state updates tanked the frame rate until we split cosmetic ticks from physically meaningful ones, and with no charting library, the entire 24-hour forecast plot, axes, gridlines, five overlaid series, fill gradients, and a hover-to-scrub cursor, had to be built from manual Canvas 2D path math.
Accomplishments that we're proud of
The optimizer is real rather than a prop: it solves a genuine constrained multi-objective dispatch problem with capacity, SOC, and power limits, and the naive-vs-optimized comparison exists specifically so anyone can verify the optimization is doing measurable work. Explainability is built in rather than bolted on, every decision arrives with the observations that drove it and the constraints that bounded it, which is the thing we most wanted from an energy tool and never found in one. The cascade failure demo is the moment the whole project justifies itself: multiple sources compromised, demand spiking 50%, battery at 15%, and the grid recovers in a single click with the recovery quantified in unmet kWh. We're also proud that it's nearly dependency-free, the landscape, the charts, the state layer, the physics, and the optimizer are all ours, roughly 60 KB of our own TypeScript on top of React, and that the visualization is bound to the simulation rather than decorative: panel darkness is irradiance, turbine RPM is wind output, and nothing on screen is faked animation.
What we learned
Greedy merit-order dispatch gets you surprisingly far, for a single-node microgrid with one storage asset, sorting by weighted marginal cost and filling demand in order lands close to optimal, because the complexity in real dispatch comes from network topology and multi-period commitment rather than from the single-period choice. Storage is where the actual difficulty lives: every hard modeling decision in this project was about the battery, degradation cost, SOC floors, charge/discharge asymmetry, when curtailment beats cycling, while generation was comparatively easy. We also learned that multi-objective optimization is mostly a weights problem, since the solver itself is straightforward and the real modeling work is deciding how many dollars of battery wear a kilogram of CO₂ is worth, which is a policy question wearing a math costume. Committing to explaining every decision turned out to constrain the implementation in a useful way, we couldn't hide anything in an opaque numerical step, and the code is better for it. And curtailment is genuinely counterintuitive: throwing away free renewable energy is sometimes the correct call when the battery is full and demand is low, because the alternative is cycling the battery for no benefit.
What's next for EnerFlux
The biggest step is replacing the greedy solver with a true LP/MILP formulation driven by a rolling-horizon model-predictive controller, so dispatch optimizes over the next 24 hours instead of the current instant, charging cheaply now because the solver knows a deficit is coming at 18:00. From there we want real data (NREL NSRDB solar and NOAA wind feeds for a chosen location, so the simulation runs against actual historical weather instead of parametric curves), grid interconnection with time-of-use import/export pricing that turns the objective into genuine economic dispatch, and multi-node topology with transmission constraints and line losses, where dispatch stops being one decision and becomes a network flow problem. We'd also replace the linear battery cycle-cost approximation with physics-based degradation via rainflow cycle counting and depth-of-discharge-dependent aging, add EV fleets and demand response as controllable loads so the optimizer can shift demand rather than only chase it, and build scenario export so someone can save a stress case, share it, and challenge another person to beat the optimizer's result, turning EnerFlux into something operators and students can actually train on.

Log in or sign up for Devpost to join the conversation.