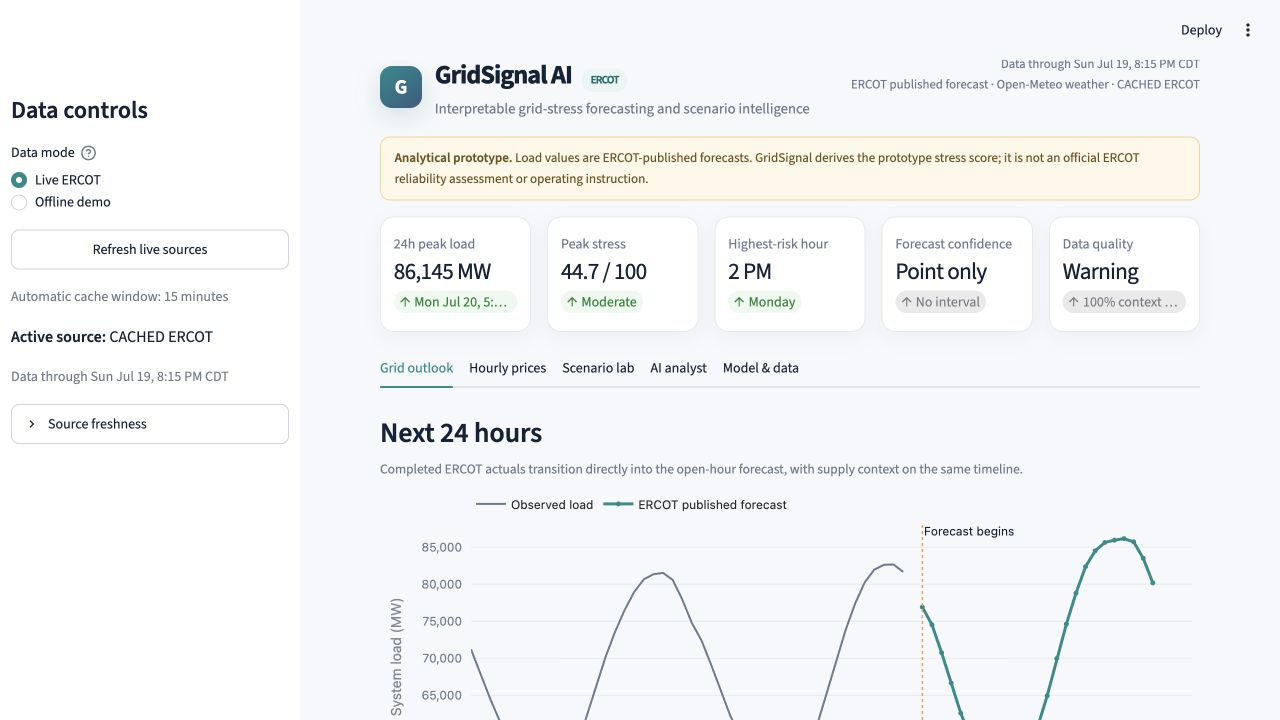
GridSignal AI
Why I built it
Power-market analysis rarely starts with a clean dataset. Load, renewable forecasts, outages, weather, reserves, and prices all arrive from different places and on different schedules. Even after the data is collected, an analyst still has to answer the harder questions: What changed? Which hours deserve attention? Is the signal real, or is it just a data issue?
I built GridSignal AI because I wanted to explore what an analytical copilot for that workflow could look like. The goal was not to add a chatbot to a dashboard. It was to build a tool that could forecast near-term conditions, show its work, let the user test assumptions, and then use AI to explain results that had already been calculated and verified.
The current prototype focuses on ERCOT, where weather, renewable output, outages, and demand can create very different conditions from one hour to the next.
What it does
GridSignal AI brings several parts of the analyst workflow into one Streamlit application:
- A continuous view of recent ERCOT load and the published forward outlook
- Near-term load and grid-stress forecasts
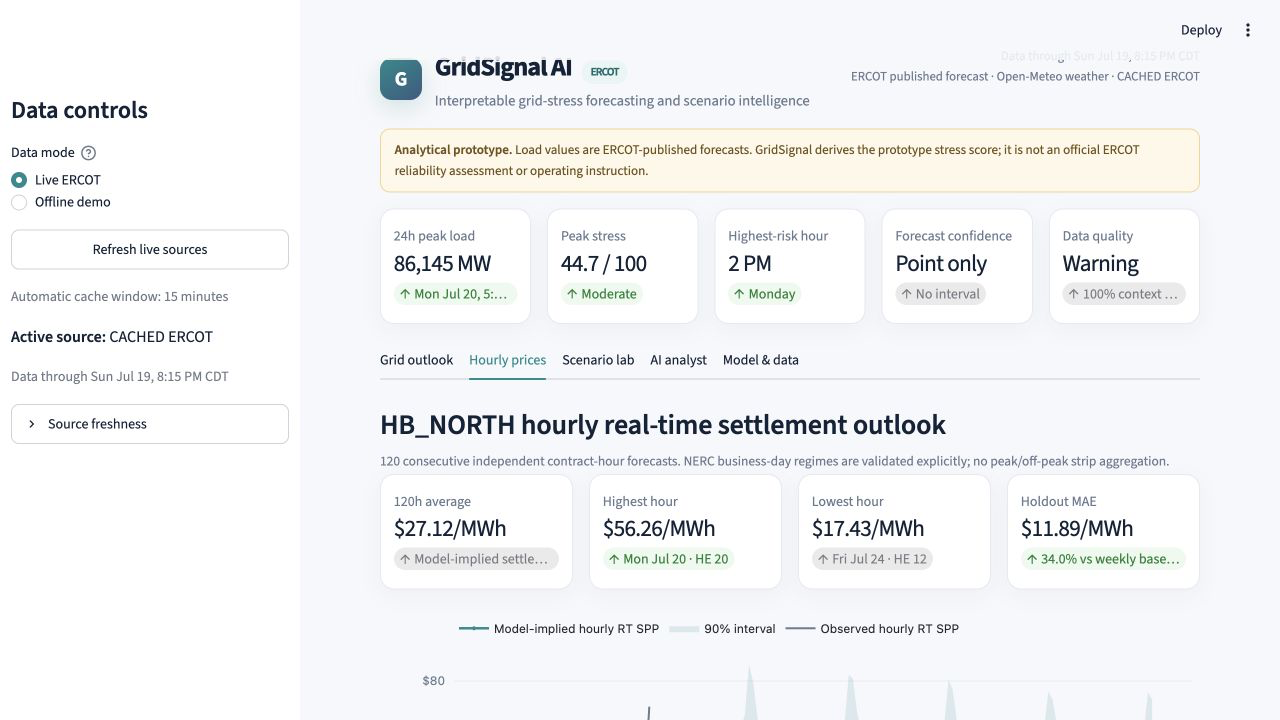
- A 120-hour forecast for
HB_NORTHreal-time settlement prices - Hour-by-hour explanations of the main stress drivers
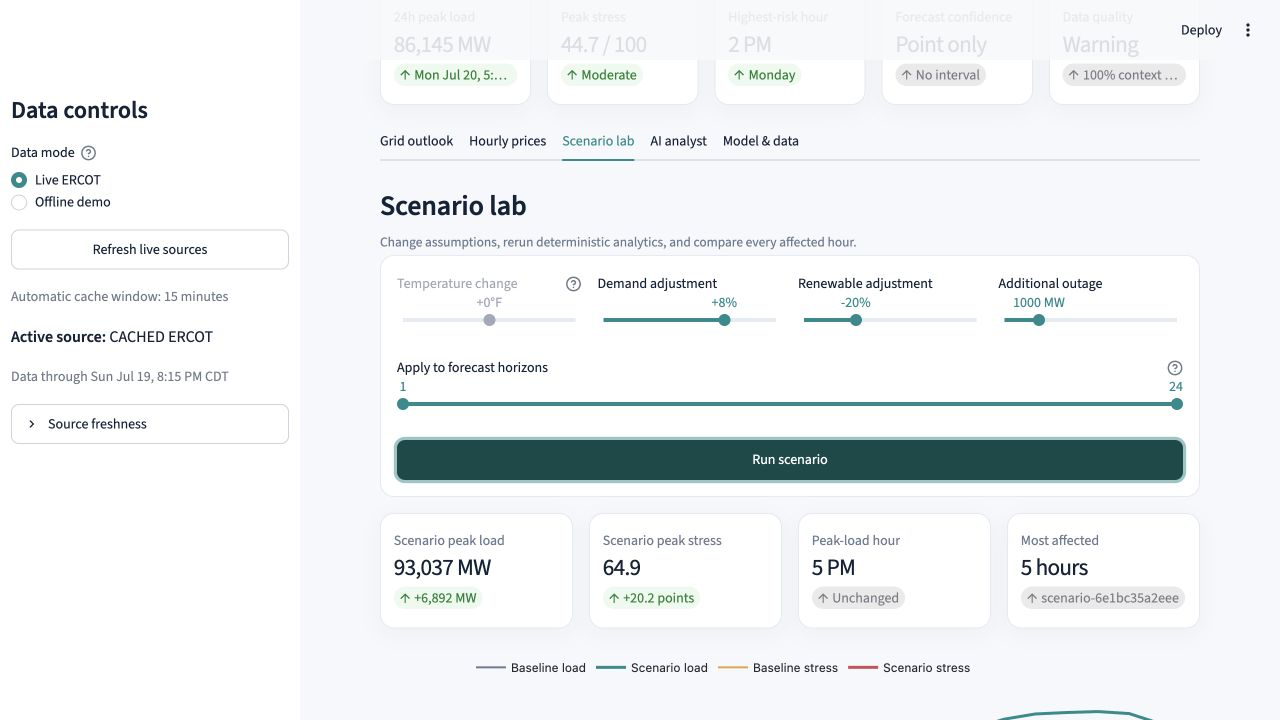
- Scenario testing for demand, temperature, renewable output, and outages
- A grounded AI Analyst that answers questions using structured backend tools
- Model metrics, data freshness, source timestamps, and quality warnings
One design decision mattered throughout the project: the app should always make it clear whether a number is observed, published by ERCOT, predicted by a model, changed by a scenario, or summarized by AI. Those categories are easy to blur in a polished dashboard, so I treated provenance as part of the product rather than a footnote.
GridSignal AI is a decision-support prototype, not an official ERCOT reliability assessment and not a tool for operating the grid.
How I built it
The application is written in Python and organized into separate layers for data ingestion, validation, forecasting, scenarios, explainability, and AI interaction. Streamlit provides the interface, while Plotly is used for the hourly timelines, risk scans, price heatmaps, driver views, and baseline-versus-scenario comparisons.
Data and forecasting
The live pipeline connects to ERCOT public data and Open-Meteo weather forecasts. It combines recent system load, ERCOT's seven-day load forecast, wind and solar forecasts, adequacy and outage context, weather, and historical HB_NORTH prices.
Because those sources do not line up neatly, I added a reconciliation layer that joins completed historical intervals, current-day actuals, and future forecast hours without quietly treating forecasts as observations. Important fields retain their source, unit, and timestamp, and missing or stale inputs surface as warnings.
For forecasting, I used time-based training, validation, and holdout periods so future observations could not leak into earlier predictions. The app compares seasonal and persistence baselines with tree-based models instead of assuming that a more complex model is automatically better. Price behavior is also evaluated separately for weekdays and non-working days, including NERC holidays. A specialized model is kept only when it shows a real validation improvement.
The grid_stress_score is deliberately transparent. It ranges from 0 to 100 and is built from visible components such as load pressure, capacity headroom, renewable shortfall, outages, weather anomalies, and forecast uncertainty. It is an analytical signal for the prototype—not a claim that I recreated an ERCOT reliability metric.
Scenario Lab
The Scenario Lab starts with a copy of the baseline inputs and changes only the assumptions selected by the user. A user can adjust temperature, demand, renewable generation, or outage capacity and then see the effect on every forecast hour.
I kept this part deterministic. The engine, not the language model, calculates the new peak, timing shift, stress change, and hourly differences. That makes it possible to compare two runs and understand exactly why the result moved.
The AI Analyst
The AI Analyst uses the OpenAI Responses API, but it does not receive permission to invent calculations. It works through a small set of typed tools for retrieving forecasts, inspecting stress drivers, comparing historical days, running scenarios, reading model metrics, and checking data quality.
Numerical claims are checked against evidence returned by those tools. If a response cannot be grounded, the app falls back safely instead of presenting a fluent but unsupported answer. This constraint made the AI less flashy in a few edge cases, but much more useful for the kind of questions the app is meant to answer.
The hardest parts
Creating one continuous outlook
ERCOT's historical load, current-day actuals, and forward forecasts have different reporting boundaries and publication times. Joining them into one chart sounds simple until the current day is only partially complete. I had to preserve the boundary between actual and forecast values while still giving the user a continuous timeline.
Working with live data
ERCOT access involves subscription credentials, an OAuth identity-token flow, pagination, report-specific schemas, and different freshness expectations. I built reusable adapters, bounded caching, freshness checks, and explicit status messages rather than scattering API calls throughout the dashboard.
The demo also needed to remain usable when credentials, network access, or an upstream service were unavailable. For that reason, the project includes deterministic synthetic data and graceful offline behavior. Synthetic values are prominently labeled and are never presented as live ERCOT data.
Forecasting volatile prices
Hourly real-time power prices are noisy, and a model can look impressive while still losing to a simple baseline out of sample. Weekends and holidays also behave differently from normal weekdays. I tested pooled and regime-aware approaches and used the validation period to select the champion. In cases where the specialized version did not improve enough, the app keeps the simpler model.
Keeping AI answers honest
The most important AI challenge was not prompt wording. It was deciding what the model should never be responsible for. Prices, scenario outputs, stress components, and metrics all come from deterministic code. The model's job is to retrieve the right evidence, connect it, and explain it clearly. Typed schemas, evidence IDs, bounded tool loops, and numerical checks ended up being as important as the interface itself.
What I learned
This project changed how I think about analytical AI products. A language model can make a complicated system easier to explore, but it should not become the system's source of truth. The useful division of labor is straightforward: code performs the calculations; the model helps the user navigate and interpret them.
I also learned that interpretability is not just a modeling feature. Visible assumptions, source timestamps, uncertainty ranges, baseline comparisons, and data-quality warnings all affect whether someone can trust an answer. In an energy-market application, details such as time zones, daylight-saving transitions, holidays, forecast cutoffs, and publication delays are not cleanup work. They are part of the analysis.
What's next
The next step would be to test the workflow with more historical market regimes and improve scarcity and price-spike modeling. I would also like to add probabilistic forecasts, historical analogue search, model-drift monitoring, and support for more ERCOT hubs and settlement points. Longer term, the same approach could be extended to portfolio-level hourly analysis and other markets such as PJM.
GridSignal AI is my attempt to show that forecasting, scenario analysis, explainability, and grounded tool calling can work together in one practical analyst workflow.
Built With
- api
- chatgpt
- energy
- ercot
- pyarrow
- pydantic
- python
- ruff
- scikit-learn
- streamlit
- structlog
- time-series-forecasting
- uv
- xgboost


Log in or sign up for Devpost to join the conversation.