-
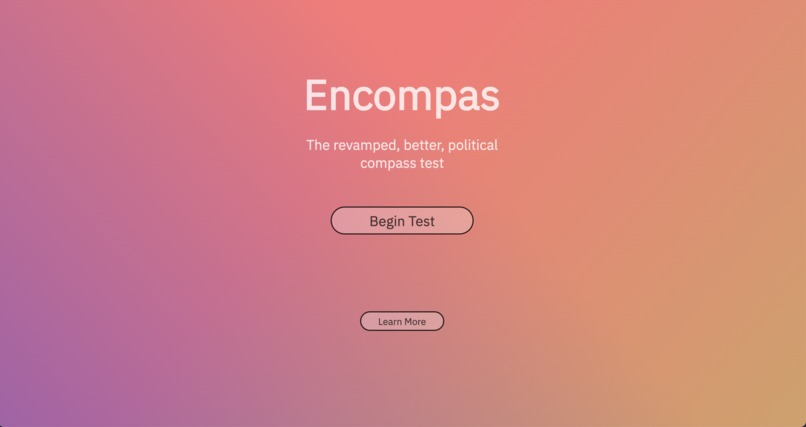
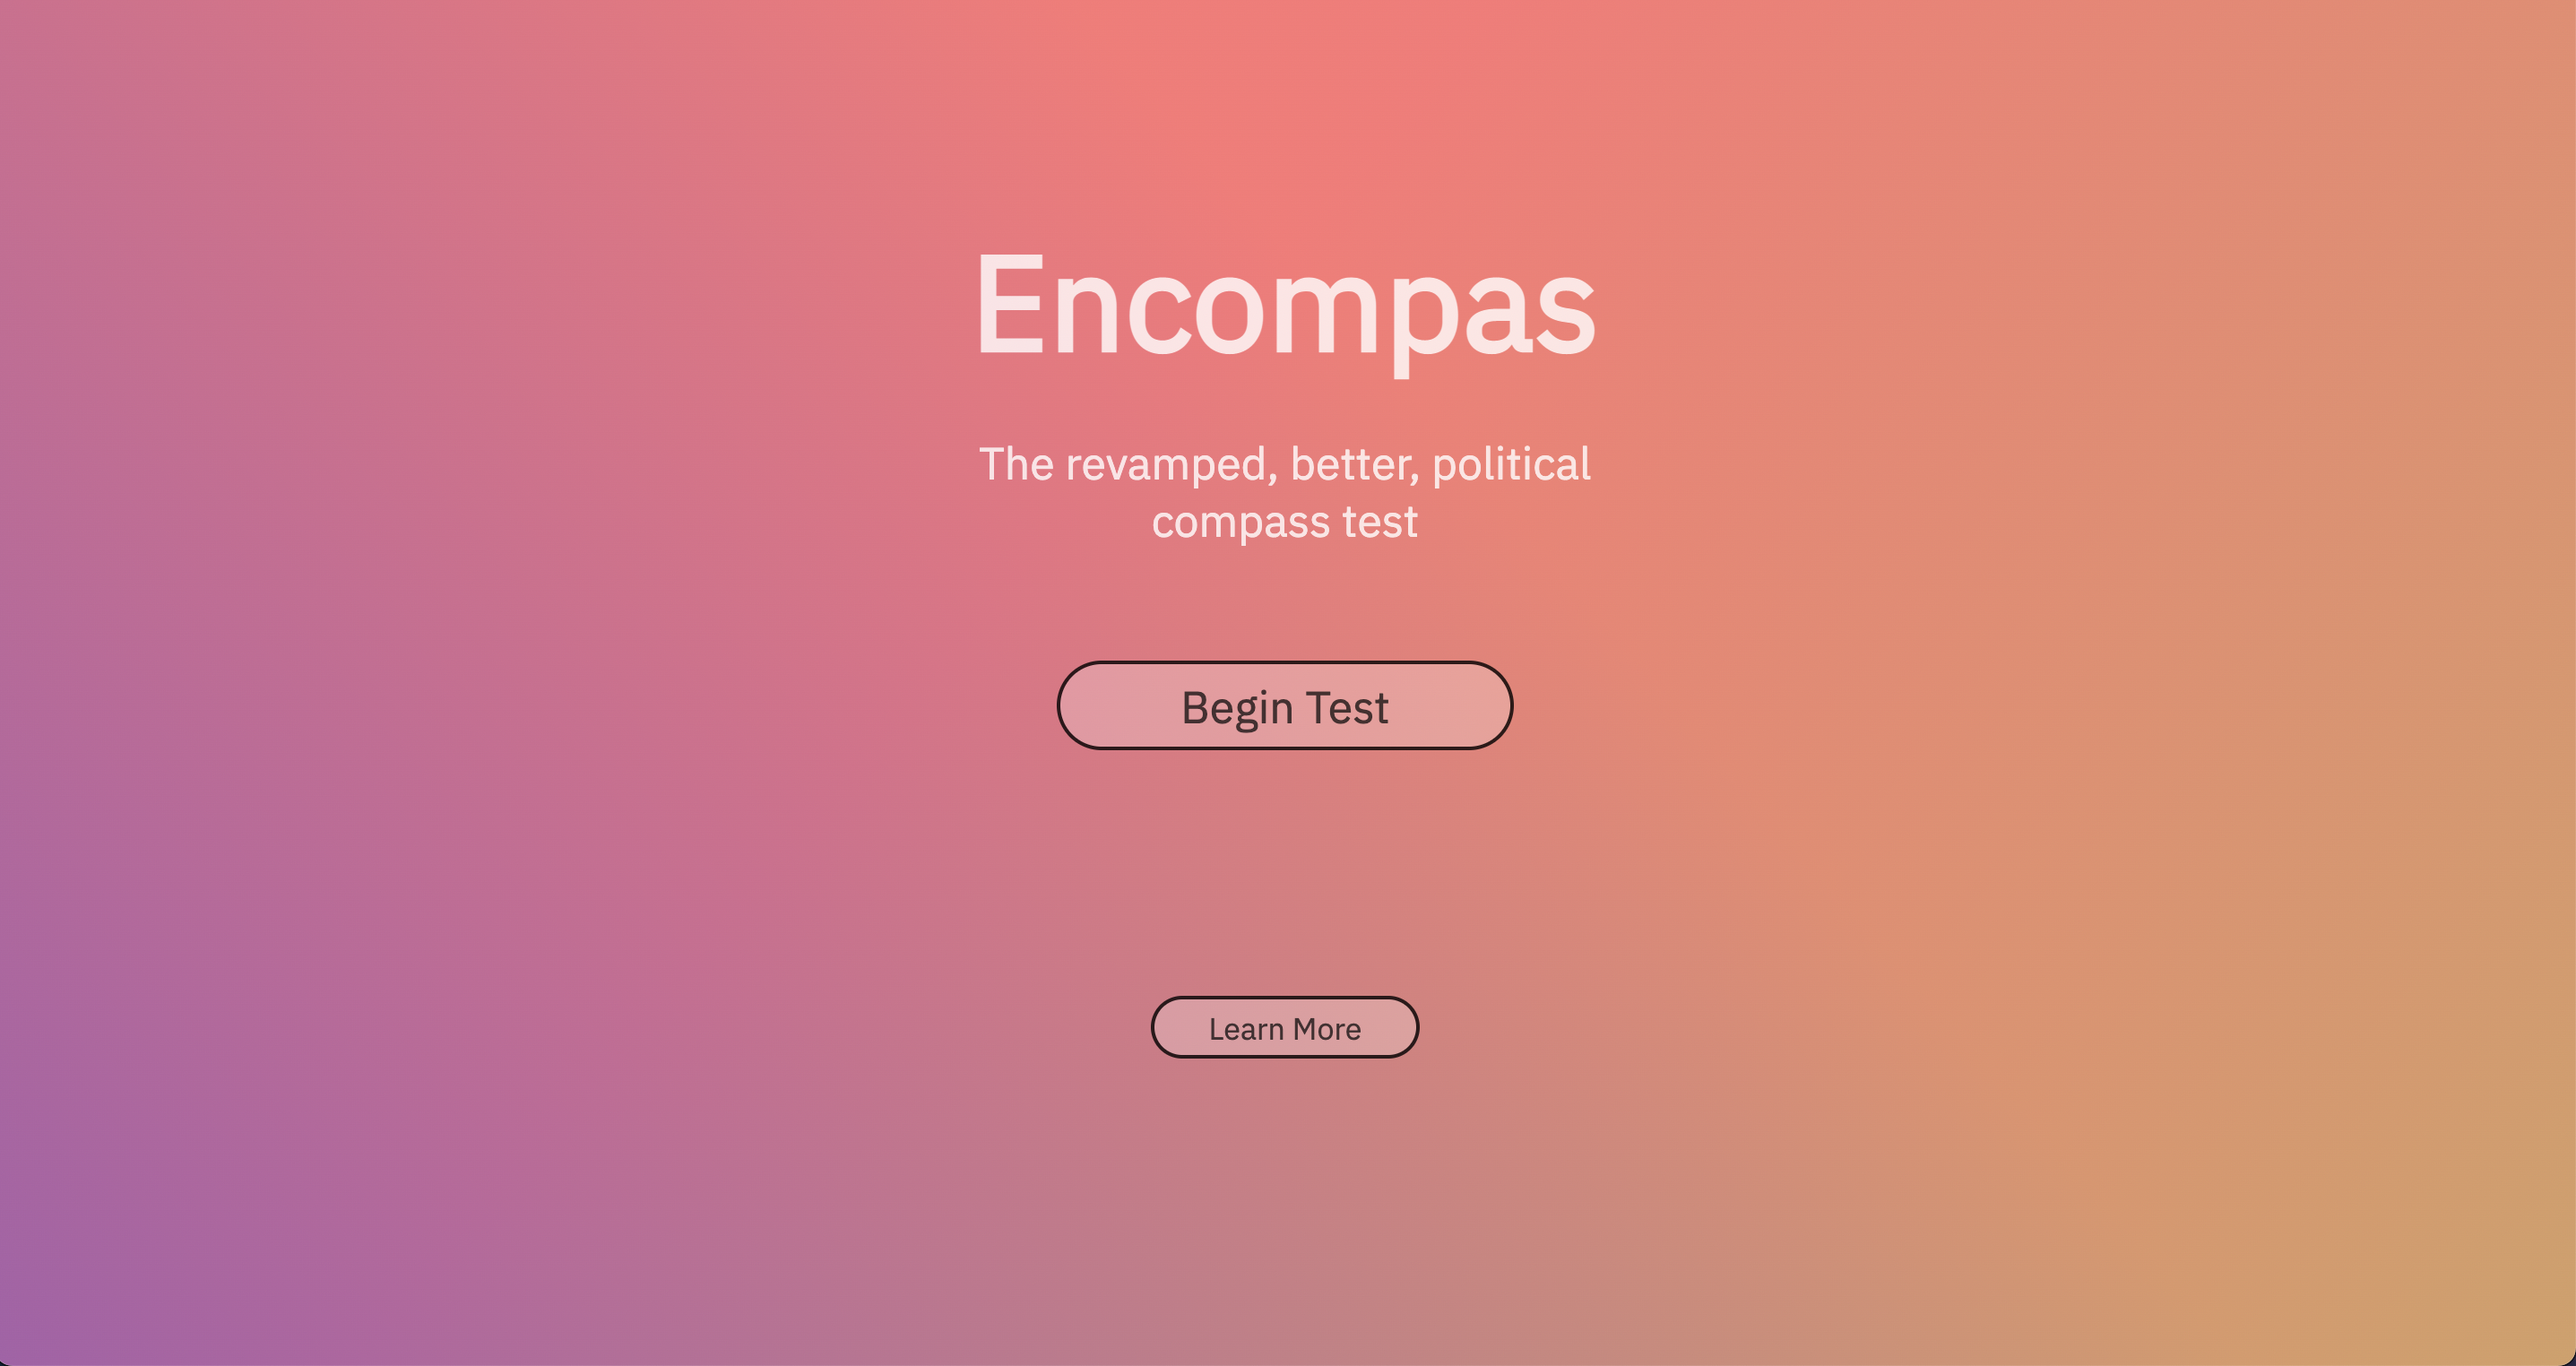
The Home Screen
-

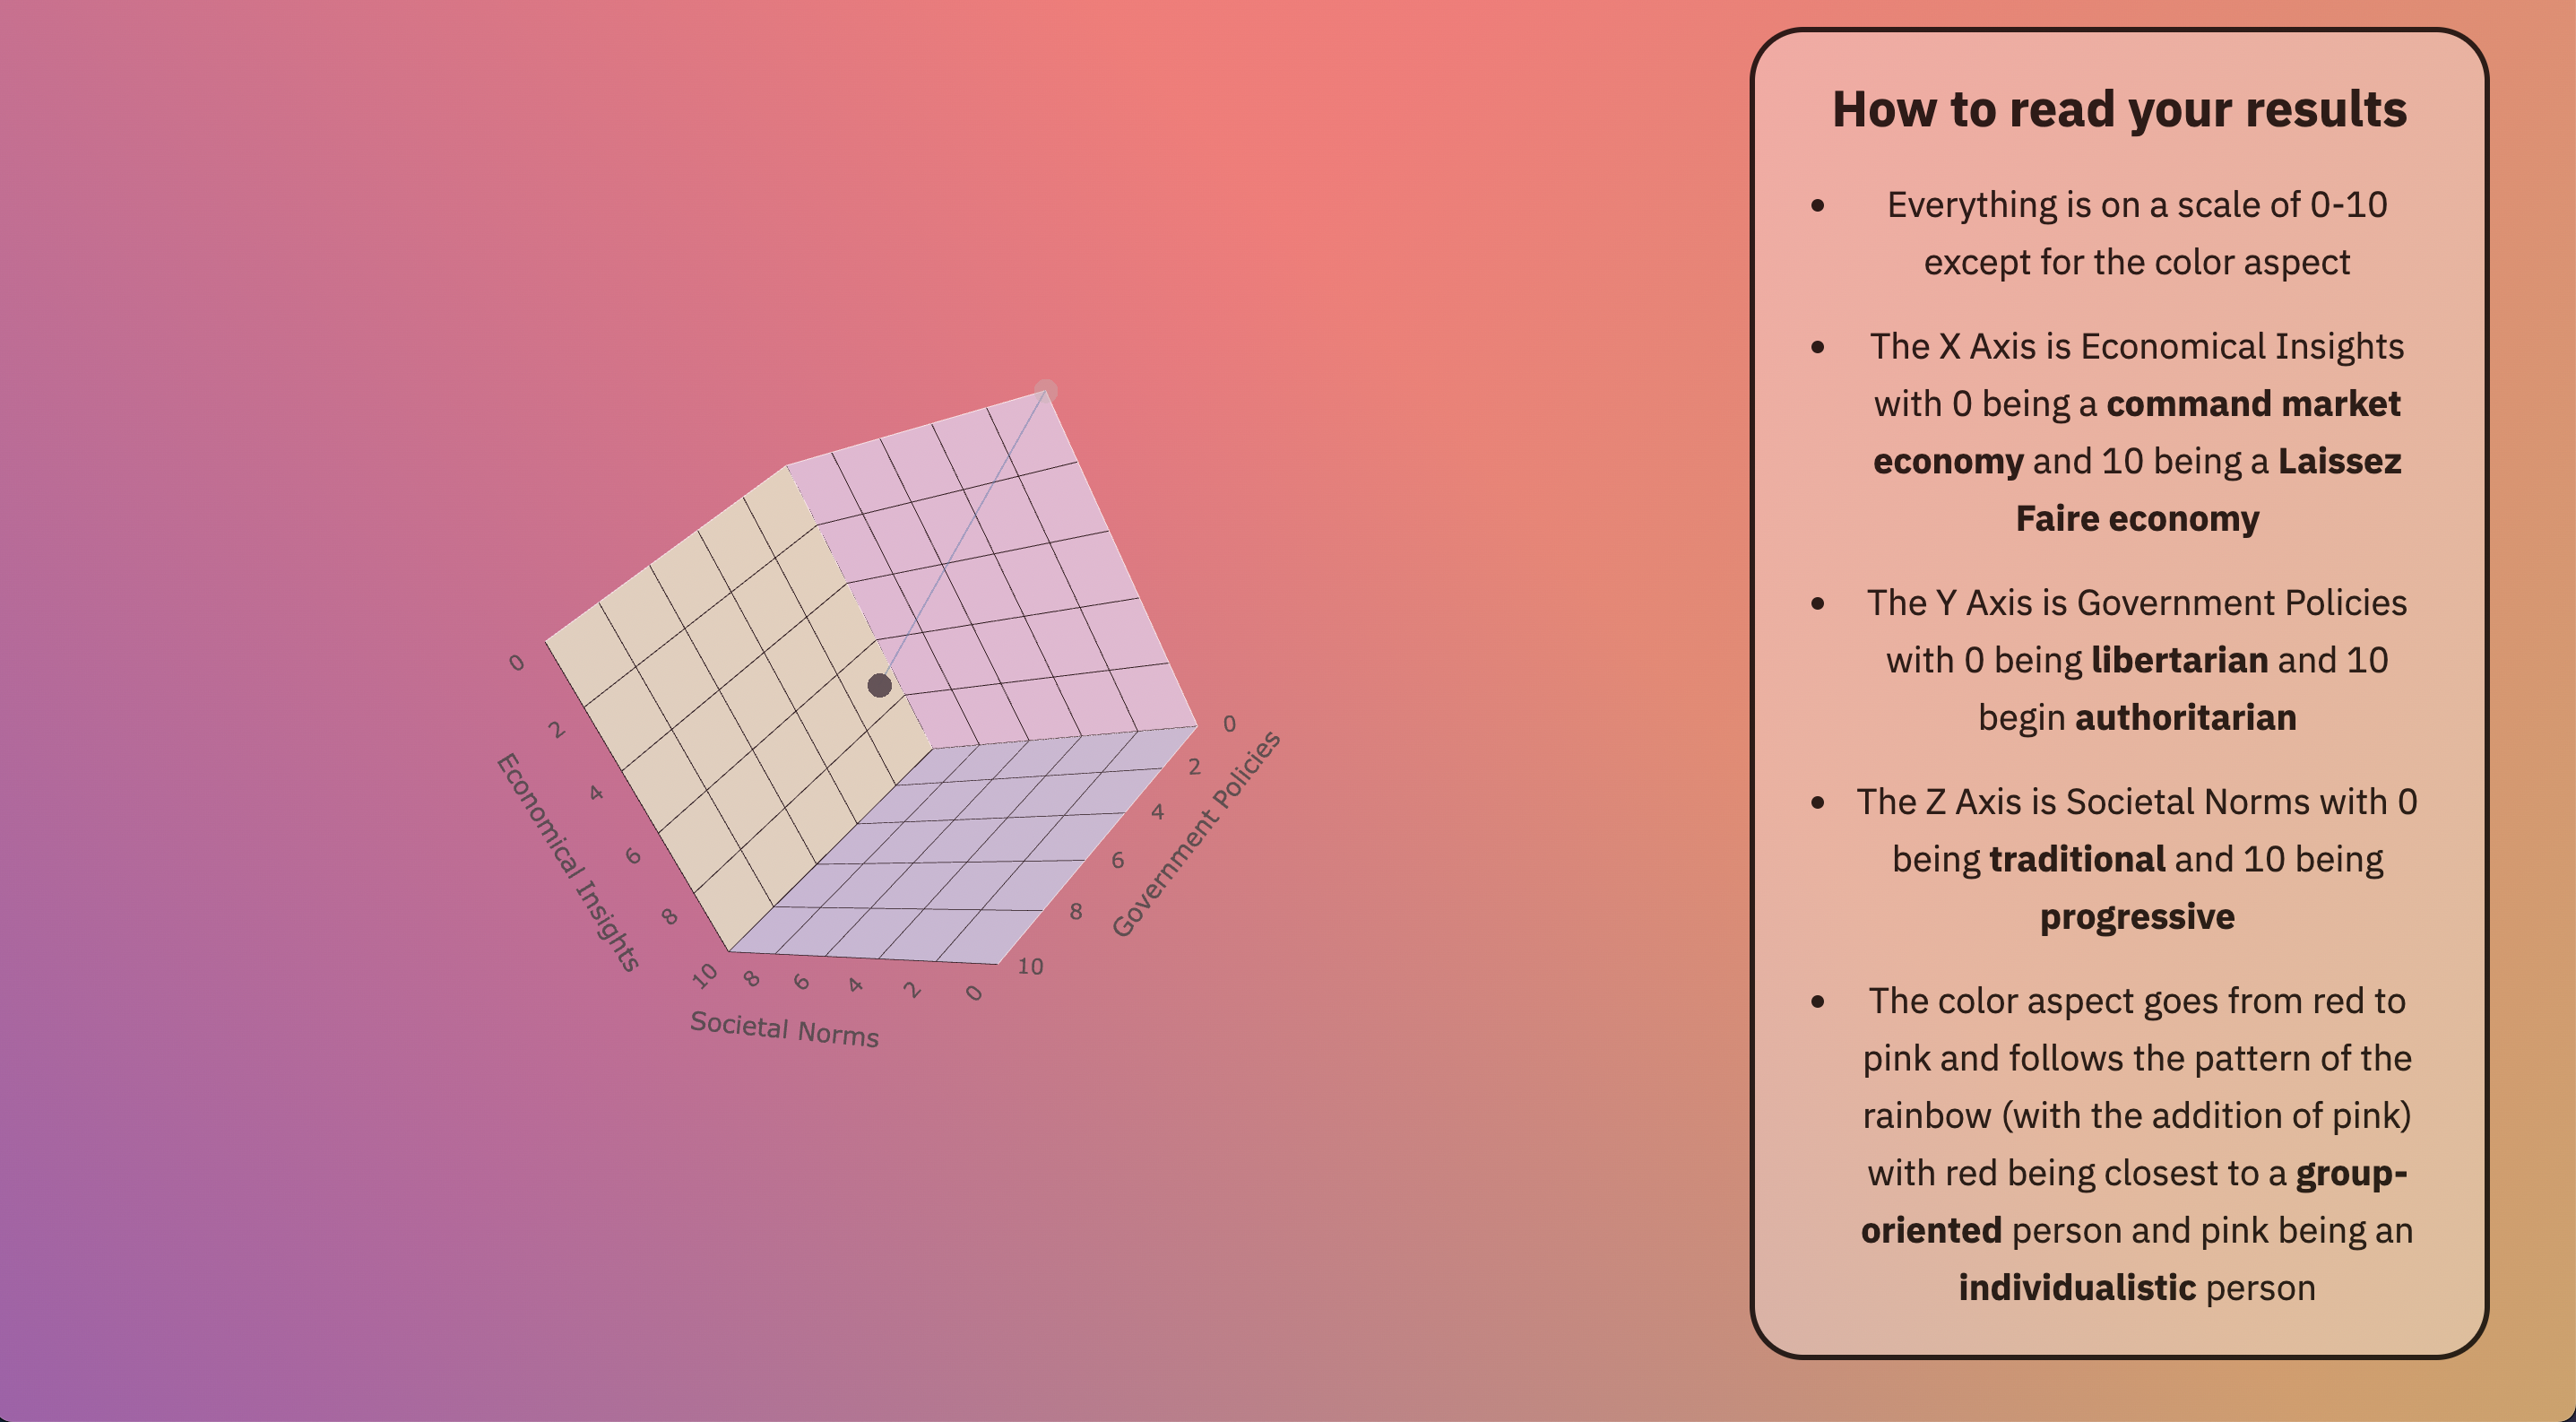
The Results Screen
Encompas
Go to encompas.tech to view our site which is hosted via GitHub Pages
Inspiration ✨
In a world where a persons values define how they live, being able to accurately determine your stance on world issues is vital. We immediately noticed that all the current surveys that help determine your stance are extremely outdated, vague, or inaccurate.
What it does ❓
Encompas allows users to vizualize where they stand on the political compass via a 4d graph. This graph includes 3 space dimensions and 1 color dimension. By allowing users to answer questions with a slider instead of the traditional agree or disagree options, we can more accurately score each individual user. This survey begins by asking a series of questions that gauges the users macro world view. After it acquires this data, it focuses in on more specific values and opinions.
How we built it 🛠️
Encompas began by using Google's FireBase to create an interactive and intuitive UI. After finishing the UI, we gathered potential questions and used those questions to create a scoring system. This scoring system was then connected to a 4d model via Plotly.js. Finally, we created a script to display why a user was put into a specific category.
Challenges we ran into 😧
We had trouble properly implementing a 4D scale via Plotly. Additionally, being able store each data point and value while connectecting it with an accurate display was very challenging.
Accomplishments that we're proud of 🏆
We managed to integrate Plotly and Google's FireBase in order to successfully create a multidemensional political spectrum.
What we learned 🎓
While working on Encompas, we learned how to properly use the Plotly API to chart datasets acquired from a custom survey. We also learned to effectively interpret data.
What's next for Encompas ➡️
Going forward, Encompas will continue to work on improving the grading scale that we use to score users. We are also planning on expanding the range of questions that we use.

Log in or sign up for Devpost to join the conversation.