-
-

Slide Deck #1
-
Slide Deck #2
-

Slide Deck #3
-

Slide Deck #4
-
Slide Deck #5
-
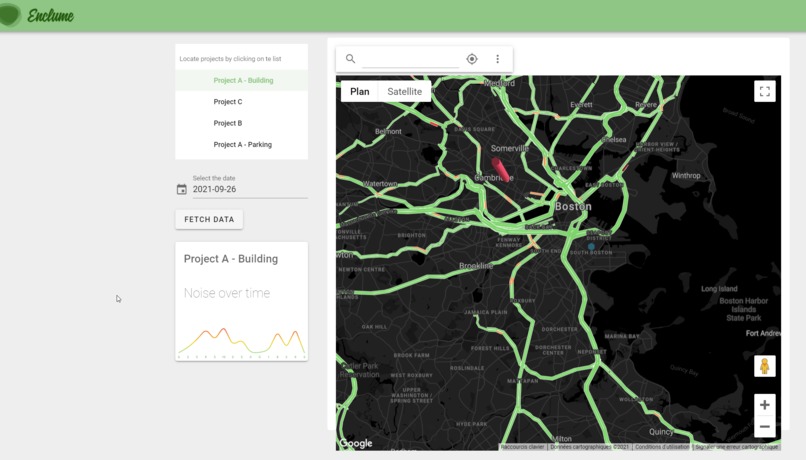
See the noise pollution in action both on map and


Inspiration
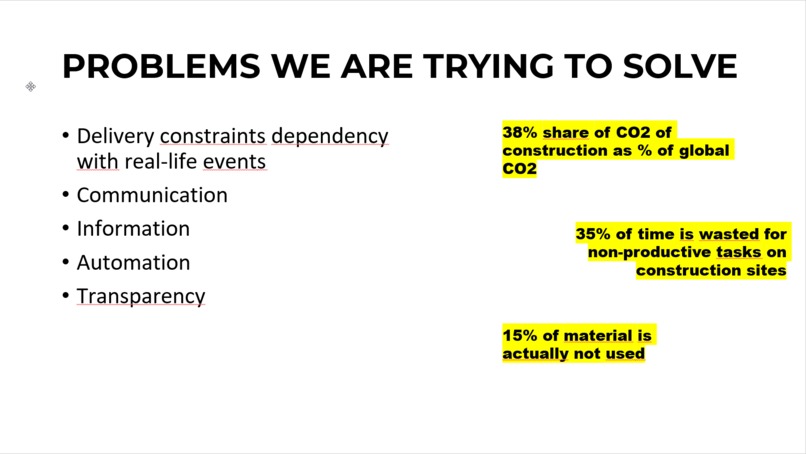
Starting with the Holcim Maqer workshop and challenge, we were faced two choices : either get on the tactical and operative side and alllow decision makers to or
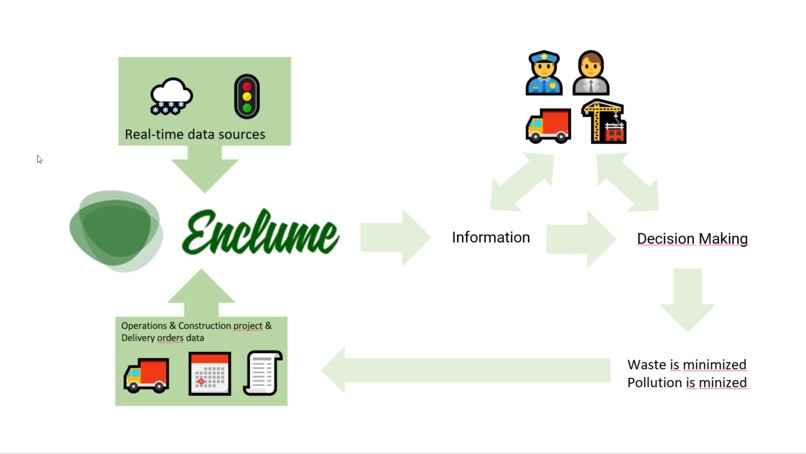
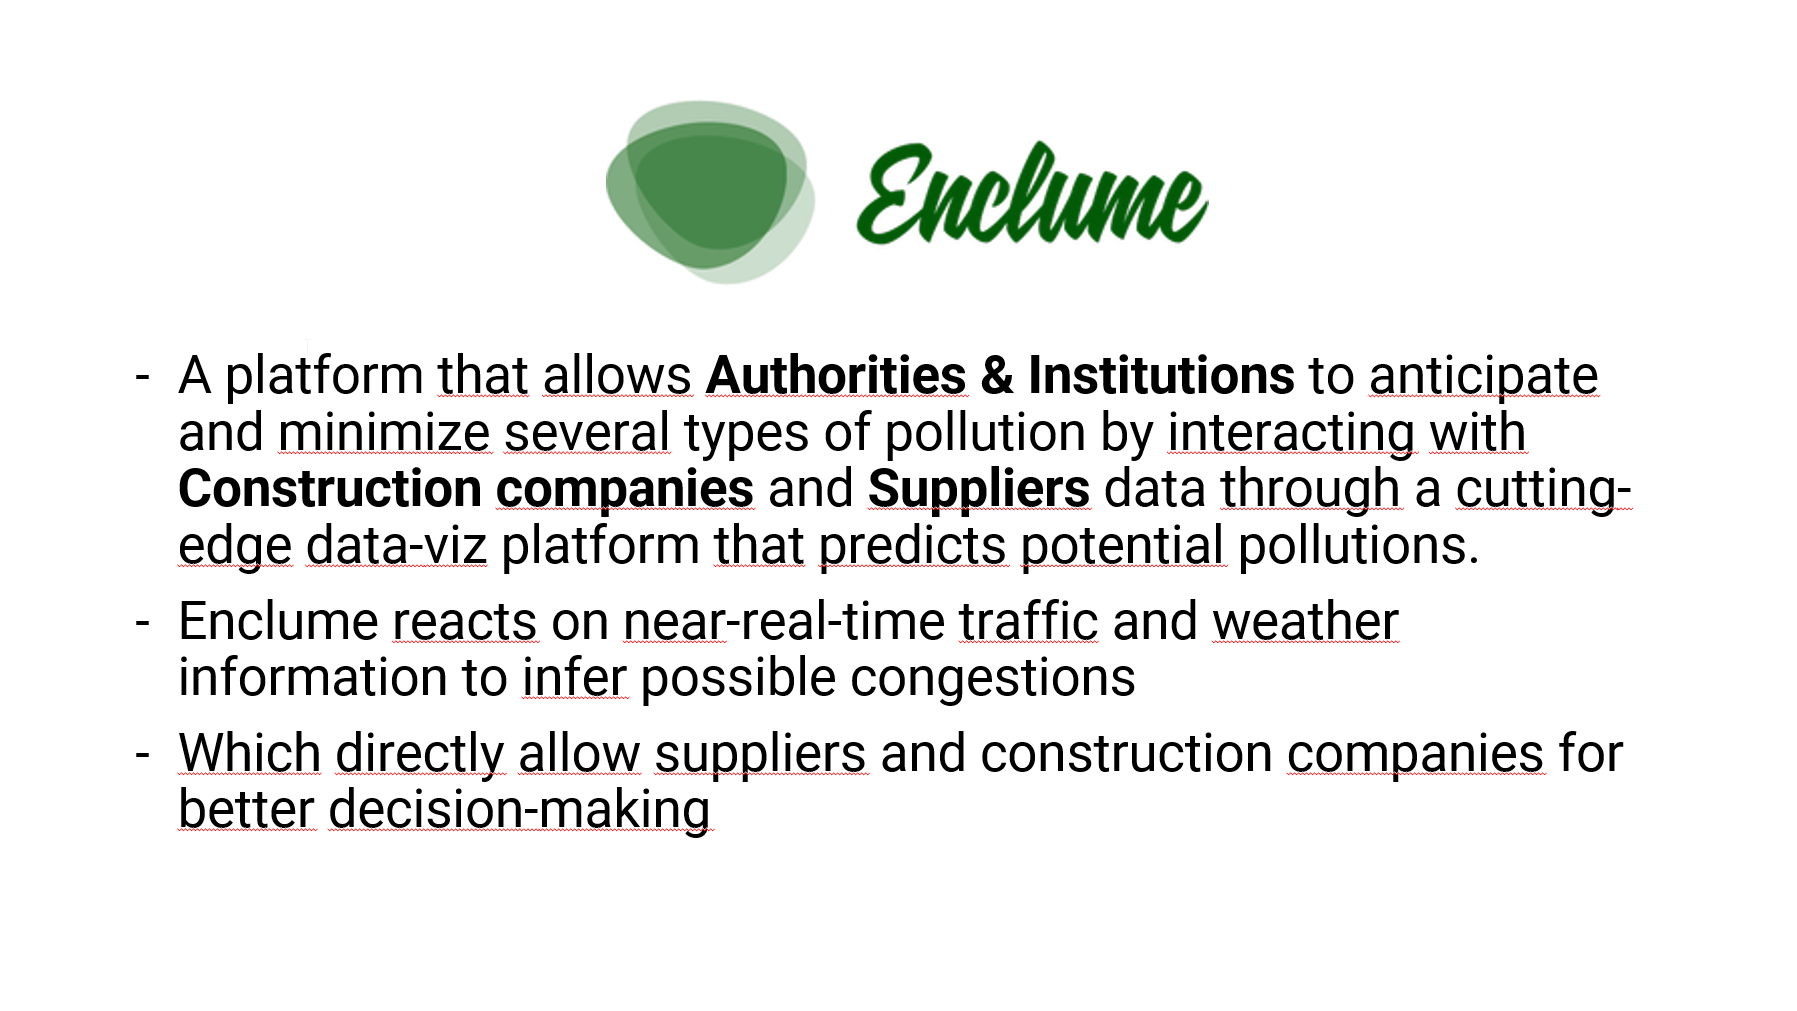
What it does
We leverage several technologies, mainly based on Google Maps Services to show, on the same map pollution factors that can happen in time and cross them with GMaps' traffic information.
How we built it
We wanted to use only technologies and frameworks that were unknown to us. So we've taken Google Maps API, topped with WebGL framework deck.gl (https://deck.gl/), Vue.js (we develop frontends in Angular most of the time).
Challenges we ran into
- Get the idea straight
- Time constraints
- The
googlenamespace is not a namespace, it's a function - Making Vue and Typescript
Accomplishments that we're proud of
- The app actually does stuff !
- First app impression in less than 40 hours (if we count sleep & eat & discussions)
- Use and manipulation of WebGL mixed with real data
What we learned
- Time flies fast...
- New techs, woohoo !
What's next for Enclume
- Improve
- Adapt
- Overcome
Built With
- akka
- deck.gl
- google-geocoding
- google-maps
- json
- quill
- scala
- typescript
- vue.js


Log in or sign up for Devpost to join the conversation.