Inspiration
Remote work blurred work-life boundaries — people answer messages at night, skip PTO, or push through exhaustion unnoticed. We wanted to help teams visualize hidden burnout signals early, not after it's too late.
What it does
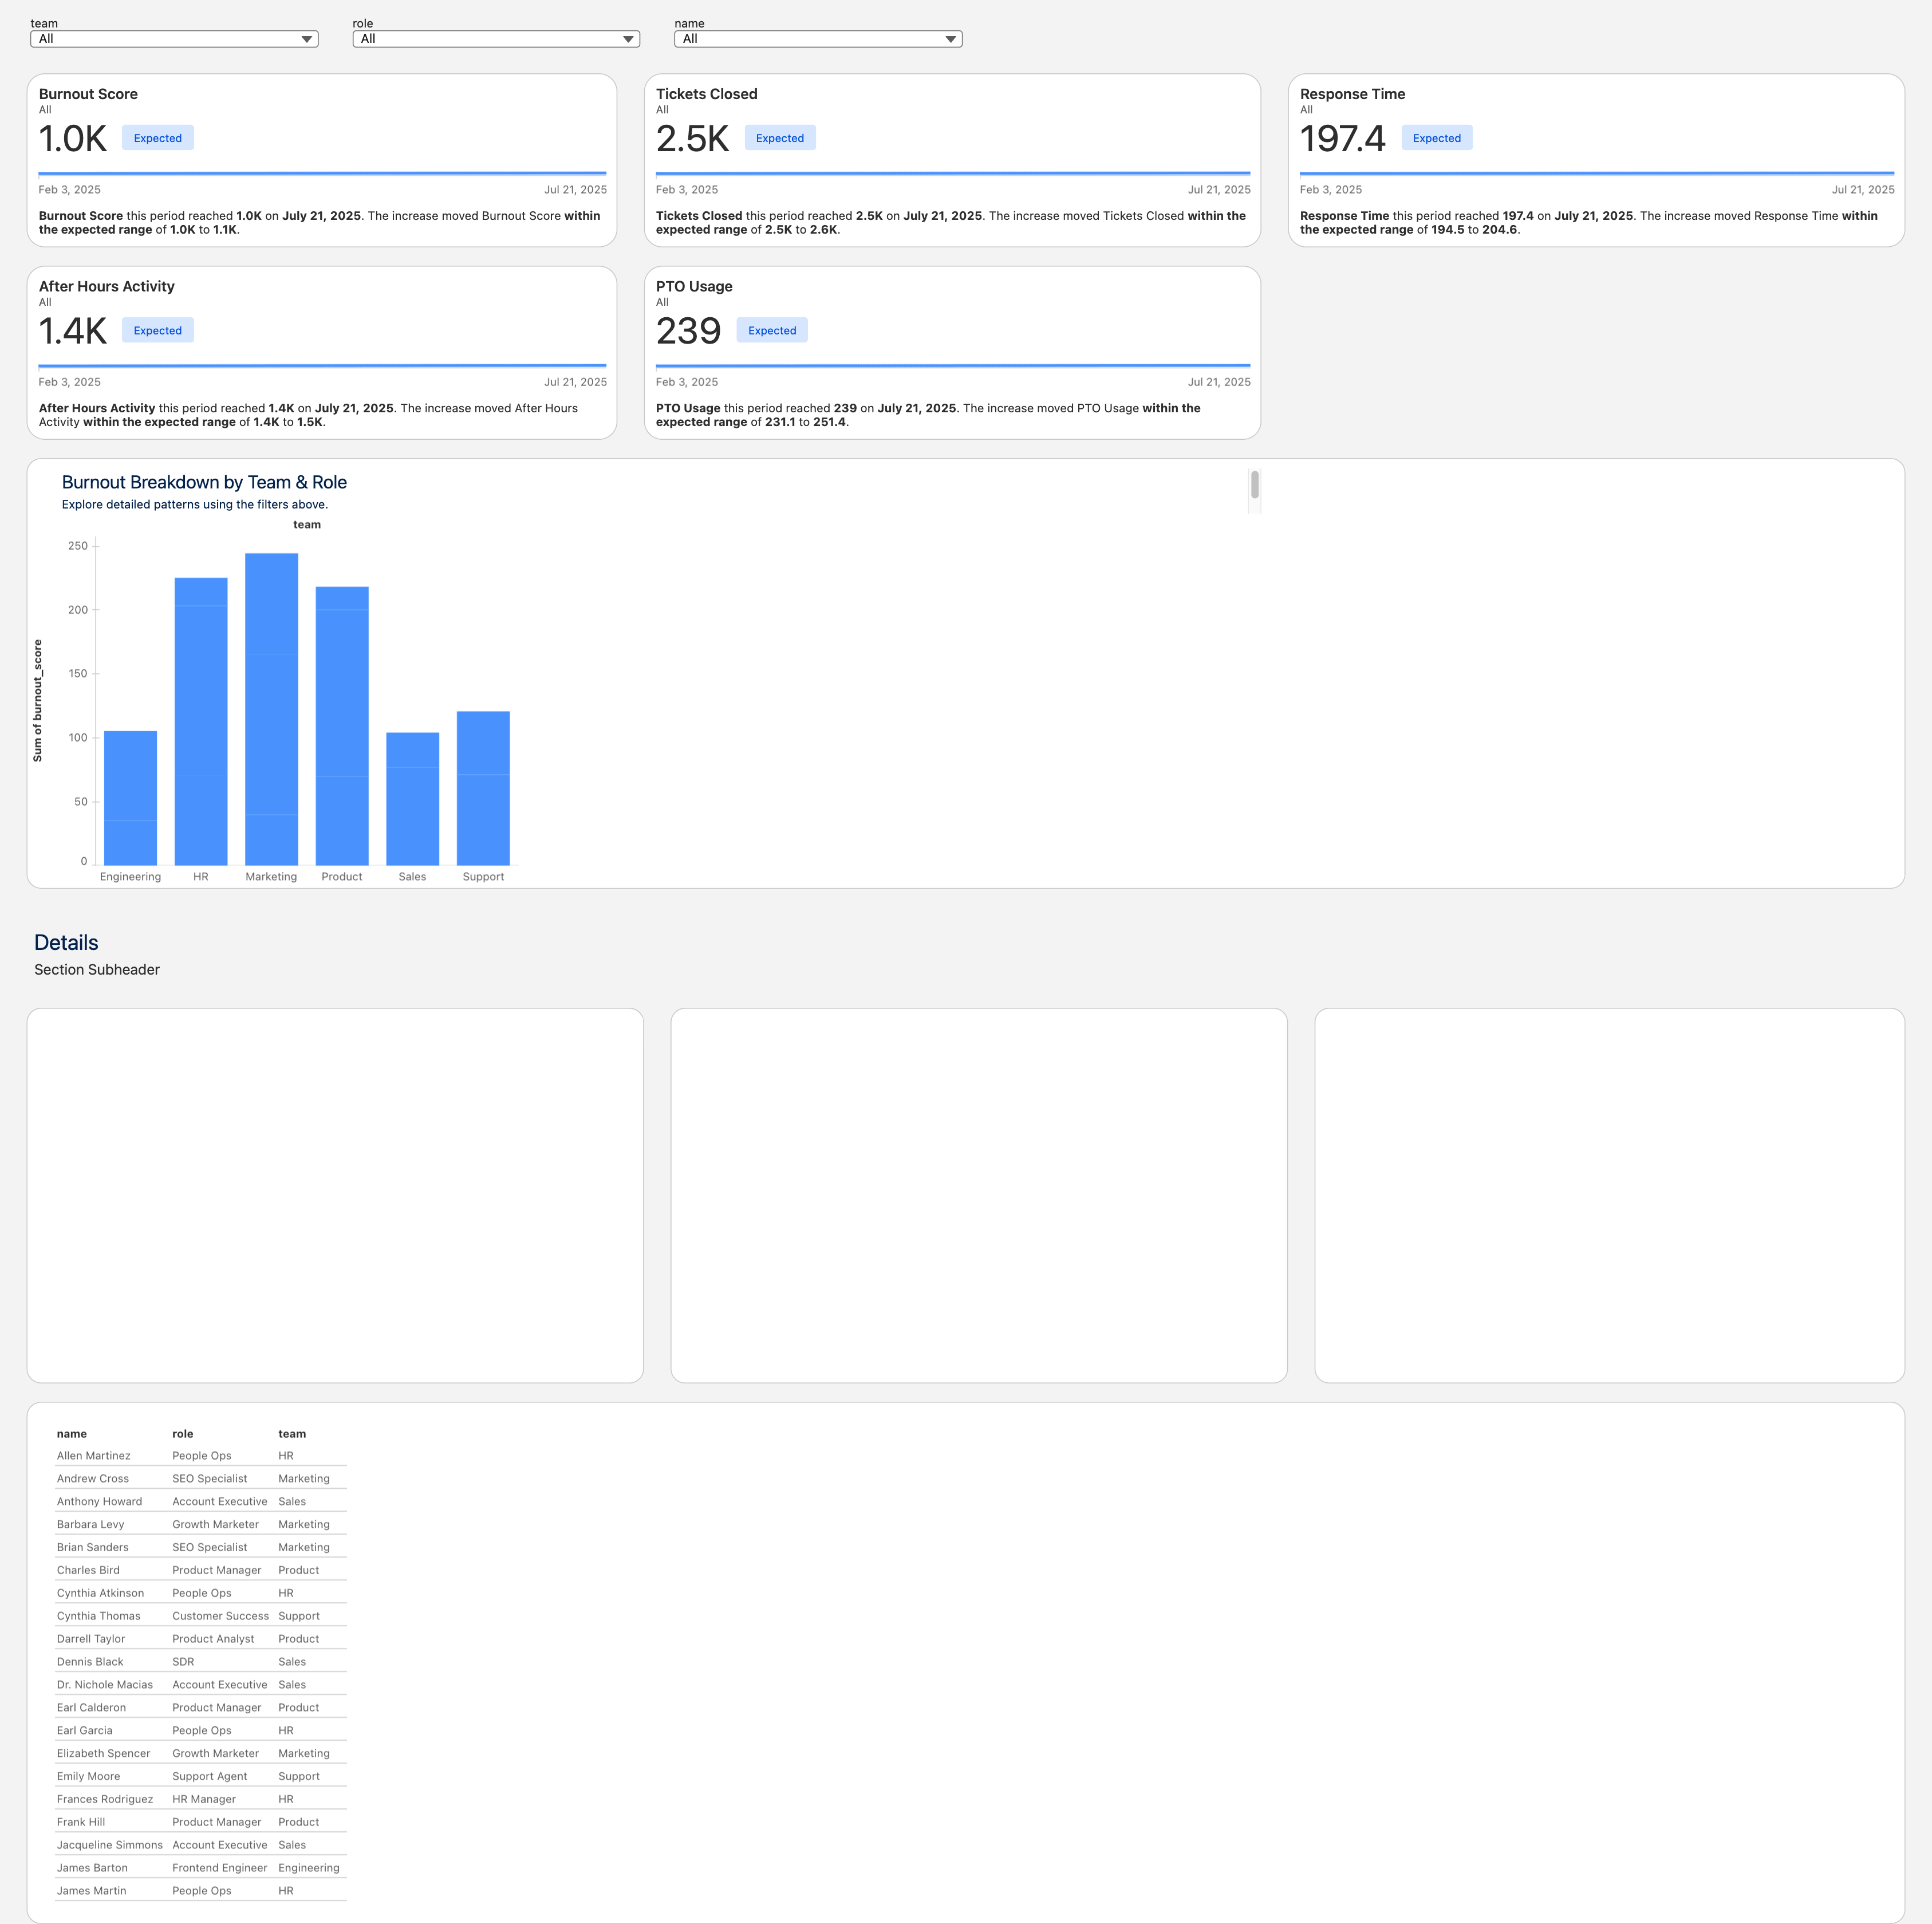
Employee Burnout Radar is a Tableau-powered dashboard that monitors signs of overwork and disengagement across an organization. It tracks metrics like after-hours activity, PTO usage, ticket velocity, and response time, helping leaders spot early warning signs of burnout by team or role.
How we built it
We used:
- Salesforce Data Cloud to store and unify employee behavioral data (PTO, tickets, messages)
- Tableau Next to build a modern, real-time analytics dashboard
- Semantic Model Designer to define and expose custom metrics like Burnout Score, After Hours Activity, and PTO Usage
- Smart Layout and filters to break down trends by team and role
- We designed a clean visual layout using built-in Tableau components and linked filters across all cards and visualizations.
Challenges we ran into
- Setting up semantic models with calculated metrics took trial-and-error — especially getting formulas and expected ranges working correctly
- We hit some confusion around filtering behavior and data model constraints
- Limited metrics required creatively combining basic fields into more insightful trends
Accomplishments that we're proud of
- Created a visually clean and professional dashboard that feels product-ready
- Defined multiple custom metrics and made them actionable in visual breakdowns
- Demonstrated how Tableau can reveal team well-being patterns from raw behavior data
What we learned
- How to create and use semantic models in Tableau
- The importance of thoughtful metric design — what’s measured influences what’s seen
- The power of data storytelling when paired with clean visuals
What's next for Employee Burnout Radar
- Integrate real-time Slack/email activity via Salesforce connectors
- Add anomaly detection with AI to highlight unusual spikes/dips
- Push alerts to managers when thresholds are crossed
- Eventually evolve this into a full wellness monitoring product for orgs
Built With
- salesforce
- tableau-next
- tableau-semantic-model-designer

Log in or sign up for Devpost to join the conversation.