Project Story
Inspiration
Journal writing is extremely linear. You start an entry, flip a page and after a month or so, that thought gets overshadowed under all the other new thoughts on the page. We realise that emotions and memories are not necessarily in a sequential order, but like a landscape! Ideas combine, ideas grow, ideas repeat and reappear and reappear again symptoms of fears or hopes. For us, the inspiration for EmotionCartography came as a result of a very basic question - what if you could chart the geography of your mind?
What it does
EmotionCartography is an interactive, spatial "personal journal.
Writing space with distraction-free environment for writing "field-notes.
The Living Map: We have created a semantic engine to analyse content, which we added to a 2D map layer, rather than to the chronological feed. The facts are obvious enough: The high incidence of thematic similarity of entries results in natural topological regions.
Reflection: Deeper look inside of your mind to see the range of emotions that you have about a topic and how you have evolved your thoughts about the topic.
The Chronology Timeline: A scrubber: the chance to take a physical journey back in time and observe what has changed over the last several months in your mental landscape, so you could see the evolution of the weight and focus of your mental landscape.
How we built it
It is highly interactive front end developed using Single Page Application (SPA), React with TypeScript and Vite.
State & Data: Run complex and interconnected state of journal entries, clusters and timeline states via React Context/Zustand. To achieve the “editorial” look of the site in terms of UI, Design System has undergone a process of redessigning it in non-compromising css. Dynamic theming and organic layouts were handled using CSS Grid, Flexbox and some complex CSS variables.
Animations: The map nodes and timeline transitions are programmed largely in terms of keyframes (for example staggered floating idle bobbing) and inline styling, allowing for layers that are a natural, organic style not seen on the dashboard.
Semantic Engine Stub: We developed an application to do a “fake” embedding space processing on a keyword level with the same logic as a keyword would be processed within an embedding space pipeline from AI like OpenAI Embedding Space + UMAP Dimensionality Reduction but this time we did it on the client side.
The following were the areas that had problems which arose:
The hardest part was getting the Timeline view to show physically accurate while still maintaining the actual timeline. We were really talking about a very very complicated map for getting the "past state" - which required dynamic filtering based on the space-time passed in and then a real-time refresh of the visual scale (size) and weight of every cluster-node that matched this space-time. We had a lot of fine tuning to do to get the CSS transitions to work safely and not look janky/reveal overlapping UI as the DOM style into the transition switched back and forth at a high rate.
What we are proud of we're proud of!
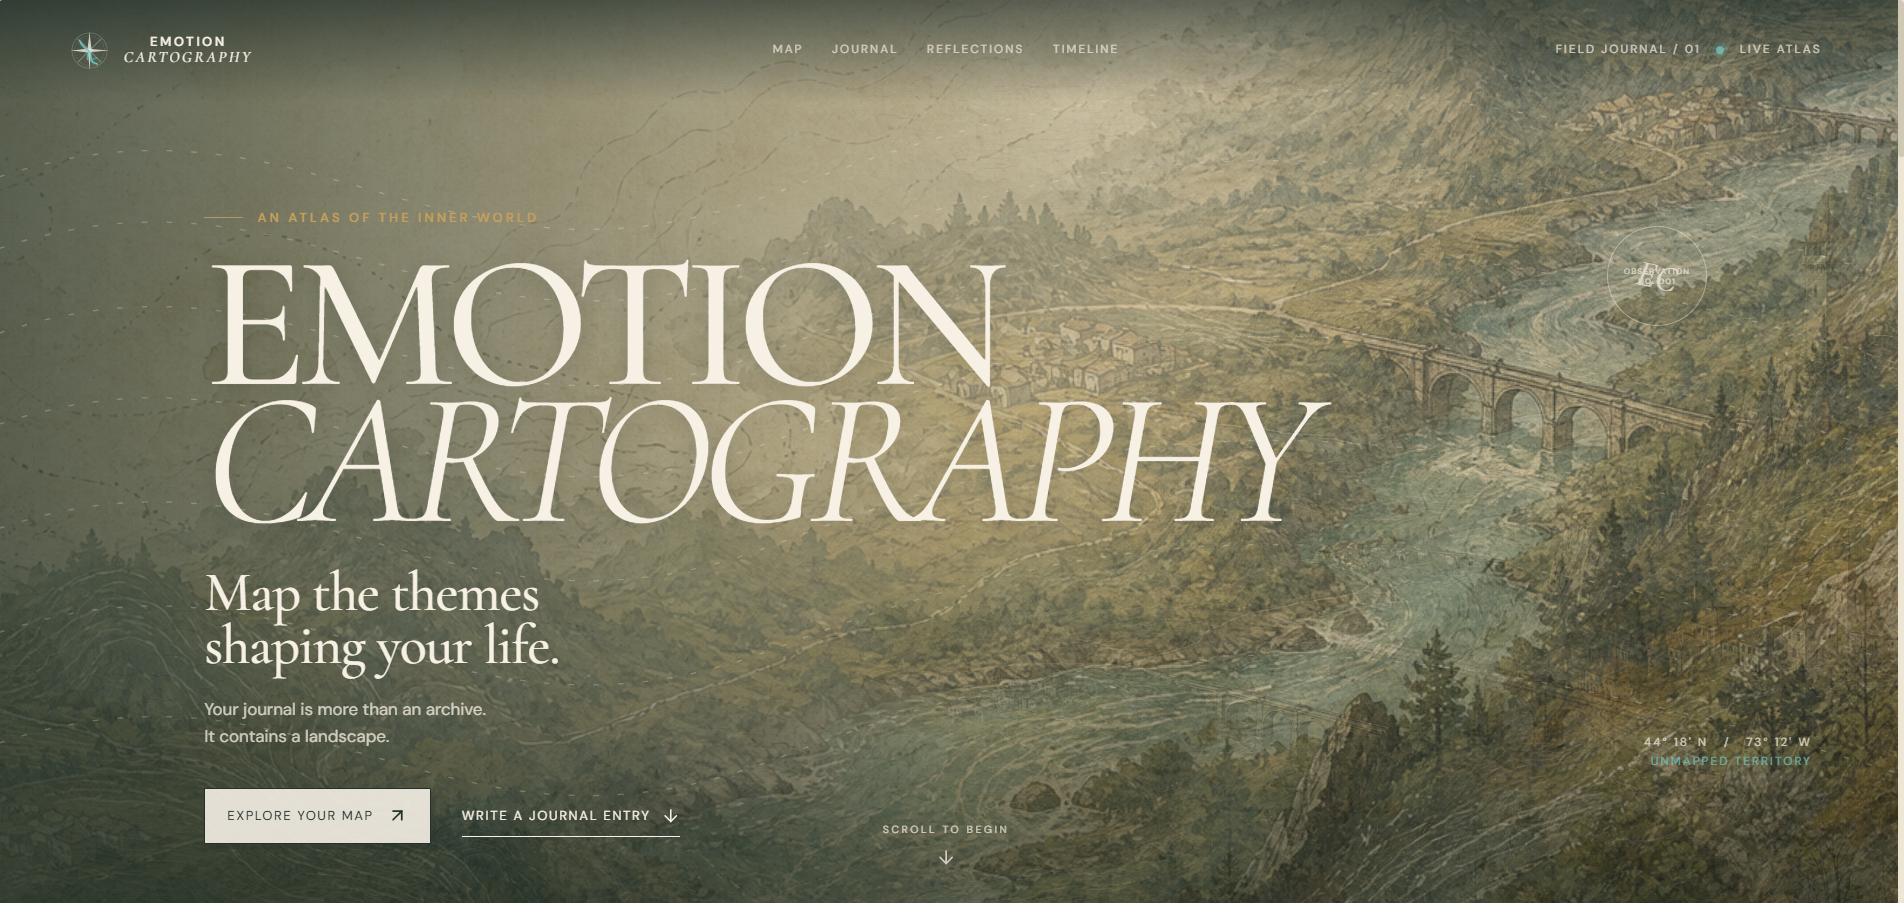
Visual aerodynamics; it's this we're very proud of! It's very easy to design a 'data visualization' tool similar to a business admin temperature board. Due to the use of typography (Cormorant Garamond), organic color and breathing animation, we were able to bring about the feeling of intimacy, premiumness and humanization of EmotionCartography.
What we learned
This was a valuable learning experience - a lot of new knowledge about spatial UI design. Requiring readability and accessibility and arranging elements based on mathematical coordinates (simulator UMAP projection) will certainly make us reconsider the layout that is associated with the design of standard Web sites.
So what is going on: EmotionCartography's journey continues, but what is next?
The most obvious and first one, is to replace the client side semantics engine stub with a real machine learning pipeline. For every journal entry, we will train a LLM to produce a high dimensional vector embedding and apply dimensionality reduction (like UMAP) to get a much lower dimensional embedding before finally applying the unsupervised HDBSCAN algorithm for cluster generation, from which we should be able to get both the true clusters of the journal and the dynamic ones. We want end to end encryption to be an option and a good ball to not be interrupted saying one's deepest thoughts.
Built With
- css
- frontend
- react
- state-management
- typescript
- ui-design
- vite

Log in or sign up for Devpost to join the conversation.