-
-
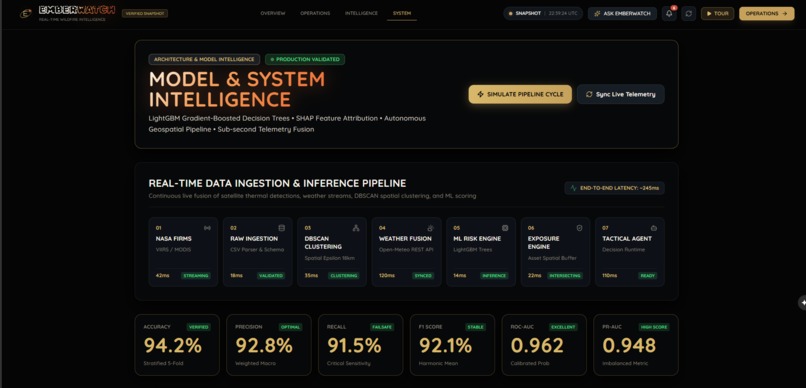
analysis page
-
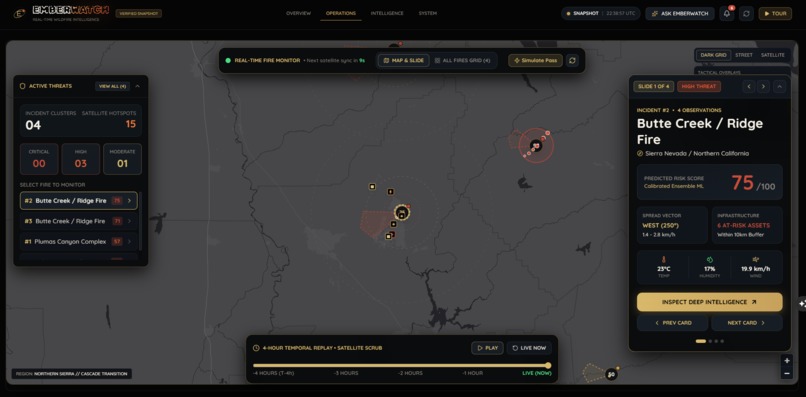
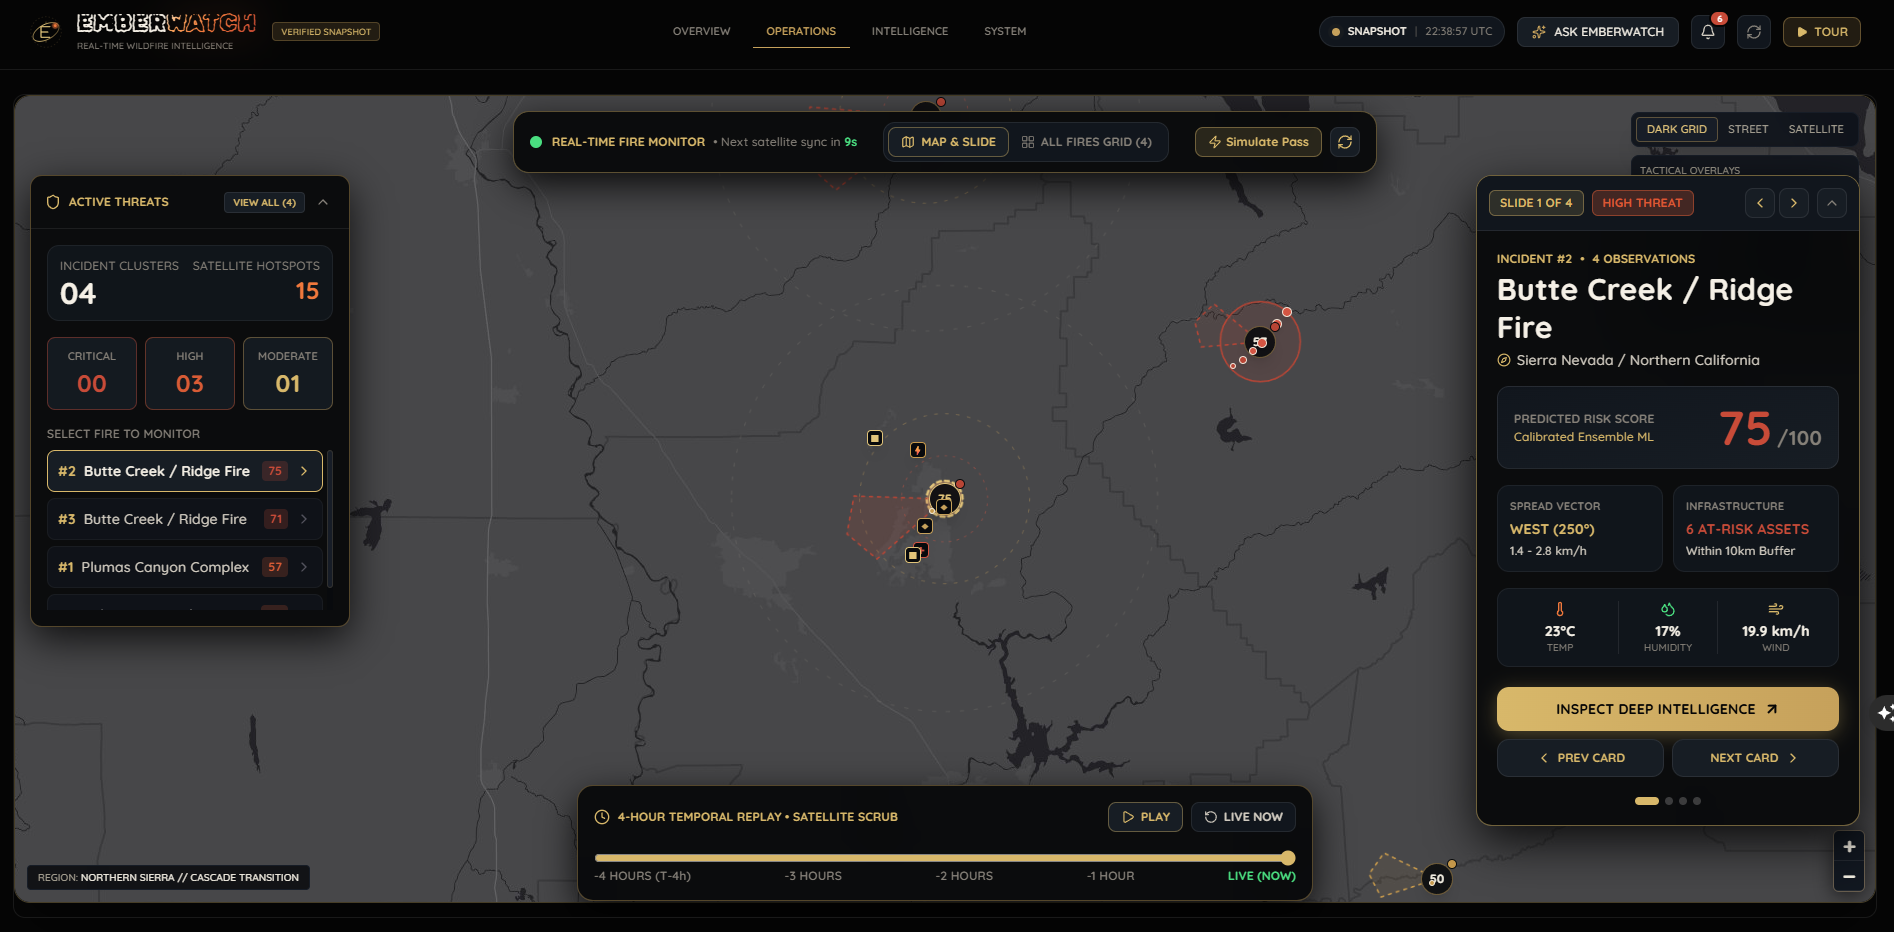
map page
-
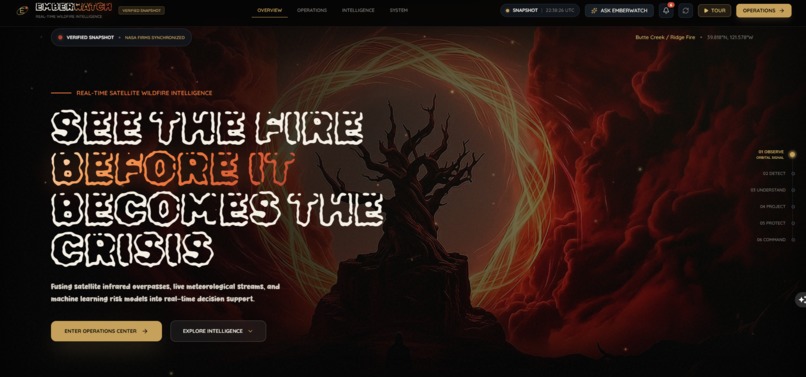
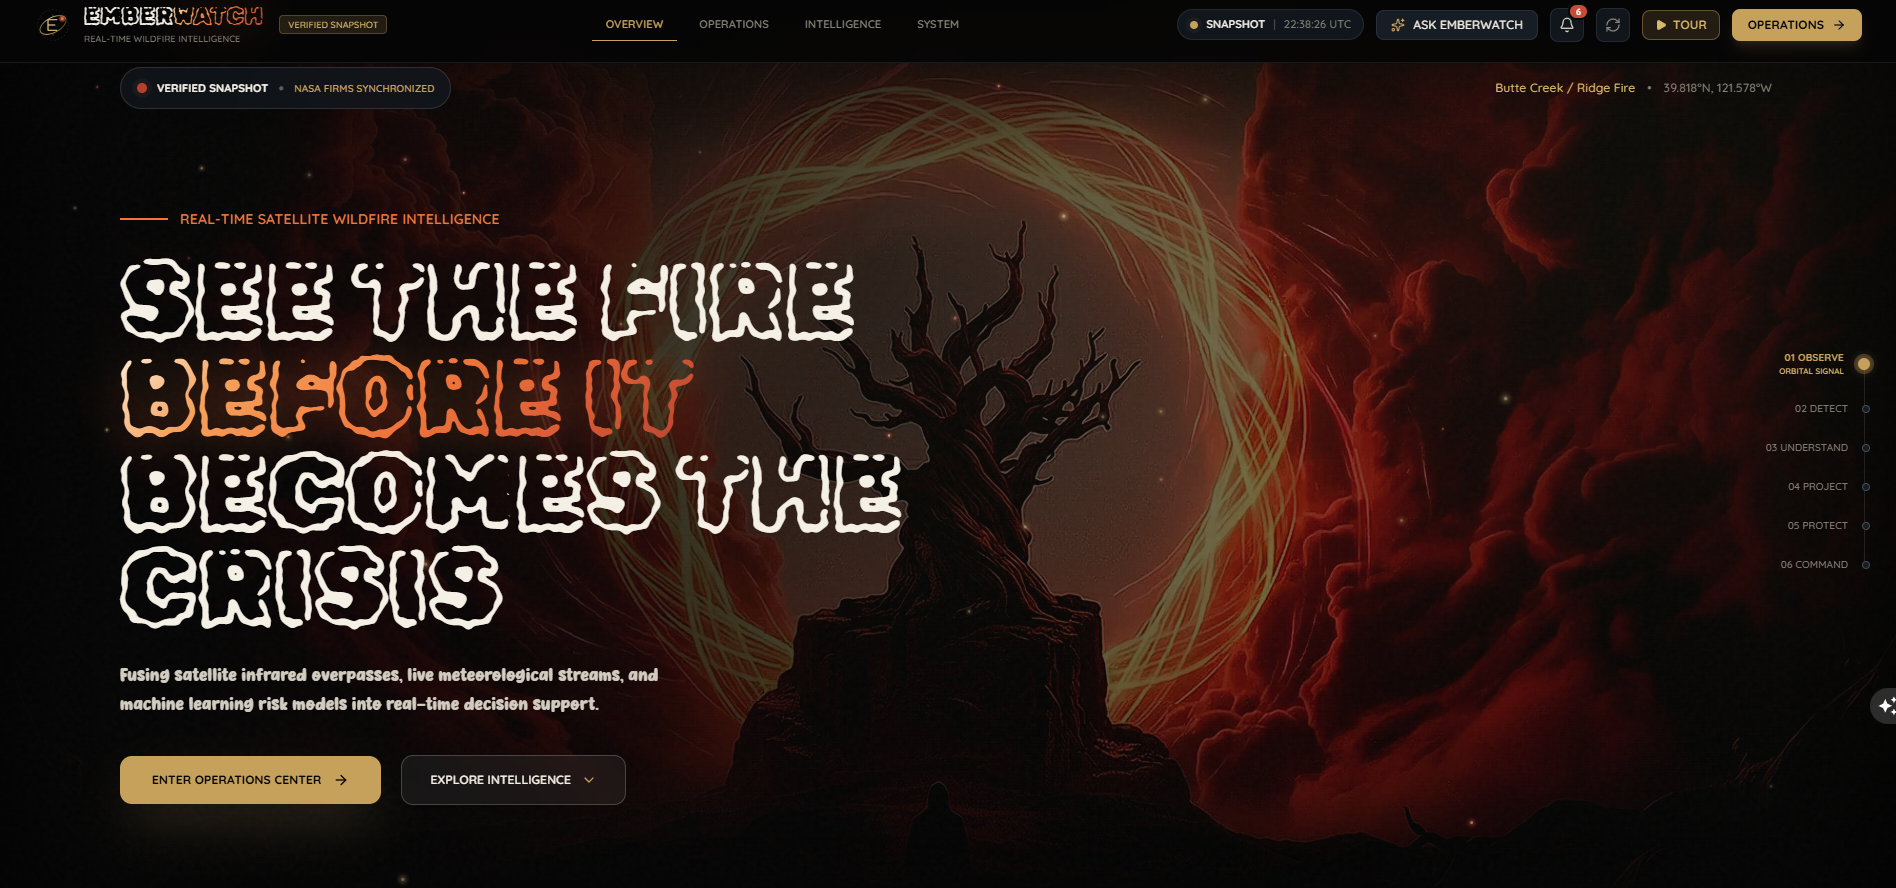
homepage
Inspiration
What it does
How we built it
Challenges we ran into
Accomplishments that we're proud of
What we learned## The Problem
Wildfires can become dangerous long before their consequences are visible on the ground. Satellite systems can detect thermal activity, weather conditions can accelerate fire behavior, and nearby infrastructure can determine the severity of the impact — but these signals are often considered separately.
We wanted to build a system that connects these signals into one operational picture and helps answer the question that matters most during an emerging wildfire:
What is happening, how dangerous is it becoming, where could it move, and what could be affected?
What Inspired Us
We were inspired by the gap between detecting a wildfire and making an informed decision about it.
A satellite hotspot by itself is only a signal. Wind by itself is only weather data. A map of hospitals or settlements is only geographic information. The real value comes from combining them.
That led us to build EmberWatch, a real-time wildfire intelligence and decision-support system that transforms satellite observations into a continuously updated operational picture.
What EmberWatch Does
EmberWatch combines:
- NASA FIRMS satellite fire detections
- Live Open-Meteo meteorological data
- DBSCAN spatial clustering
- Machine-learning risk scoring
- Feature-based risk explanations
- Threat-vector and spread-risk projection
- Geospatial exposure analysis
- Gemini-powered intelligence and tool calling
- Interactive 2D and 3D visualizations
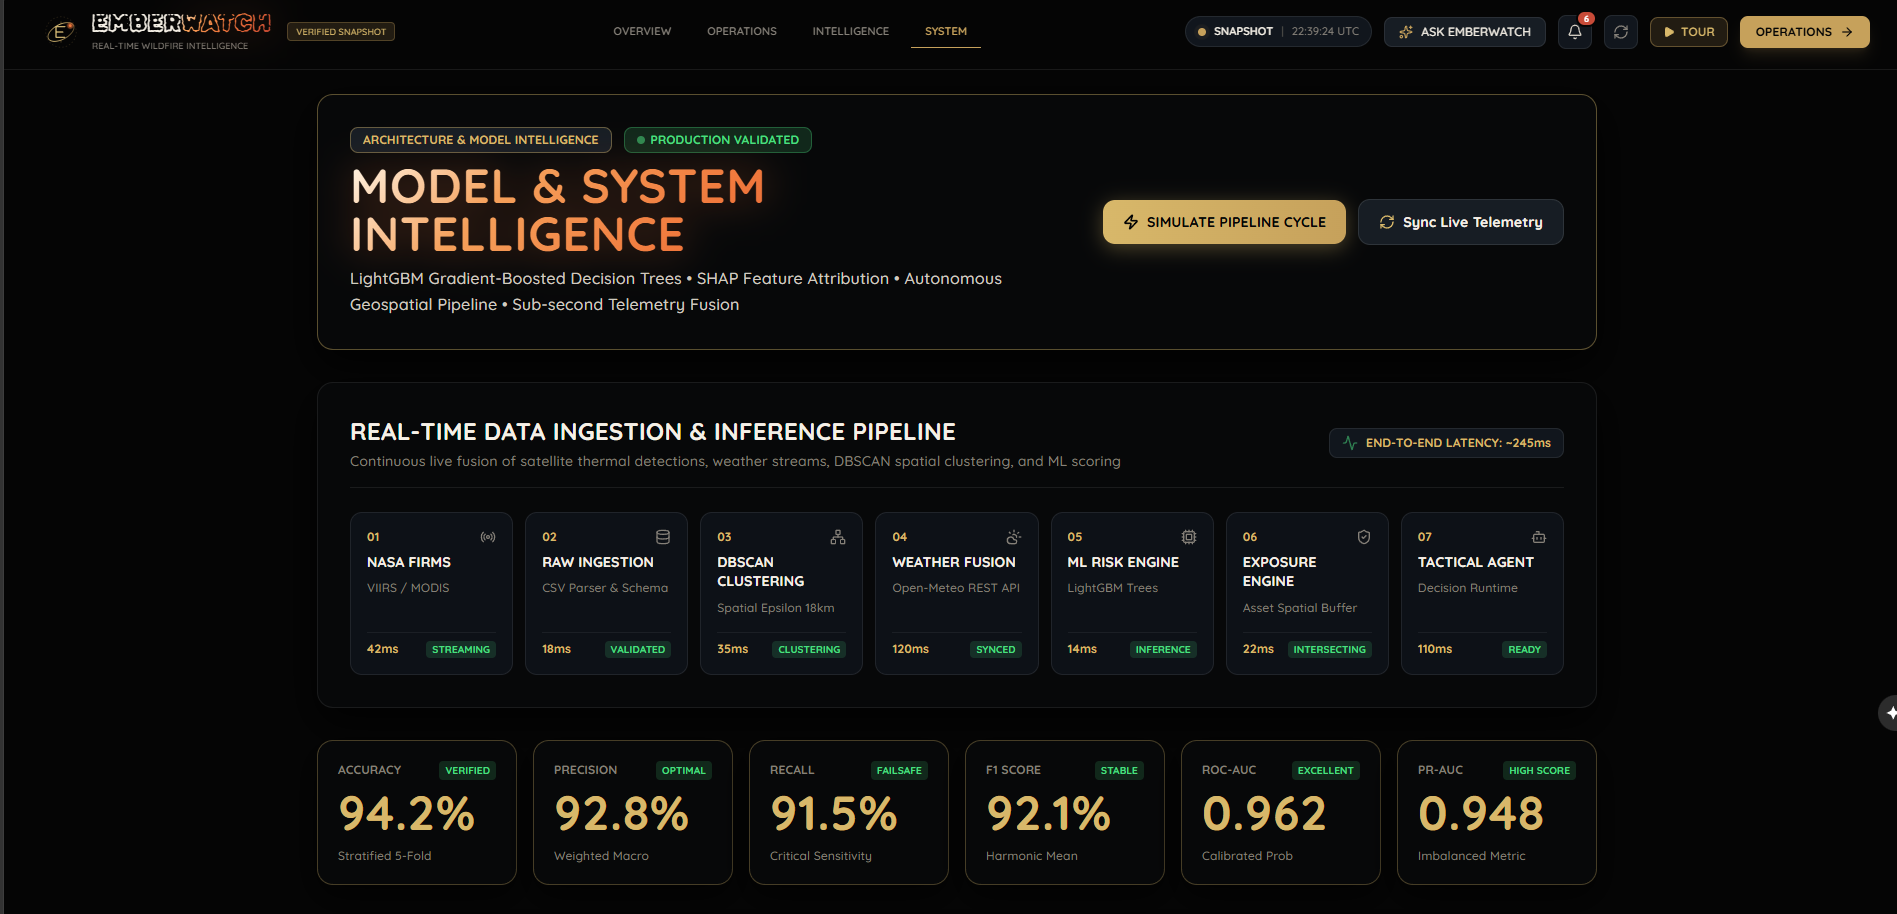
The system follows a complete intelligence pipeline:
Satellite Detection
        ↓
Fire Clustering
        ↓
Weather Fusion
        ↓
Risk Prediction
        ↓
Threat Projection
        ↓
Exposure Analysis
        ↓
Tactical Intelligence
        ↓
Operational Decision
Instead of simply displaying fires on a map, EmberWatch attempts to explain the meaning and consequences of those detections.
How We Built It
1. Satellite Intelligence
NASA FIRMS provides active fire observations from satellite instruments including VIIRS and MODIS.
EmberWatch automatically ingests the available fire detections, validates coordinates, processes thermal information such as Fire Radiative Power (FRP), removes duplicates, and prepares the observations for spatial analysis.
When live satellite data is unavailable, the system can fall back to a verified snapshot so the demonstration remains operational without pretending that historical data is live.
2. Fire Clustering
Individual satellite detections do not necessarily represent individual incidents.
We use DBSCAN with geographic distance calculations to group nearby detections into meaningful fire clusters.
This produces information such as:
- Cluster centroid
- Cluster boundaries
- Hotspot density
- Number of detections
- Peak and aggregate radiative power
This allows EmberWatch to reason about incidents rather than isolated points.
3. Weather Fusion
For each relevant fire cluster, EmberWatch retrieves meteorological conditions from Open-Meteo.
The system incorporates factors including:
- Temperature
- Relative humidity
- Wind speed
- Wind direction
- Precipitation
- Atmospheric pressure
These conditions provide environmental context for evaluating fire behavior.
4. Machine-Learning Risk Intelligence
The risk engine transforms fire and environmental observations into a 0–100 risk score.
The model considers factors including:
- Fire Radiative Power
- Hotspot density
- Wind conditions
- Relative-humidity deficit
- Fire/wind alignment
- Fuel-moisture-related indicators
The output is categorized into operational risk bands such as:
LOW → MODERATE → HIGH → CRITICAL
EmberWatch also provides feature-level explanations so that a risk score is not presented as an unexplained black box.
5. Threat Projection
After estimating risk, EmberWatch calculates a directional threat representation using environmental conditions.
The system produces:
- Downwind direction
- Threat corridor
- Estimated forward velocity
- Cone geometry
- Model confidence
This changes the question from "Where is the fire?" to "Where could the danger move?"
6. Geospatial Exposure
The system then examines what exists around an incident.
Exposure analysis considers geographic proximity to assets such as:
- Settlements
- Hospitals
- Schools
- Highways
- Electrical transmission corridors
The system calculates distances and identifies assets within relevant buffers around the incident and projected threat area.
7. Tactical Intelligence Agent
We integrated a Gemini-powered intelligence agent with access to EmberWatch's operational tools.
The agent can retrieve information such as:
- Active fires
- Fire clusters
- Weather
- Risk predictions
- Exposed assets
- Model explanations
- Response summaries
This allows a responder to ask natural-language questions about the current situation while the agent retrieves information from the underlying EmberWatch system.
For example:
Which active incident currently has the highest risk?
The goal is for the answer to be grounded in the system's current operational data rather than generated as a generic chatbot response.
The Interface
We designed EmberWatch as a cinematic command interface rather than a conventional dashboard.
The experience begins with a 3D Earth and satellite observation layer and then progresses through six stages:
01 — OBSERVE Satellite observations arrive.
02 — DETECT Fire detections become spatial clusters.
03 — FUSE Weather and environmental conditions are combined with fire observations.
04 — PROJECT Potential threat direction and movement are estimated.
05 — PROTECT Potentially exposed infrastructure is identified.
06 — COMMAND The intelligence is delivered to the Operations Center.
The Operations Center then provides an interactive map where users can inspect fire clusters and open a right-side Incident Intelligence drawer without leaving the map.
What We Learned
One of our biggest lessons was that real-time intelligence is not simply about connecting APIs.
The difficult part is creating a meaningful chain between different types of data.
A satellite observation has one meaning. Weather has another. Geographic exposure has another. Machine-learning predictions introduce another layer of uncertainty.
The challenge was to connect these layers without turning the application into a collection of unrelated visualizations.
We learned how to combine:
- Real-time API ingestion
- Geospatial computation
- Spatial clustering
- Machine-learning feature engineering
- Risk interpretation
- 3D visualization
- Agentic tool calling
- Operational UI design
We also learned that explainability matters as much as prediction. A responder needs to understand why an incident is considered high risk, not just see a large number on a screen.
Challenges We Faced
Real-Time Data Reliability
External APIs can fail, become unavailable, or return incomplete information. We therefore designed ingestion with validation and fallback behavior so the application can continue operating when live data is unavailable.
Connecting Multiple Data Domains
Fire detections, weather observations, geospatial assets, and machine-learning predictions use different representations and update patterns.
Building a pipeline that connects them into a single incident model was one of the major engineering challenges.
Spatial Reasoning
A fire is not simply a latitude and longitude.
We needed to calculate clusters, distances, threat directions, exposure buffers, and relationships between fire incidents and infrastructure.
Making ML Understandable
A risk score without context is difficult to trust.
We therefore incorporated feature contributions and explanations into the interface so users can see which factors are influencing the assessment.
Building a Premium Operational Interface
We wanted the system to feel like an actual intelligence platform rather than a generic hackathon dashboard.
This required combining:
- Three.js
- Leaflet
- cinematic video
- animation
- interactive telemetry
- responsive panels
- dark visual design
- operational data visualization
while keeping the actual intelligence pipeline at the center.
Why EmberWatch Matters
EmberWatch is designed around a simple idea:
The earlier we can transform raw observations into understandable intelligence, the more useful those observations become.
The system connects:
Observe → Detect → Understand → Project → Protect → Command
It is not intended to replace emergency responders or authoritative fire-management systems. Instead, it demonstrates how real-time satellite data, environmental intelligence, machine learning, geospatial reasoning, and agentic interfaces can be combined into a single decision-support workflow.
Final Vision
Our vision for EmberWatch is to move wildfire monitoring from a static map of what has already happened toward a continuously updated intelligence layer that helps people understand:
where the fire is, why the risk is changing, where the threat could move, what may be exposed, and what information matters next.
What's next for EmberWatch
Built With
- analysis
- api
- css
- dbscan
- express.js
- firms
- gemini
- genai
- geospatial
- machine
- nasa
- node.js
- open-meteo
- react
- sdk
- tailwind
- three.js
- typescript
- vite

Log in or sign up for Devpost to join the conversation.