Inspiration
Gas flaring wastes recoverable energy and raises public health concerns for nearby communities. In 2025, 167 billion cubic meters of gas were flared globally, representing an estimated $54 billion in wasted gas.
Research linking residential exposure to flaring during pregnancy with increased odds of preterm birth motivated us to consider public health alongside the economics of gas recovery. Environmental Health Perspectives
We built FlareWise to prioritize which flares require the most immediate attention.
What it does
Flaring shows up in two places that never meet. Satellites see every flame while health studies see the harm in the towns downwind. The decision a company actually makes, which flares to capture with a limited budget, is still ranked on cost.
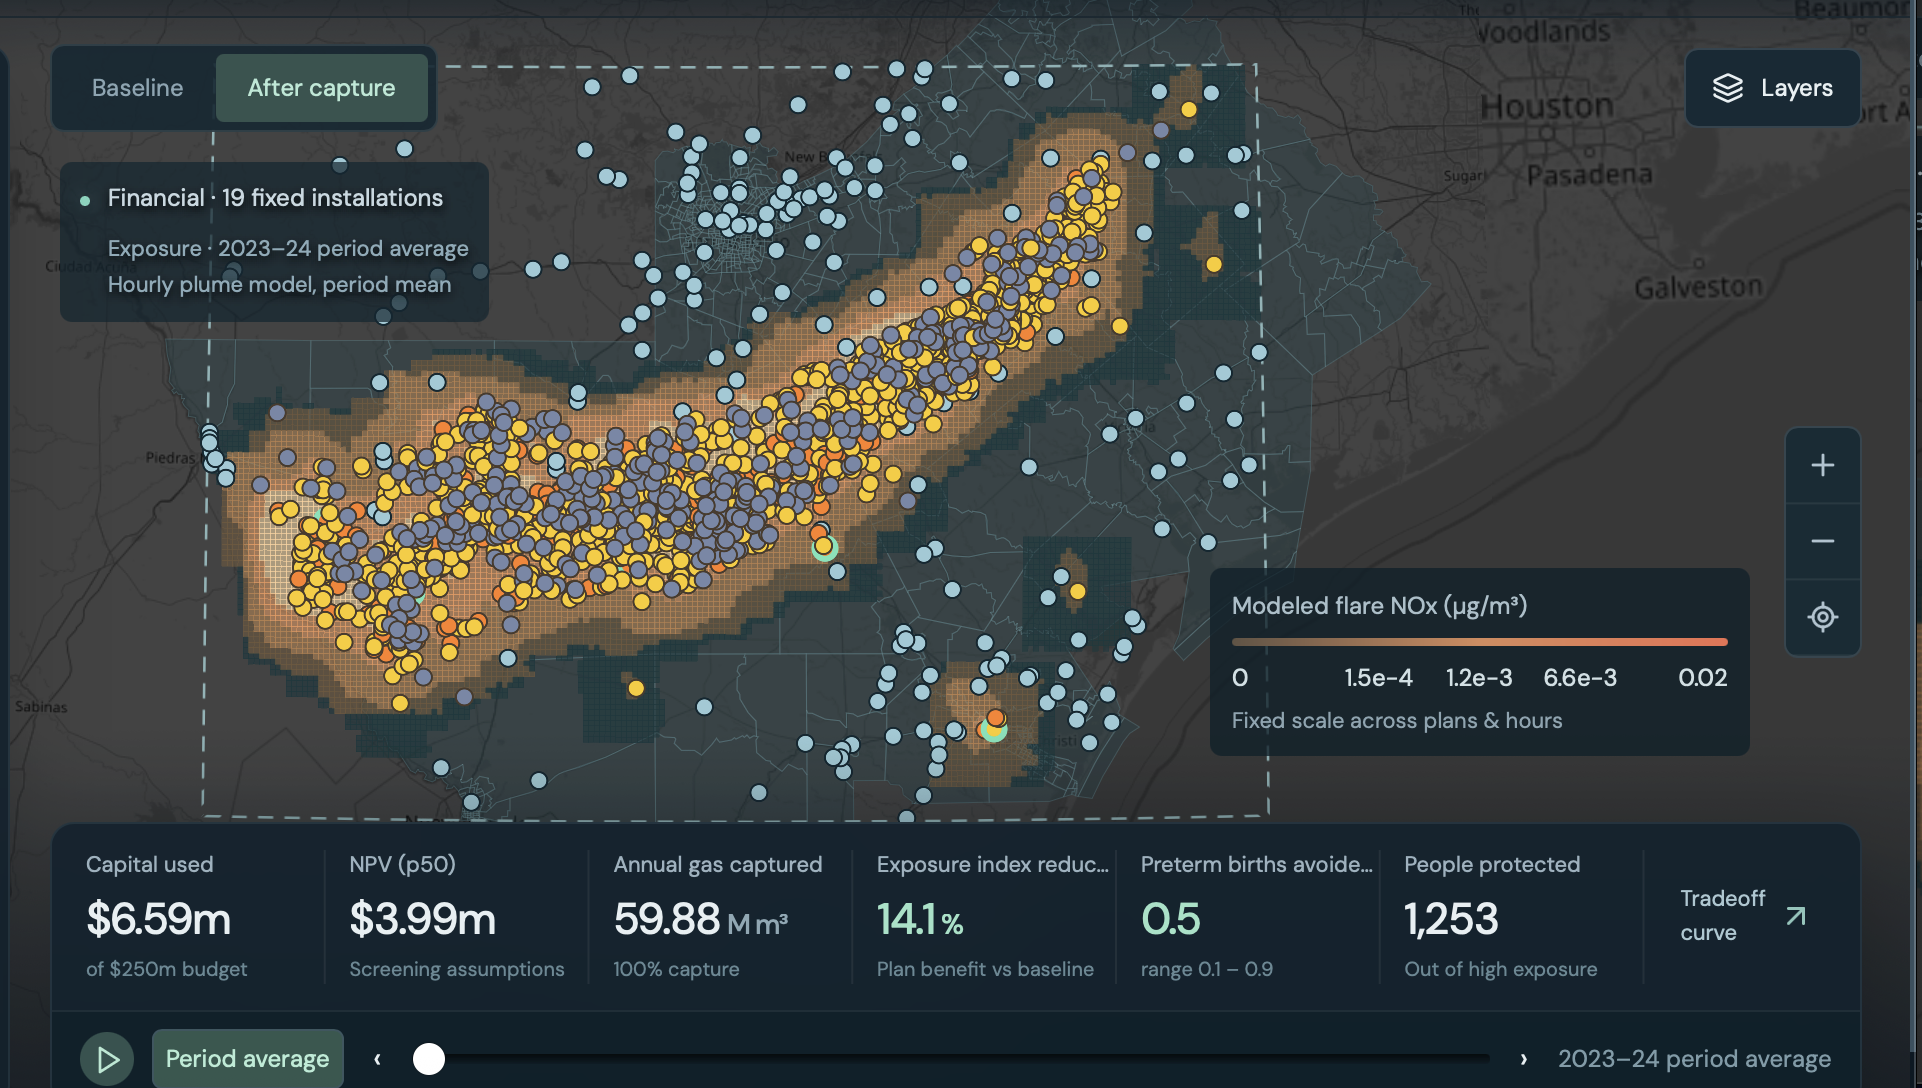
FlareWise is that missing step. For one oil field and one capital budget, it turns nightly satellite detections and hourly wind into a capture plan that counts both the gas recovered and the people taken out of the plume. You can look at the plan that makes the most money, the plan that protects the most residents, and the plans in between. The two goals stay separate, so a small give-up in value is visible as a large gain in who is no longer downwind.
In the Eagle Ford, for 2023–2024, that is 1,574 flare sites, 306 of them burning routinely, about 486 million cubic meters of gas a year. At $2.50 per MMBtu only 19 of those sites pay for themselves on gas sales alone. On a $50 million budget, the money-only plan protects about 1,250 people. Spending about $10 million more, and giving up about $9.8 million of value, protects about 28,000. The budget does not change. The shortlist moves toward the towns, which is the public-health action the satellite record was missing.
How we built it
We started from a single flare and asked what you would need to know before spending money to capture it. Where it is, whether it burns often enough to be worth the equipment, how much gas it wastes, what that gas is worth, who actually breathes the smoke, and whether a different set of sites would protect more people for the same budget. Each of those is a public dataset. None of them was built to answer the next question, so the pipeline carries one site from a night-time satellite pixel through to a place on a tradeoff curve.
The pixels come from nightly VIIRS detections, NASA FIRMS, matched to the VIIRS Nightfire catalogue. One flare is seen hundreds of times at slightly different coordinates, so detections are clustered into sites with DBSCAN. Cloudy nights are treated as missing rather than as the flare being off, because the satellite could not see the ground. A Gaussian mixture then separates routine flares from ones that only burn now and then. Routine flares are the ones a 2030 pledge is about: a steady stream of gas with nowhere to go. Change-point detection flags a routine site that goes dark and stays dark, which is what capture would look like after the fact.
From there the same site splits into two calculations. On the money side, fire radiative power is calibrated to Nightfire’s published gas volumes, run forward with an Arps decline curve, and turned into a net present value across a range of gas prices. Distance to the nearest pipeline goes into a screening-level capture cost. On the health side, an hourly Gaussian plume follows the smoke with ERA5 wind, using Briggs dispersion and a cap at the mixing height, and lands it on a Census population grid instead of a circle drawn around the flame. Residents in that path are counted. A published Eagle Ford study supplies the health link we use: more flare nights within 5 km during pregnancy was associated with higher odds of preterm birth. We carry that as a range, because it is one observational study, not a proof that any one flare caused any one birth.
Those two results only meet in the optimizer. A thousand Monte Carlo draws give the low and high ends of the value and the health estimate. For each budget, a mixed-integer program traces every plan from most value to most people protected, and the balanced plan is the knee of that curve, the point where spending a bit more money protects many more people. We checked the wind model against EPA NO₂ monitors. Measured pollution rises with the modeled exposure, and the relationship disappears when the winds are flipped, which is what we needed before trusting the shortlist.
Challenges we ran into
The hardest technical challenge was figuring out which flares to capture together. A town may still face high pollution exposure after one nearby flare is captured, so ranking sites individually wasn’t enough. We had to compare groups of sites and make those calculations fast enough to be useful. The data also had gaps. Satellite readings were scattered, clouds made it hard to tell whether a flare was active, and weather data lacked the detail we wanted. Some public records were missing information, and our first approach to identifying routine flaring found no sites. We had to revise our methods and check our pollution estimates against the limited monitoring data available.
The most uncomfortable challenge was being honest about money. We hoped protecting people would come almost free, but at recent gas prices only nineteen flares pay for their own capture, and our balanced plan loses about six million dollars compared with the most profitable one. We also found that capturing the cheapest gas first avoids more greenhouse gas emissions than our health-focused plans, because the biggest flares are often far from towns. We chose to show those numbers plainly instead of picking a flattering comparison, because that tension between climate, money and health turned out to be the most important thing our project revealed.
Accomplishments that we're proud of -
We are proudest that our model holds up against the real world. At the Karnes County monitor, measured nitrogen dioxide averaged 4.8 ppb on days the wind blew from the flares versus 2.2 ppb on upwind days, and the signal disappeared when we rotated every wind direction 180 degrees. That gave us confidence that FlareWise follows real pollution and not just distance on a map. We are also proud that every number we show carries an honest range, from 1,000 Monte Carlo simulations that mark which flares stay in the plan under almost any assumption.
In under a day, we built a complete and reproducible pipeline that goes from raw nightly satellite detections to a full trade-off curve of capture plans, with tests, continuous integration, and a dashboard that runs offline. It finds 1,574 flare sites in the Eagle Ford and shows that the same budget can move 22 times more people out of high flare exposure. Because every region-specific setting lives in one config file, the same code can run on any oil field on Earth. Most of all, we are proud that the project taught us something we did not expect, which was that the flares that matter most for the climate are often not the ones hurting people, and that we chose to show that finding plainly.
What we learned -
Our results could only be as accurate as the data we could trust. The sources were all public and all useful, but they were built for different jobs, so they did not line up. Two satellites watch the same flame and do not agree on how often it burns: the open nightly record misses most nights that the flare catalogue counts. A cloudy night looks identical to a flare that was off. Census tracts, town boundaries, and the population grid cover the same families in different shapes, so adding them up would count people twice. The health number comes from one Eagle Ford study of pregnancy and preterm birth, not from a monitor at each site. The capture costs are screening ranges, and a lot of the small gathering pipelines are not on any public map, so distance to a pipe is an upper bound. Even the pollution check only has one monitor sitting inside the oil field.
The temptation was to sand those edges down and publish one clean ranking. What we learned is that the ranking gets easier to defend if you leave the edges visible. Each number carries the years it came from, the instrument that measured it, and a range where the sources disagree. A plan that still protects the same towns after the gas price, the cost, and the wind are all pushed around is a plan you can stand behind. A single score that hides which dataset it trusted is not.
What's next for FlareWise
The Eagle Ford plan shows that a budget can be ranked on gas value and on who is downwind. The same idea can go in a few directions from here.
One is geography. The satellite record already covers every flare on Earth, and the app can show that inventory by country. The full capture-and-exposure analysis is only built for South Texas, so the next fields are other basins, the Permian first, and then somewhere outside the US.
Another is time. This version is a 2023–2024 snapshot. Run it every year and it becomes a way to see which routine flares actually go dark after a company pledges to stop, and which ones are still burning.
A third is who the plan is for. A company can use it to spend a capture budget. A regulator or a county health department can use the same map to ask which communities keep showing up downwind, and whether a new pipeline or a shared gas plant would do more than capturing flares one pad at a time. The health side can widen too. Preterm birth is the outcome we could tie to a published Eagle Ford study. The same plume can be counted for children, older adults, or other illnesses once those links are solid enough to show as a range. And the money side does not have to stay “gas sold at the hub.” Capture also cuts methane that never burned, which is its own value if someone is paying for that, or if a lender wants the health result in the project file.
Built With
- climatetech
- dbscan
- html
- javascript
- machine-learning
- python
- react

Log in or sign up for Devpost to join the conversation.