-
-
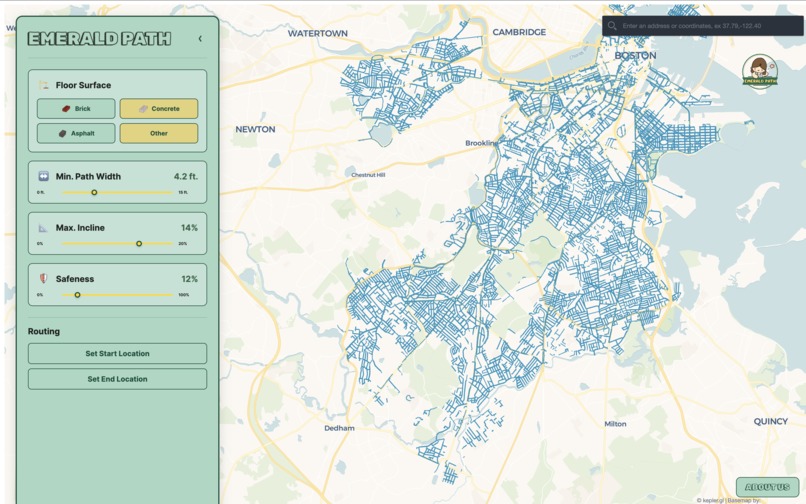
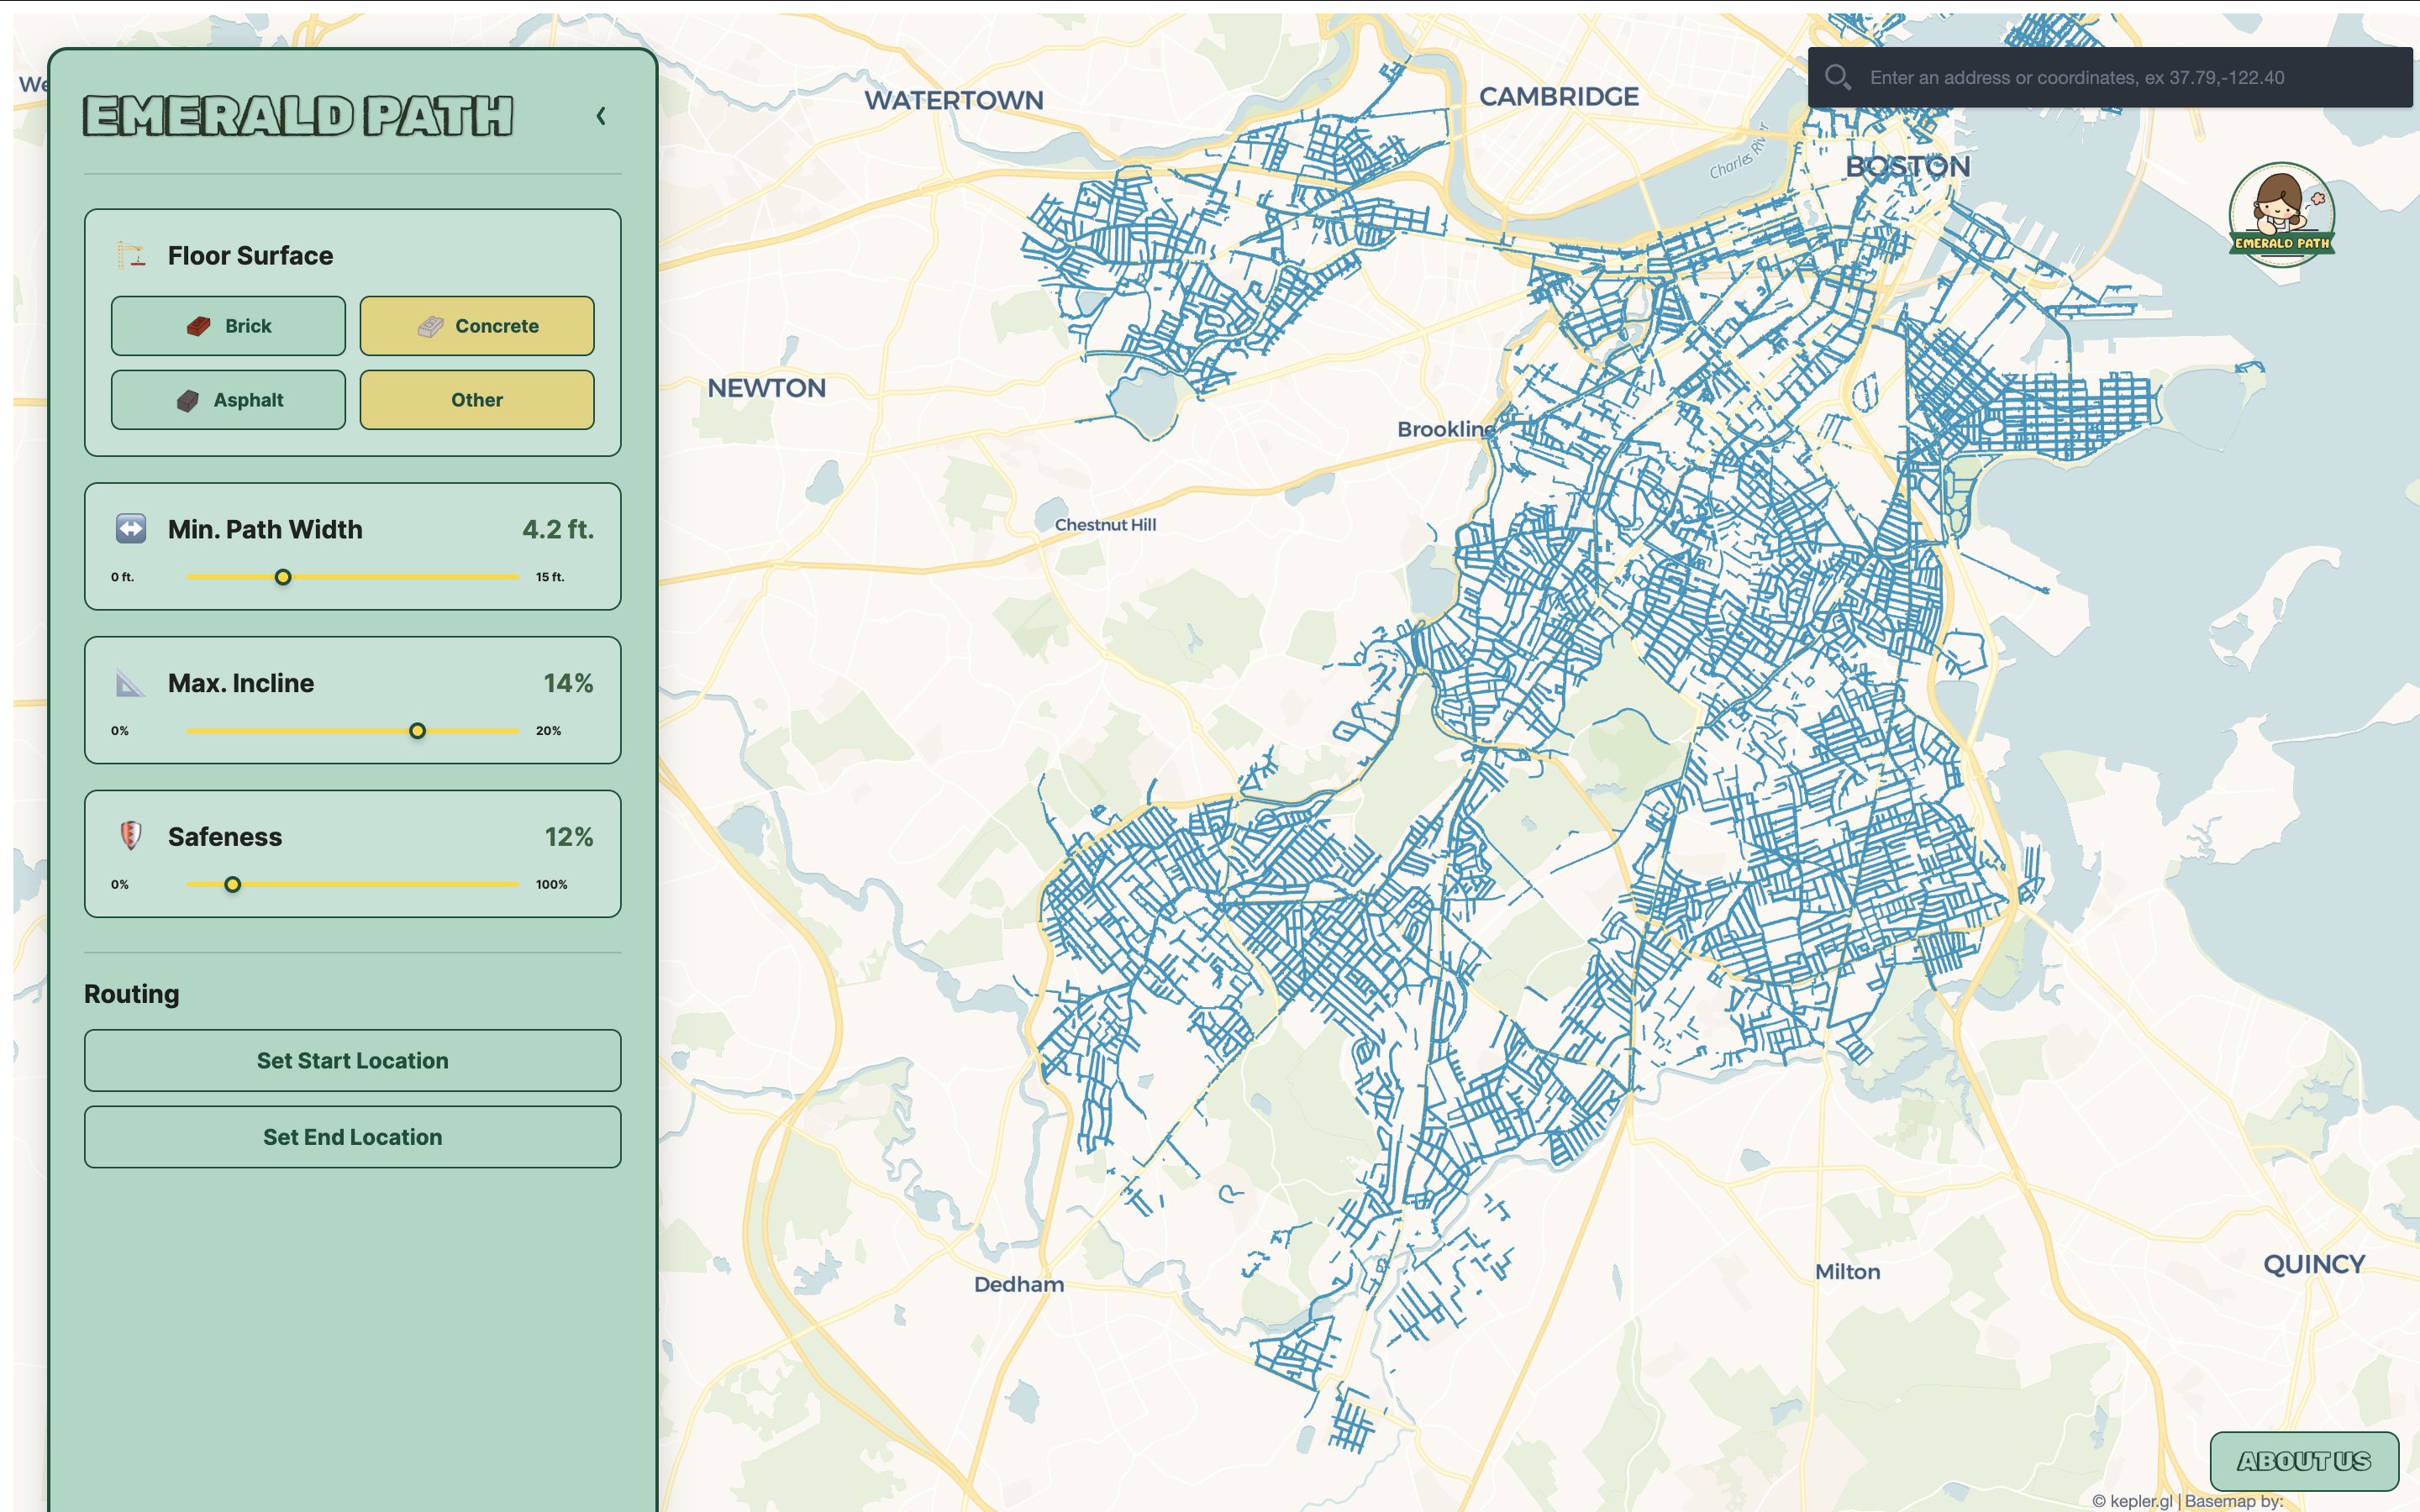
Map view of sidewalks
-
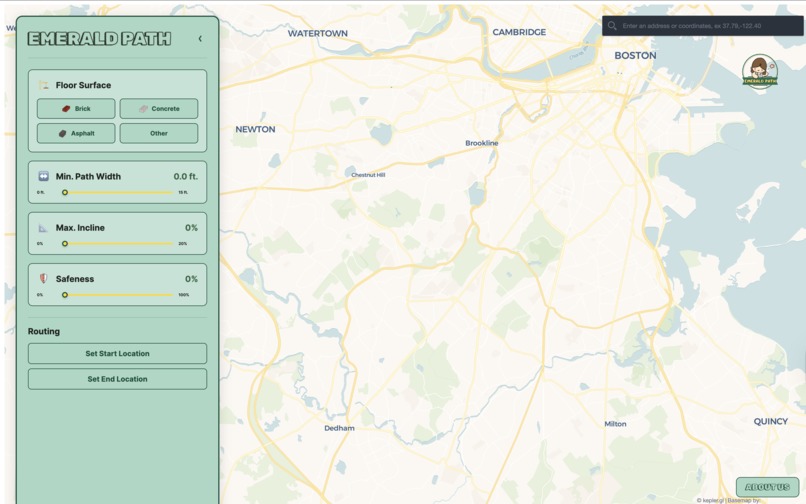
Map view with all accessibility filters applied
-

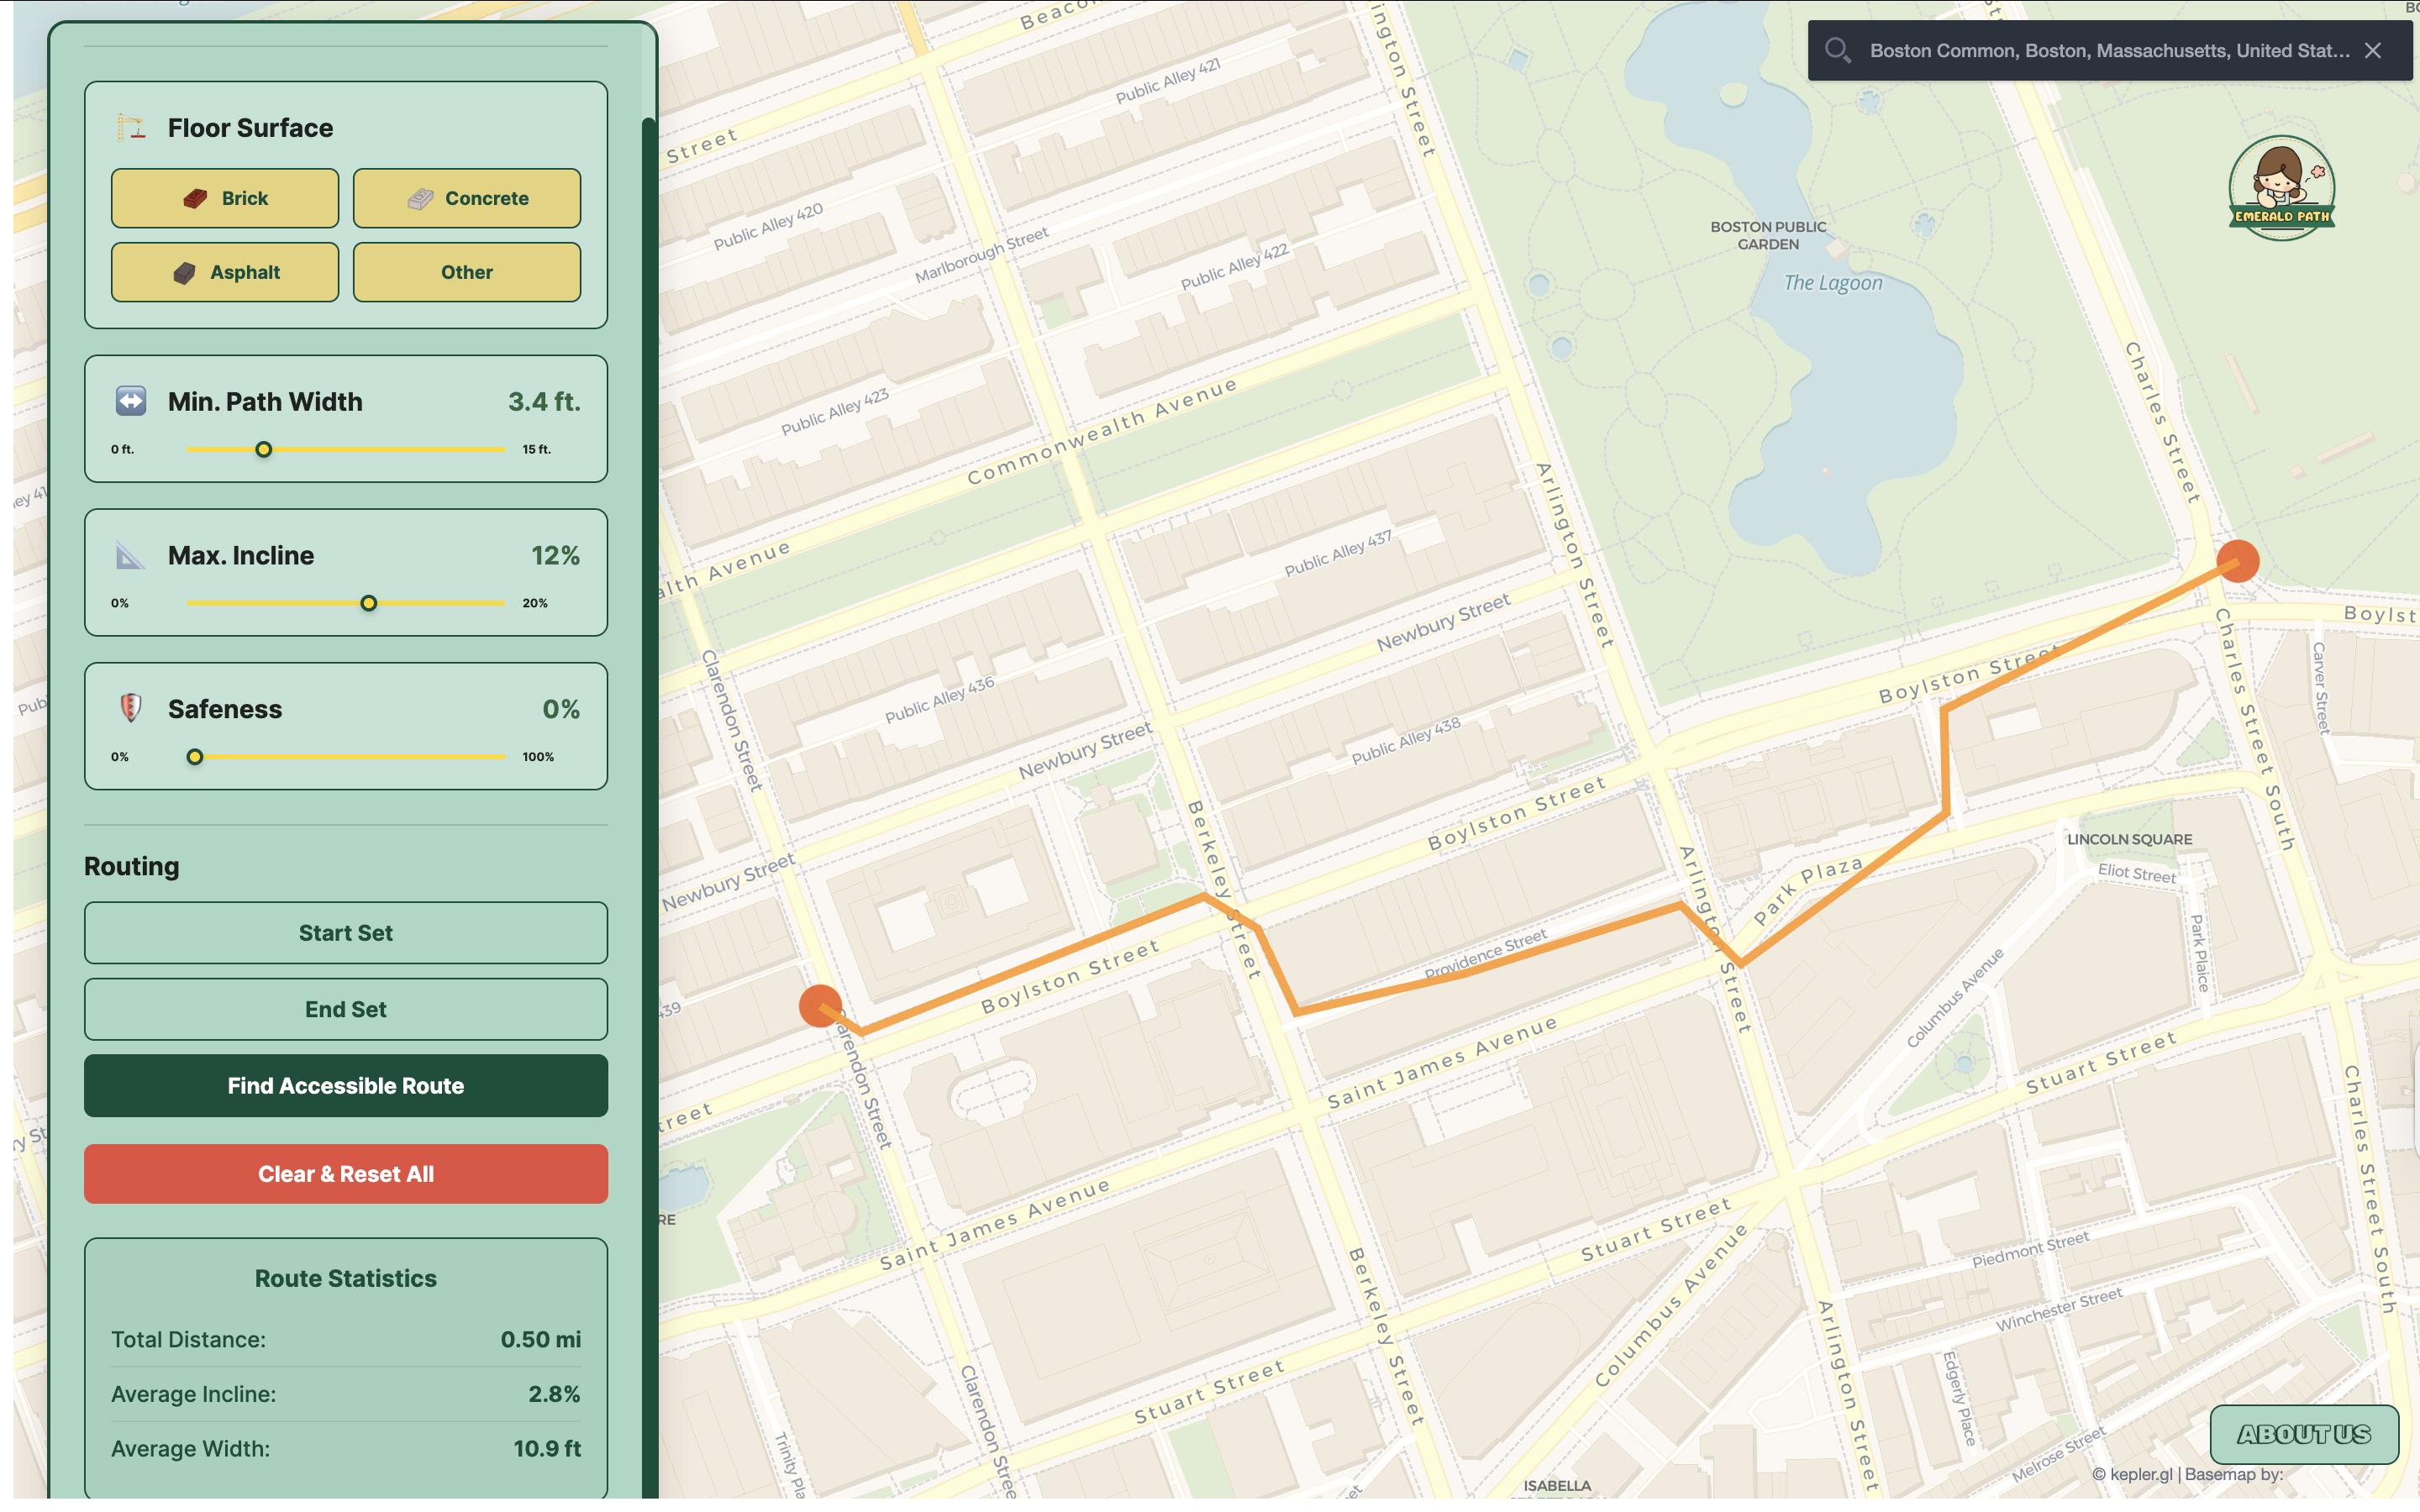
Example of an accessible route that fulfills filter criteria and minimizes distance from Boston Commons to Newbury St.
-
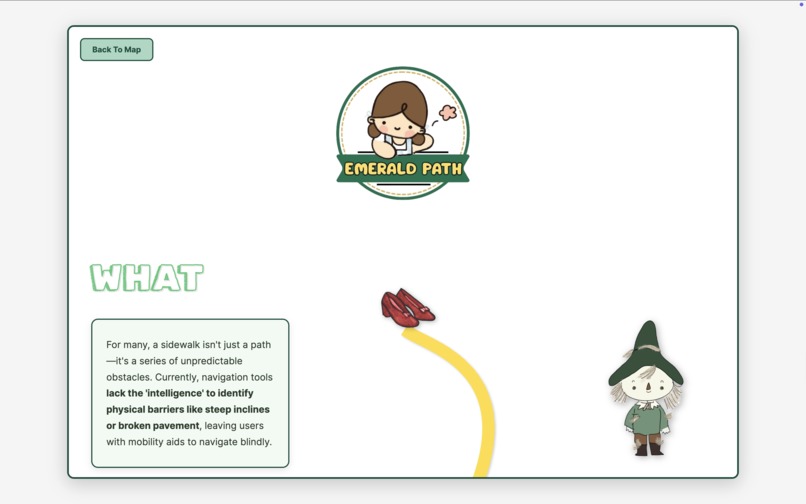
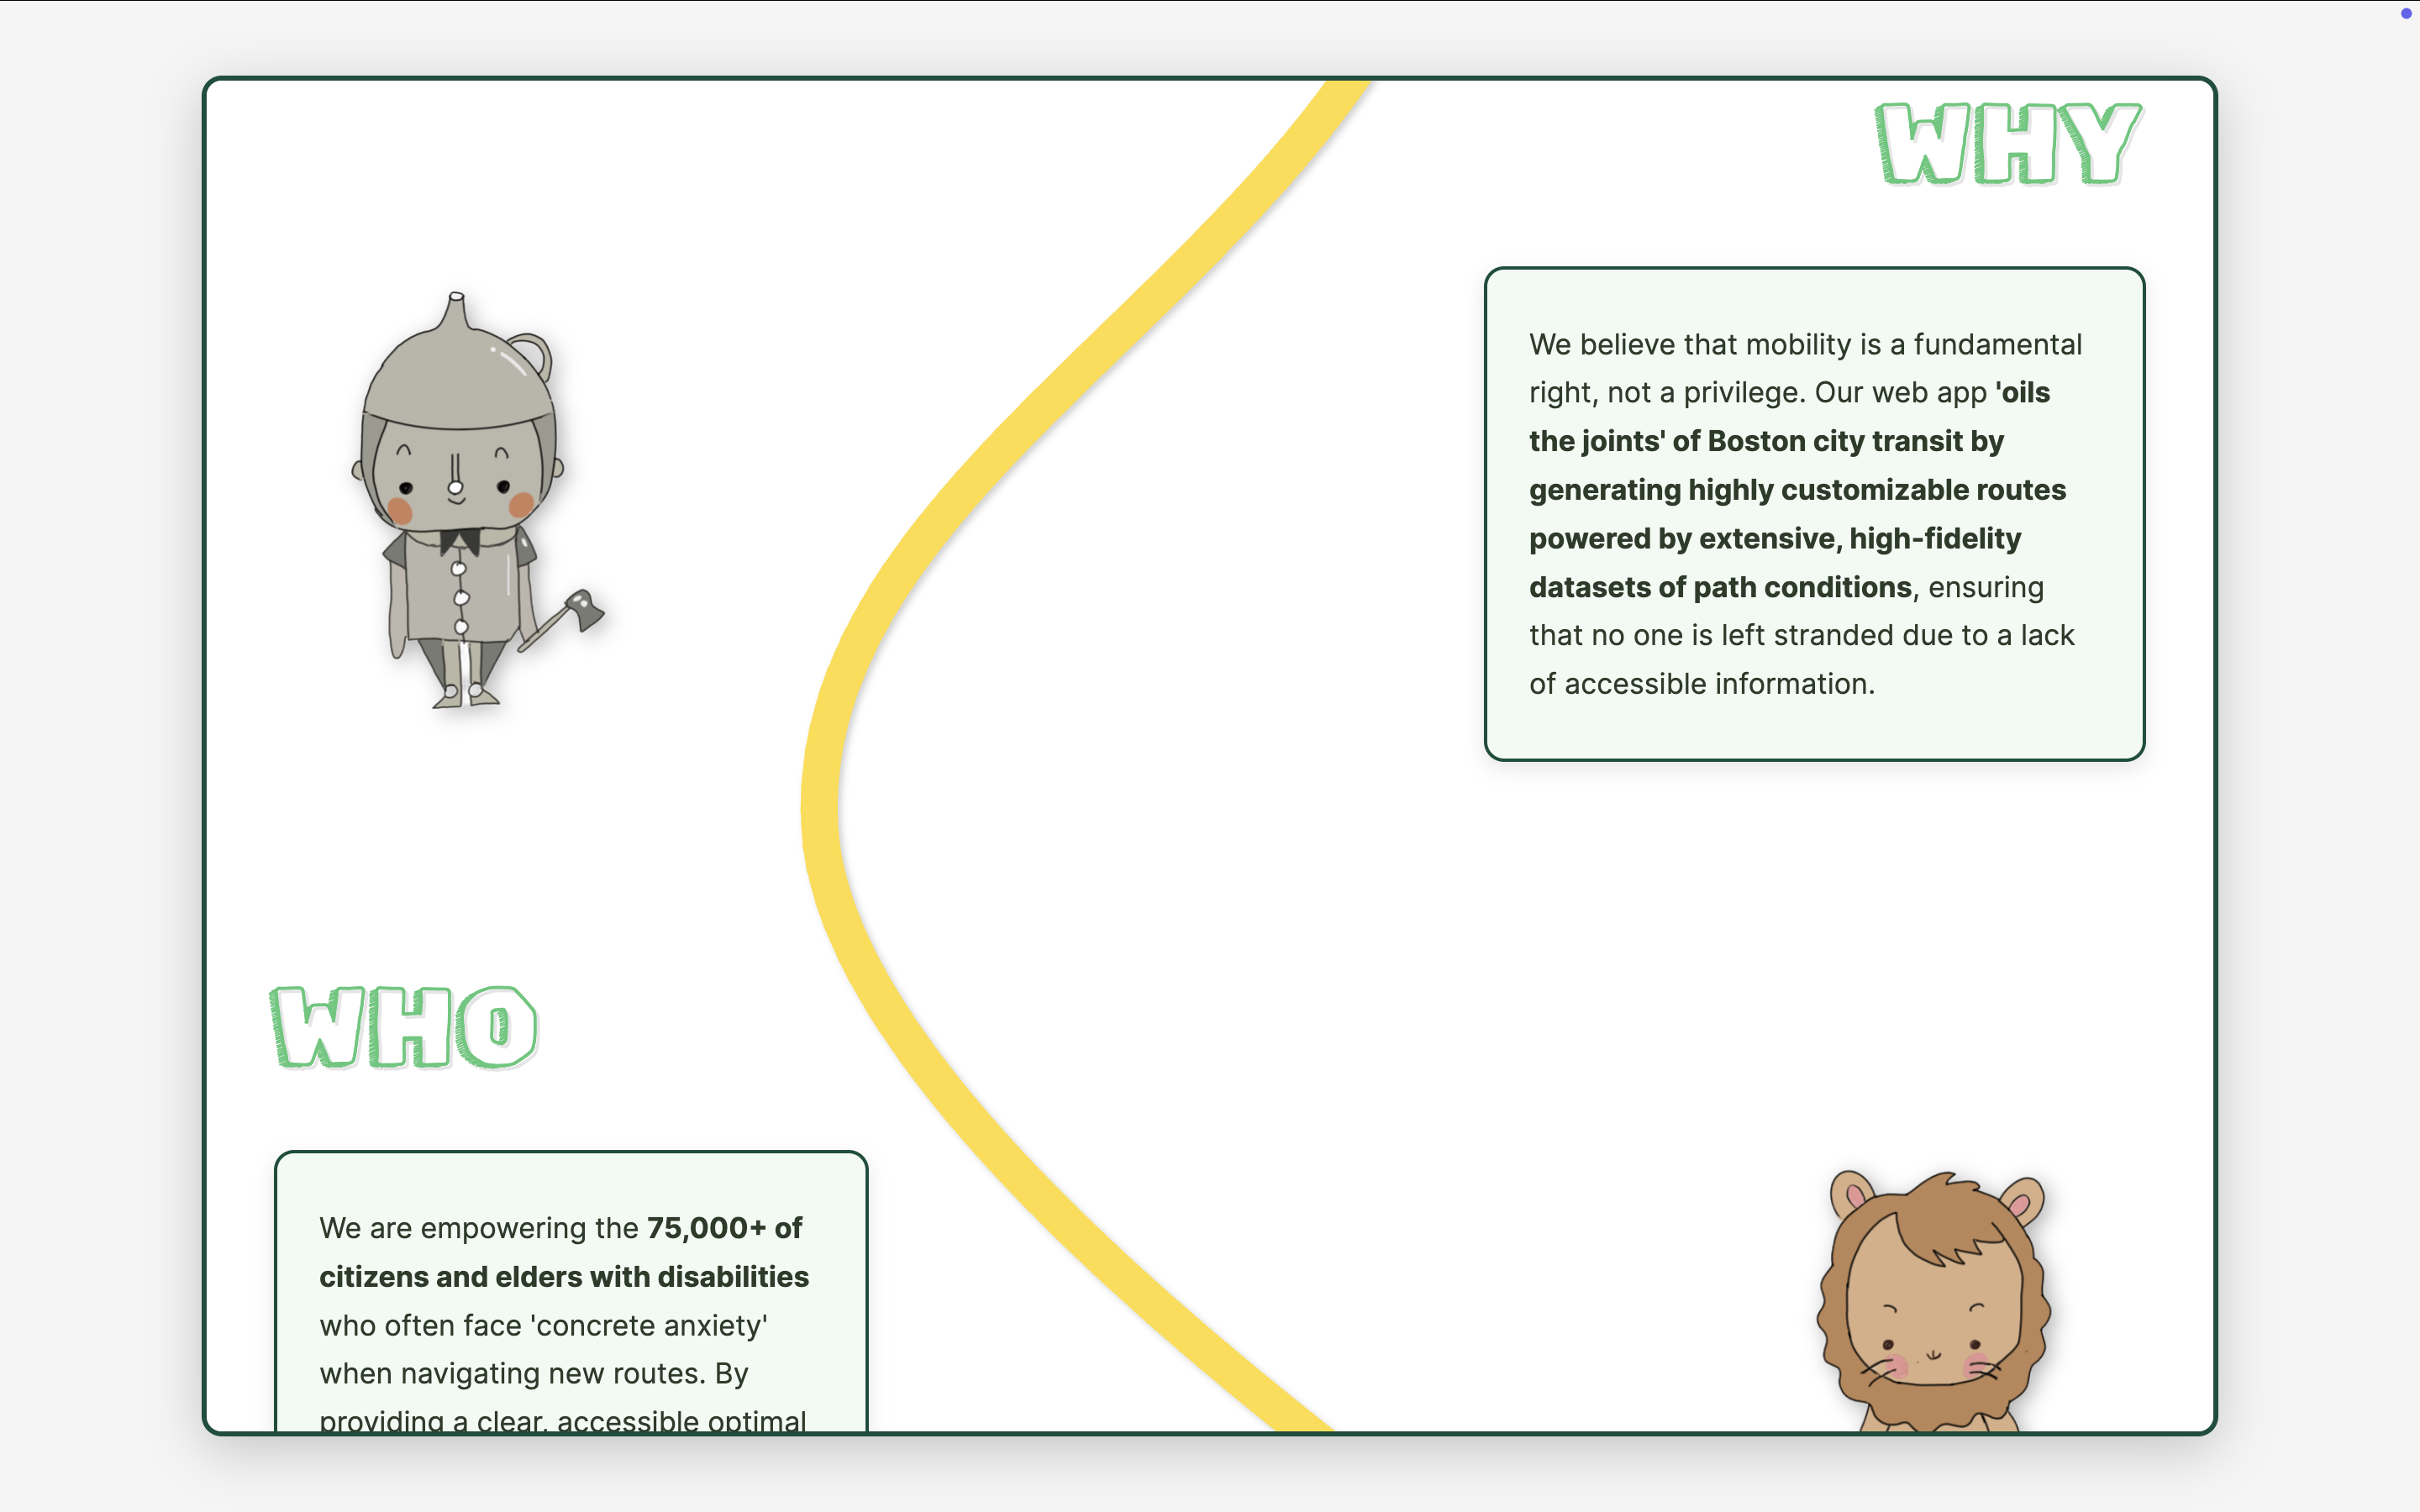
About us page (1)
-
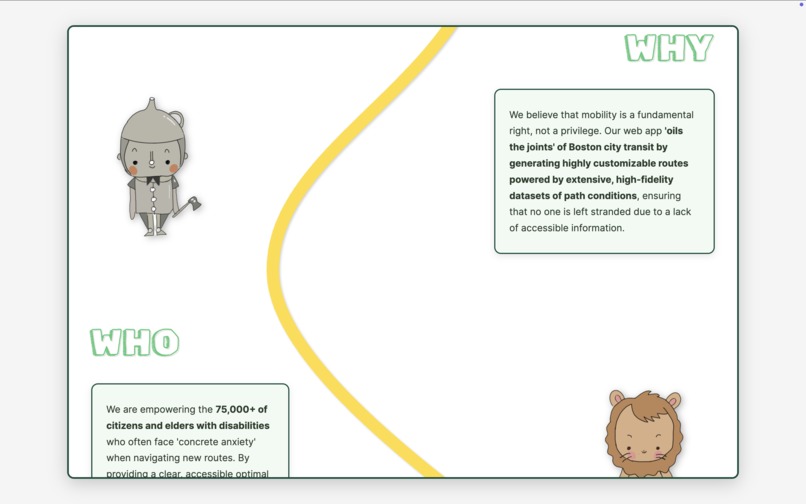
About us page (2)
-
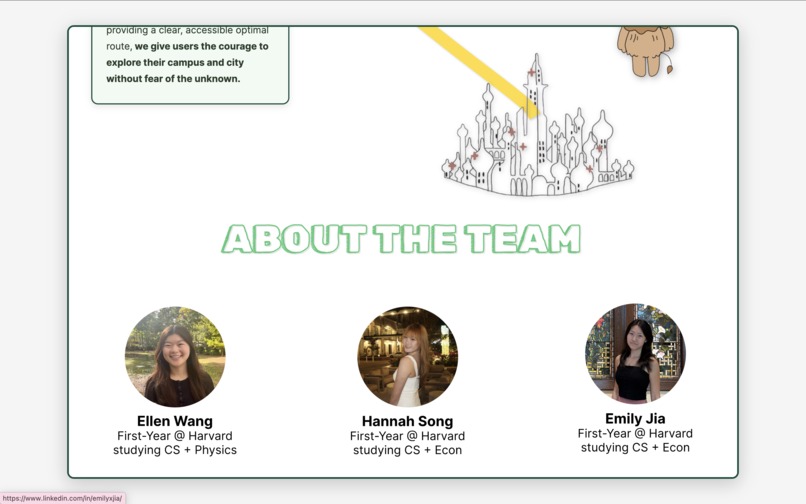
About us/team page (3)


Inspiration
Last week, unprecedented amounts of snow and ice ravaged cities across America. As students who mainly travel on foot, we have experienced firsthand the challenges of traversing through underplowed sidewalks and squeezing through piles of snow to simply cross the street. While we are privileged not have to shoulder this burden on a regular basis, this is a reality for millions of people worldwide.
Modern metropolises are known for their scale and connectivity, but urban infrastructure doesn’t take into account those with mobility needs. For these users, there are many unknown risks with taking sidewalks, leaving 12.2% of U.S. adults (roughly 1 in 8) who live with a mobility disability with “concrete anxiety.” Up to 48% of sidewalks remain inaccessible, which forces these individuals to stay home or get injured. There is a lack of critical data on floor surfaces, path widths, and steep inclines, all of which can greatly affect the safety of city commutes.
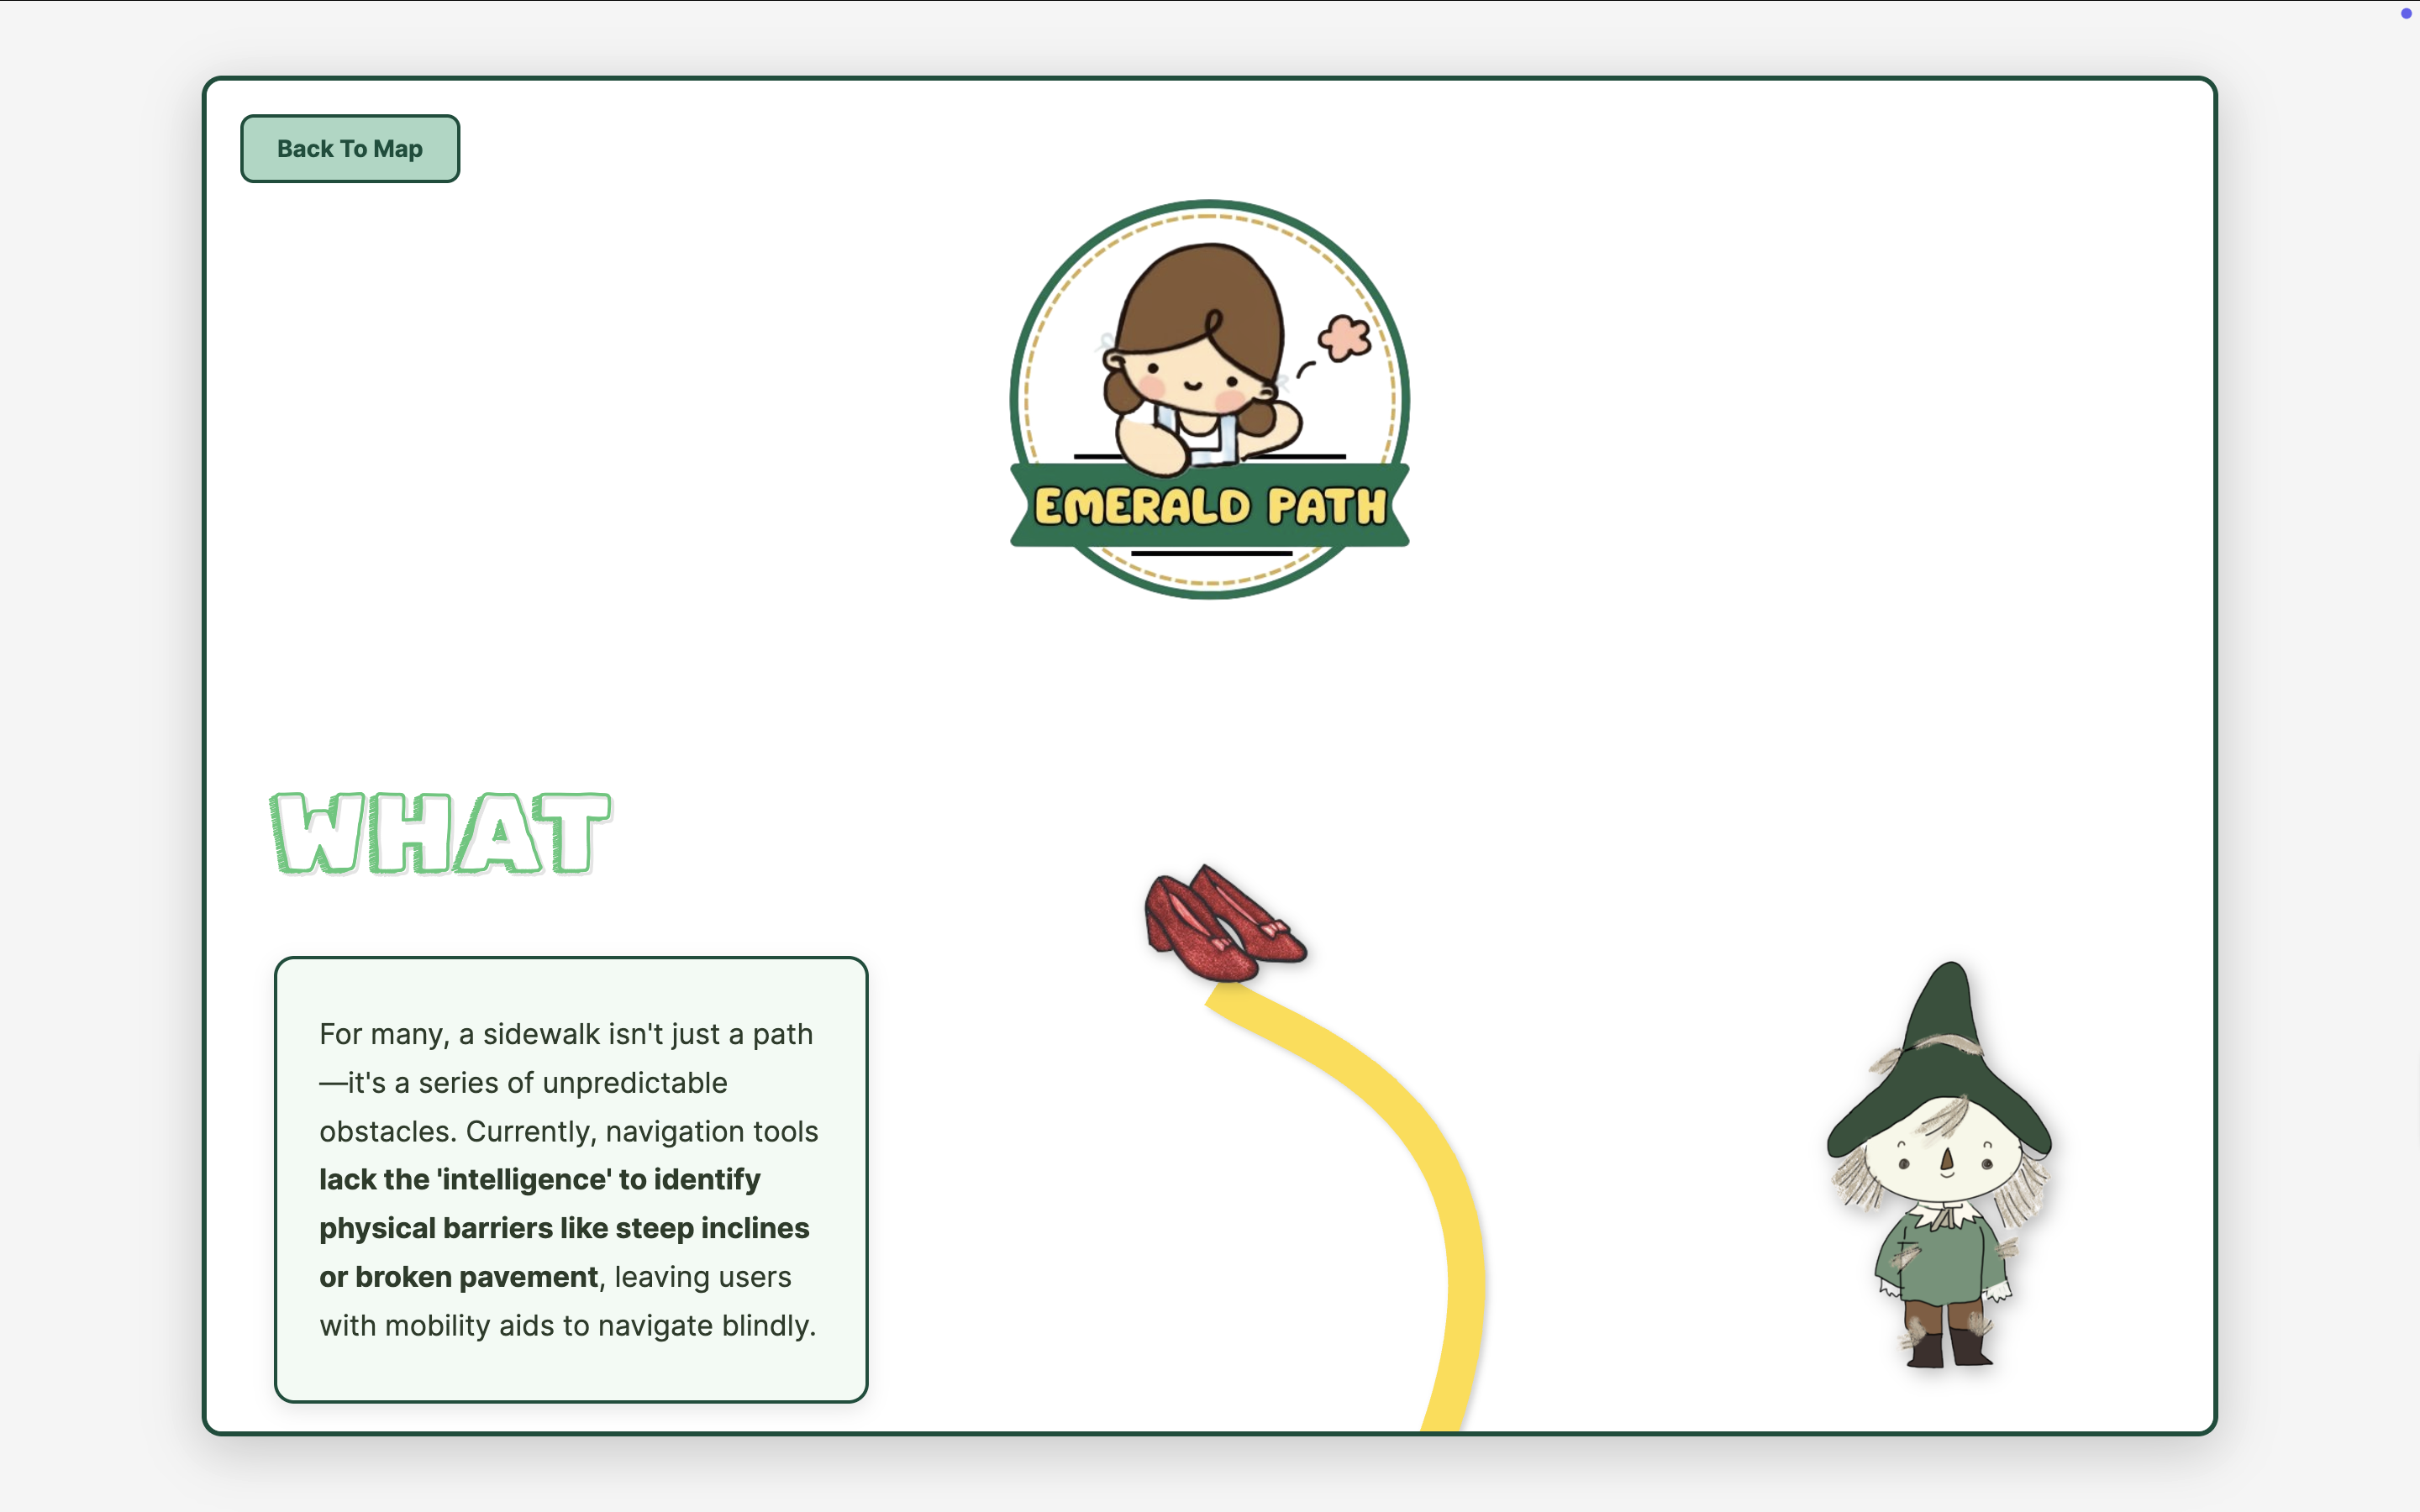
Research shows that people with mobility difficulties are nearly 4.6-10 times more likely to face depression and anxiety. Effective digital maps are proven to reduce such distress. However, programs such as Google Maps and Apple Maps aren’t specifically designed for those in need. In particular, our home city of Boston has 75,000+ citizens with disabilities while simultaneously having ongoing issues regarding broken sidewalks, narrow pathways, and a backlog of 1,000+ pending curb ramp repairs. Even though it is a flat, historic walking city, many areas are uneven and brick-paved, making navigation difficult, especially in the winter. We aim to directly combat this issue by creating software that directly translates their concerns into reality. By providing a clear, accessible, optimal route, we give users the courage to explore their campus and city without fear of the unknown.
What it does
Our app is an interactive tool that allows users to filter sidewalks by specific preferences related to their needs, such as their preferred incline level, surface material, and sidewalk width. The sidewalks are clearly labeled on an interactive geospatial map, making it user-friendly and visually appealing. Moreover, our app features an algorithm that allows users to find routes between two locations that are compatible with their needs—a more accessible version of existing navigation tools.
How we built it
Embedded within our React app is the Kepler.gl tool, allowing our location features, such as sidewalks and routes, to be visualized on an interactive map. Our program uses the Sidewalk Inventory dataset from Analyze Boston and parses the GeoJSON file to retrieve sidewalk information, including width, hazard level, surface material, and incline. Based on these data points, we implement a filtering feature that lets users select/deselect sidewalk characteristics that pose difficulties for them, and the map updates accordingly.
Our routing algorithm creates a graph of nodes and edges, where sidewalks are stored as nodes, and the weight of each edge is proportional to the distance between sidewalks. Using the A* algorithm, we can find a route between two locations that minimizes total distance and meets a specific user's needs.
On the front end, we started in Figma, where we built a high-fidelity prototype to map out the user flow, but it was hard to translate this design completely. However, through trial and error with different buttons, colors, and functionalities, we were able to implement our idea in the WebApp. React.js was used to manage the application state and logic and ensure that data interactions were fast. Tailwind CSS was used to use exact margins, paddings, and color palettes to establish our brand color. We want our data to be accessible to everyone, and so our application uses a lot of visual cues like drawn icons and custom filters. This makes the UI easy to read and navigate.
Challenges we ran into
While our initial idea was to create a program that displays snow hazards, inspired by the recent snowstorm, we were unable to find a suitable dataset to implement this feature. Moreover, the currently available datasets are huge—parsing our Sidewalk Inventory dataset took a few minutes, and visualizing all sidewalks on our map makes the application more laggy than we would like. For the routing algorithm, we addressed the challenge of runtime by limiting the sidewalks available to a defined area around the start and end locations; however, this could become an issue as we expand our application to more locations worldwide. Similarly, as sidewalks are shapes rather than just points, it is difficult to exactly minimize the distance of the route, as different sides of the sidewalk may have different distances to and from certain points. Our edge-node graph is a good simplification of the sidewalk system; yet, a more precise way of storing the sidewalk data may be helpful.
Accomplishments that we're proud of
This was the first hackathon for every member of our team! We are incredibly proud to have brought our ideas to life from scratch, despite limited technical experience as college freshmen. Dedicating ourselves to this project for the past 24+ hours has been tiring but immensely fulfilling, and we truly believe that our application, with adequate future development and prototyping, can make a lasting impact on millions of people.
What we learned
On the planning side, we learned to brainstorm and conduct the initial research needed to ensure the rest of the workflow goes smoothly. Rather than jumping directly into software development, we conducted extensive research on the tools available to us and whether they would be compatible with one another. Of course, we were not able to use all the libraries and APIs we initially found, but our understanding of what is available has broadened significantly, and we have gained a deeper appreciation for the tools and possibilities ahead.
On the technical side, we all gained invaluable experience not only using React, JavaScript, Tailwind, CSS, Figma, and Kepler individually, but also combining them to assemble a larger project. We all ventured out of our comfort zones and tried something new —using Figma or learning a new language—despite inevitable challenges. Our perseverance and determination led us to a final product we are proud of.
(on a real note, we learned that sleeping on an air mattress and operating on minimal sleep is hard :sweat_smile:)
What's next for Emerald Path
As many factors that may affect sidewalk accessibility—such as the presence of snow—need to be updated in real-time, we hope to implement a feature where users can update the live status of the sidewalk on a day-to-day basis. The attributes of each sidewalk will be updated accordingly, enabling the algorithm to provide more accurate routing recommendations for users with disabilities. In addition, as we improve the functionalities of the program, we hope to expand our reach to more and more cities, not just Boston.
Built With
- css
- javascript
- json
- kepler
- react
- tailwind


Log in or sign up for Devpost to join the conversation.