-
-

logo
-
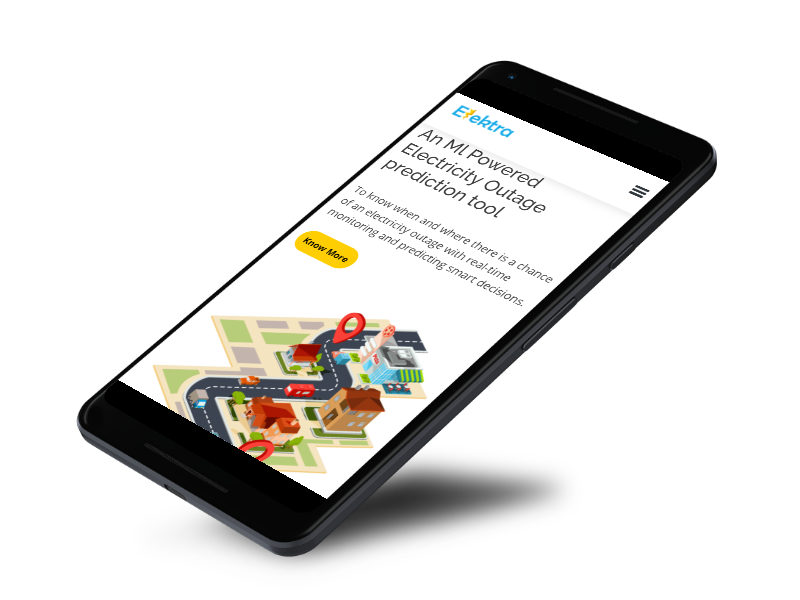
responsive
-
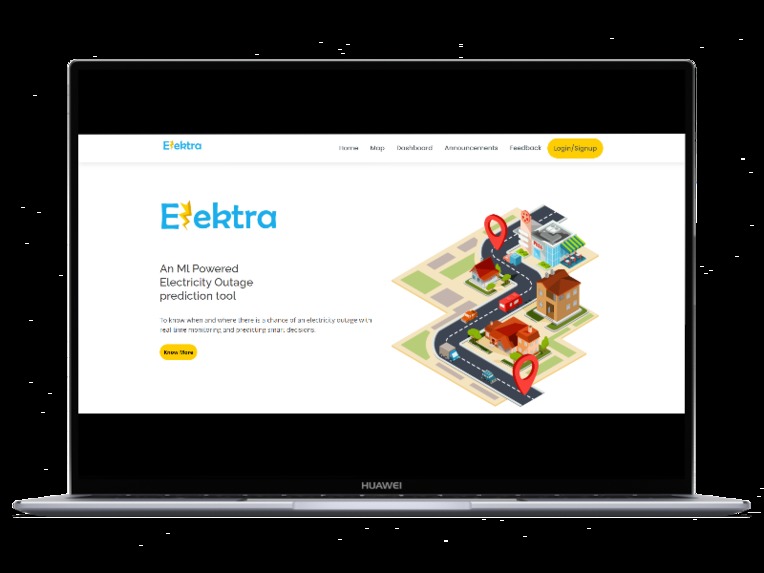
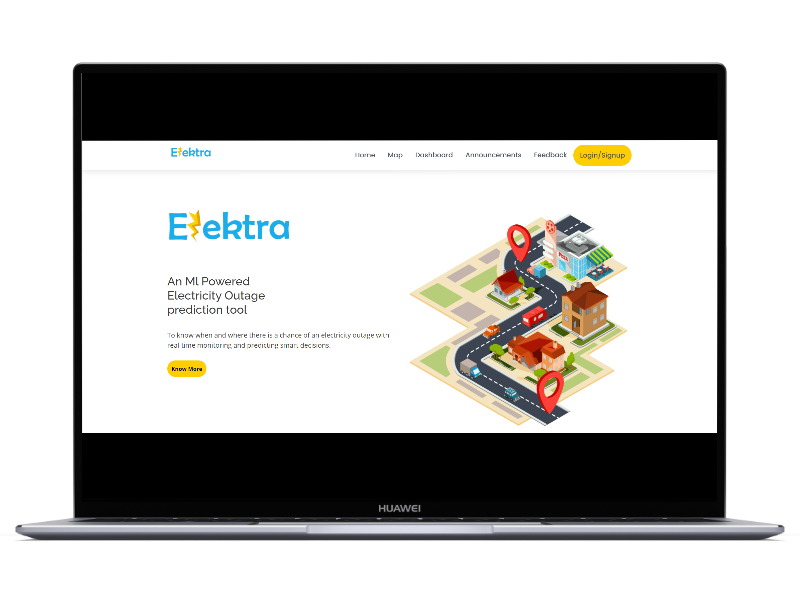
home_page
-
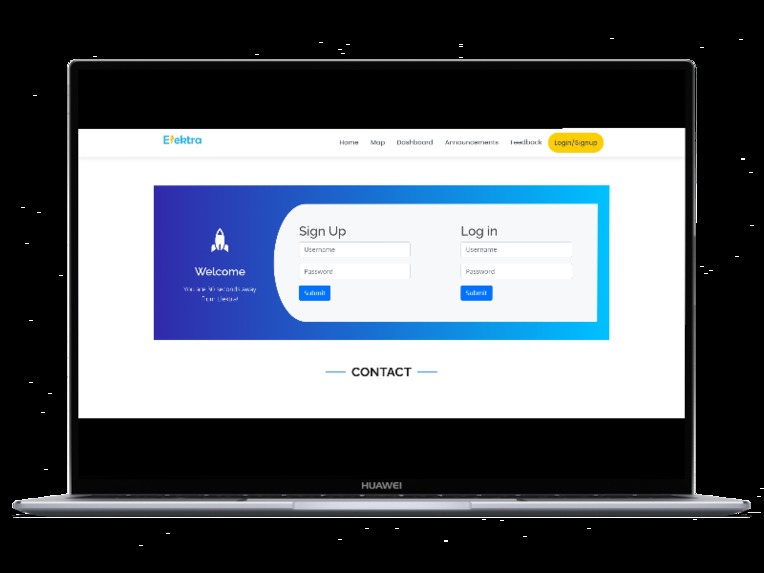
logn
-
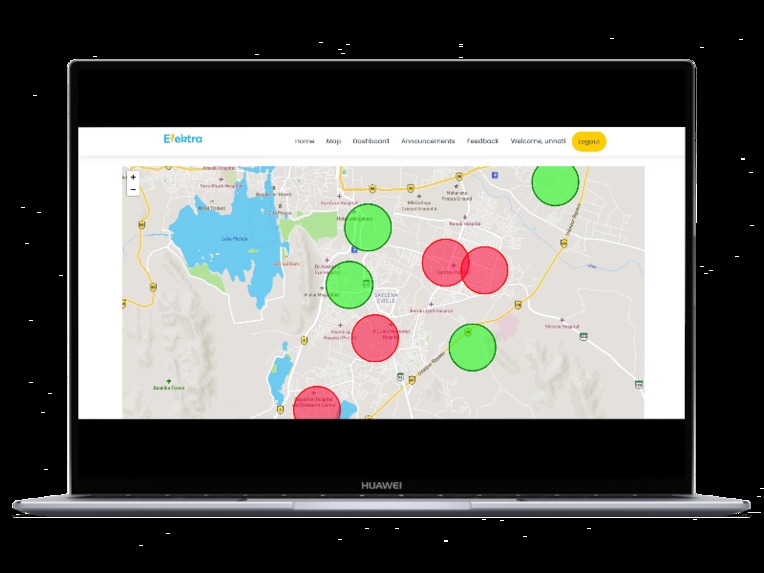
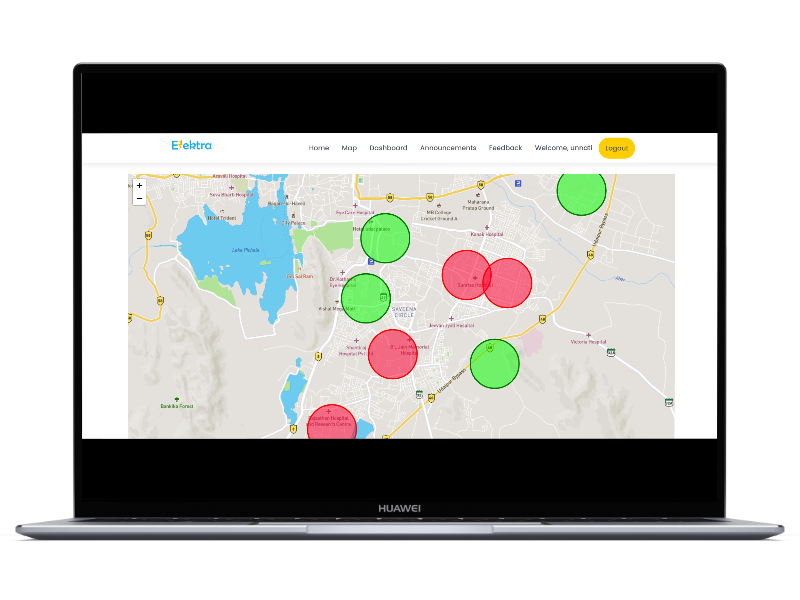
Map
-
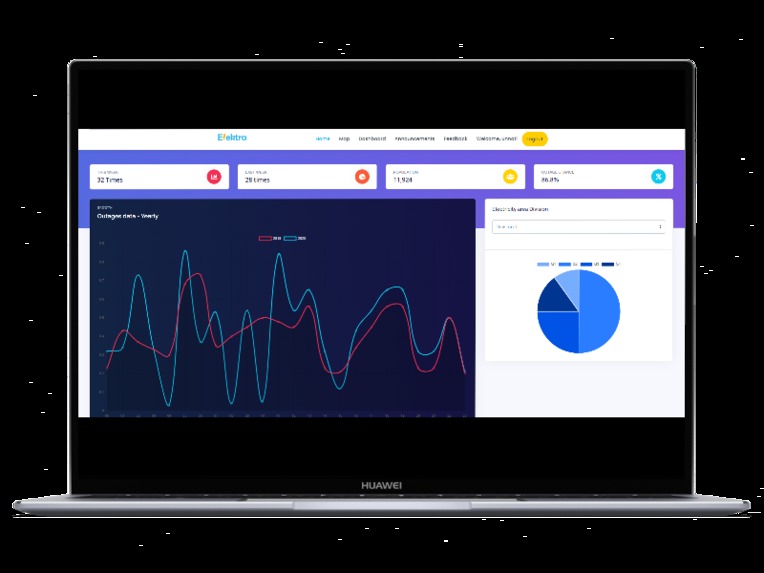
Dashboard


Inspiration
In India, there is a problem of Electricity Outage every now and then, especially in some states. So, we want to build a web app wherein people are able to report, real-time monitor & track the electricity outages in their area of the city.
What it does
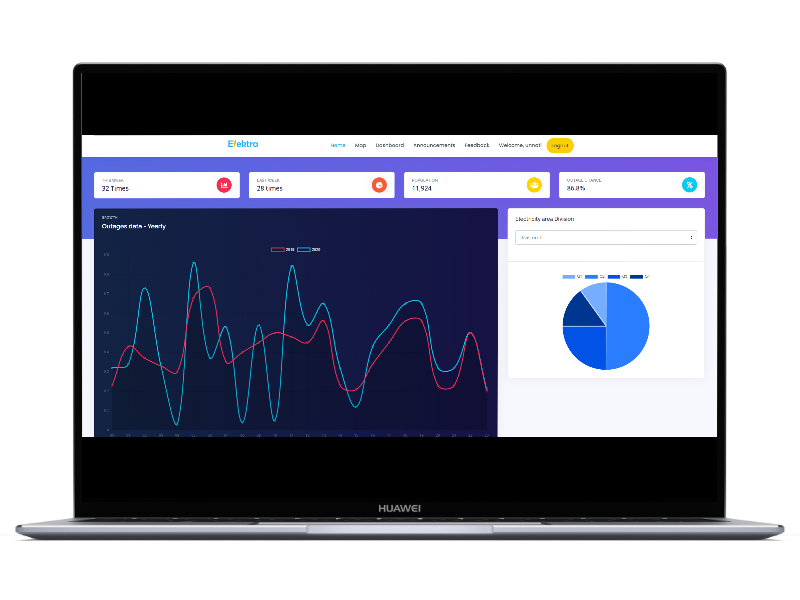
It allows people to report, track, and real-time monitor the electricity outages in their area of the city and visualize it through Maps, Line graph, Pie-chart, etc, in response to which the Electricity Department will try to track and solve the fault in their area.
The Flow
User / Admin Login, Map view, Dashboard, Comparison between 2 divisions of the city, Year-wise analysis of outages, Announcements, Public Feedback form.
How I built it
We built it using HTML5,CSS3,JavaScript,Bootstrap,Django,Sqlite,Google Maps API, GCP(for deployment). As it is a Web-app, we made it by dividing it into different pages and components. For example- The home page, Dashboard, Login/SignUp page, Announcements section, and the feedback page and then we combined it to make this Web-app.
Challenges I ran into
It was challenging to find a 3D map representation for our web-app. Also, it was very challenging for us to deploy our site on GCP, as it was our first time using it.
Accomplishments that I'm proud of
We successfully completed our project in time and it turned out pretty good than what we were expecting.
What I learned
We learned how to deploy a project on GCP. We learned how to integrate Google maps and how to get the location of a user and display it on the map. Also, we learned how to divide work among different team members and work accordingly.
What's next for Elektra- An ML-powered Electricity Outrage Prediction tool
ML models can train themselves and real-time monitor the outage duration in advance.
ML model can predict future loss due to power cut.
Instead of a web/mobile app, we can fit IOT sensors on electric poles which will directly send the signals of an outage.


Log in or sign up for Devpost to join the conversation.