-
-
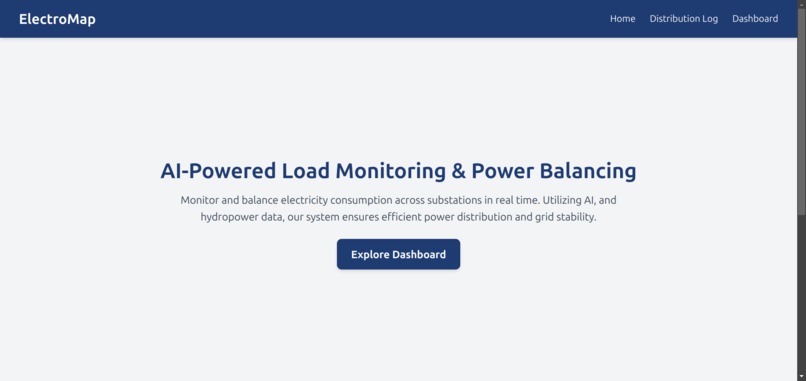
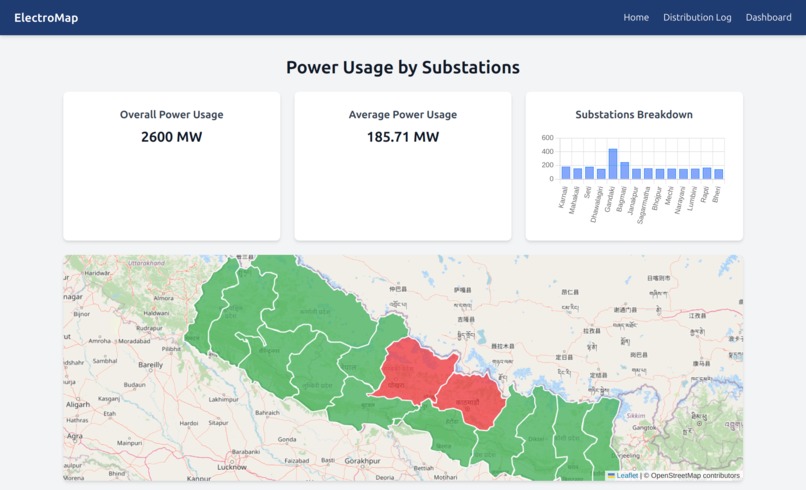
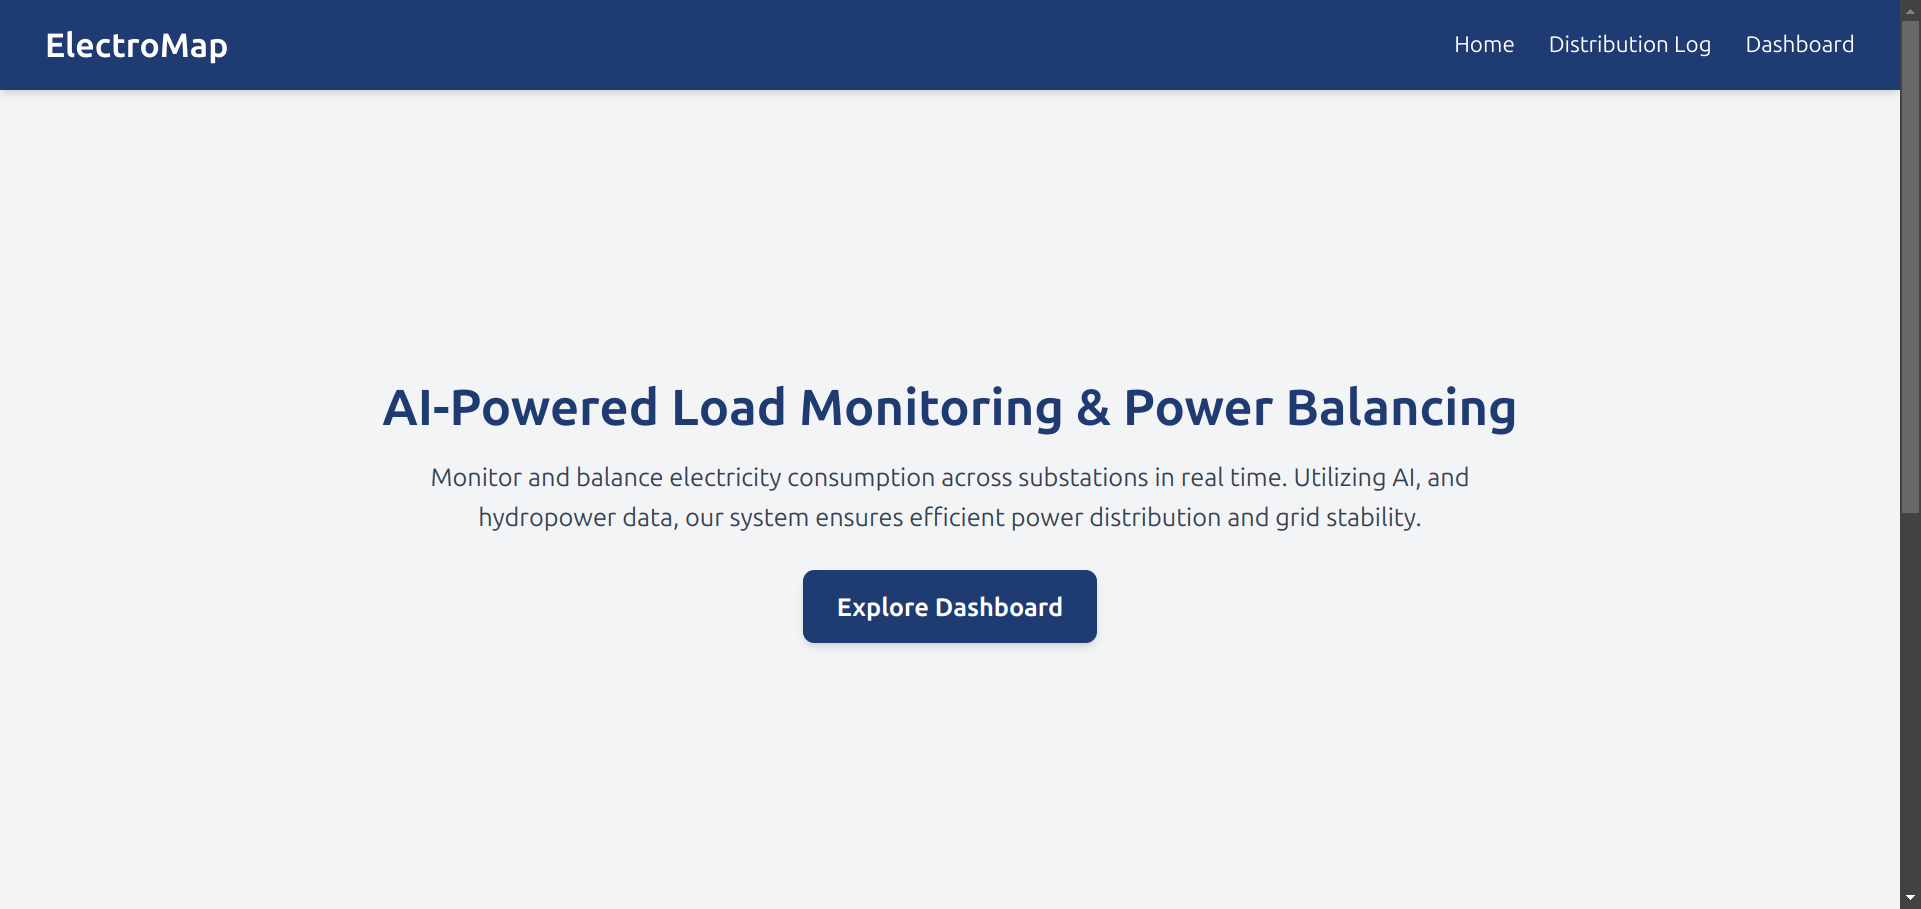
landing page
-
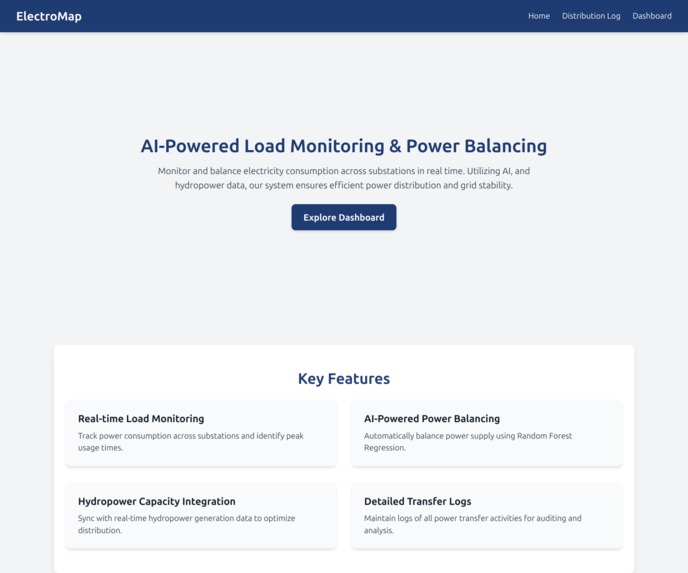
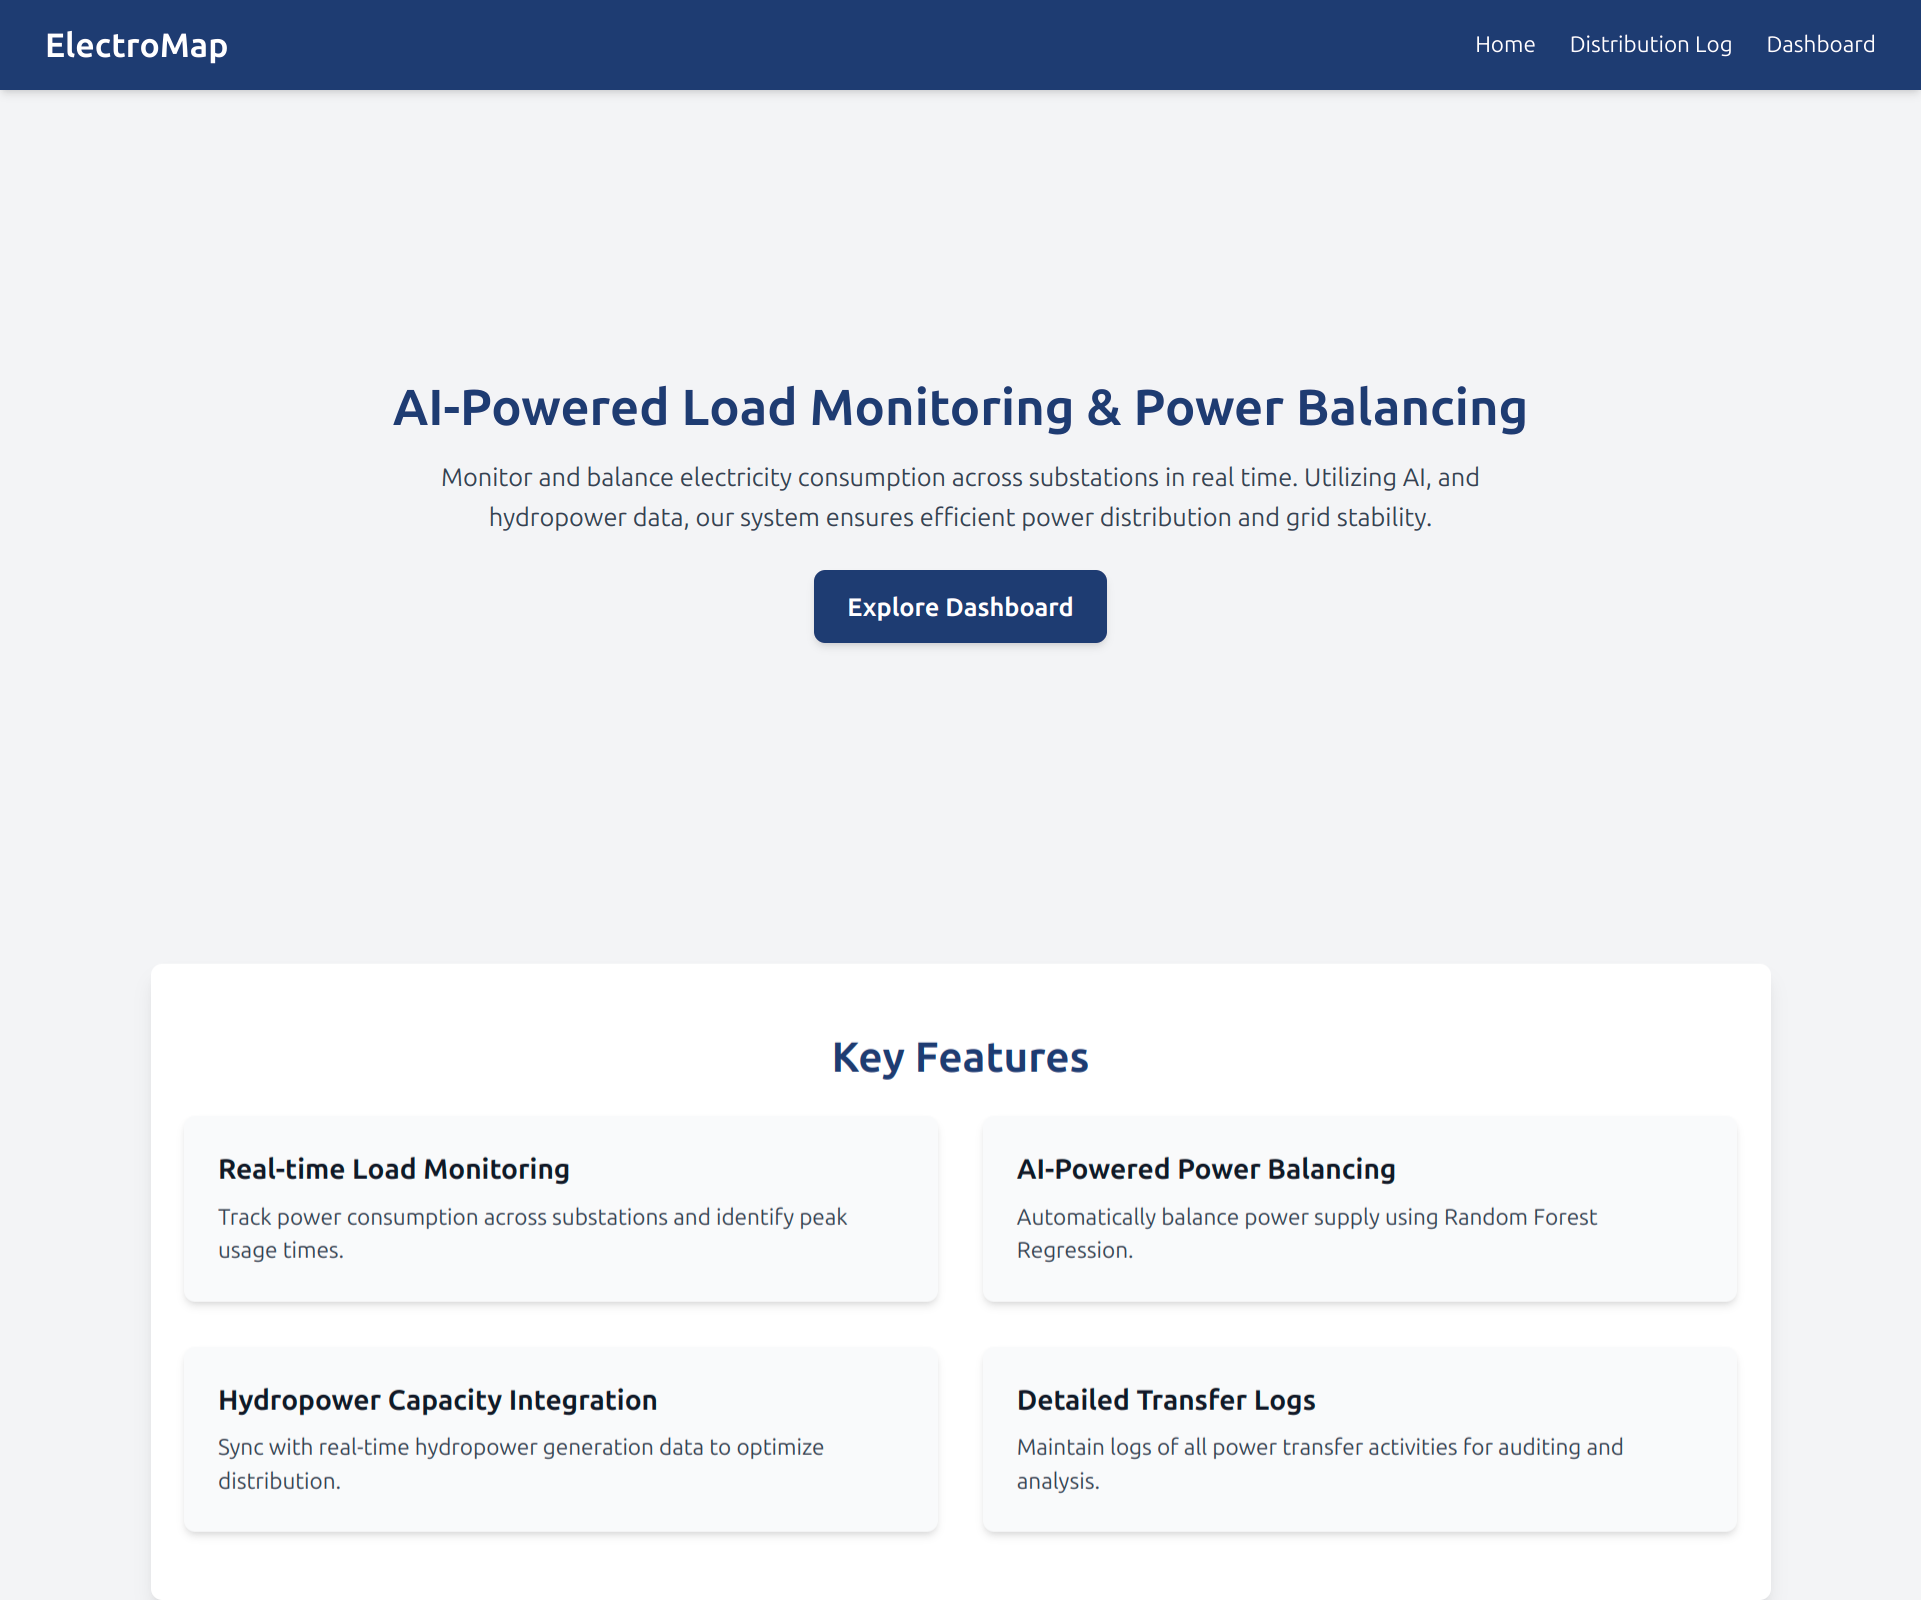
landing page
-
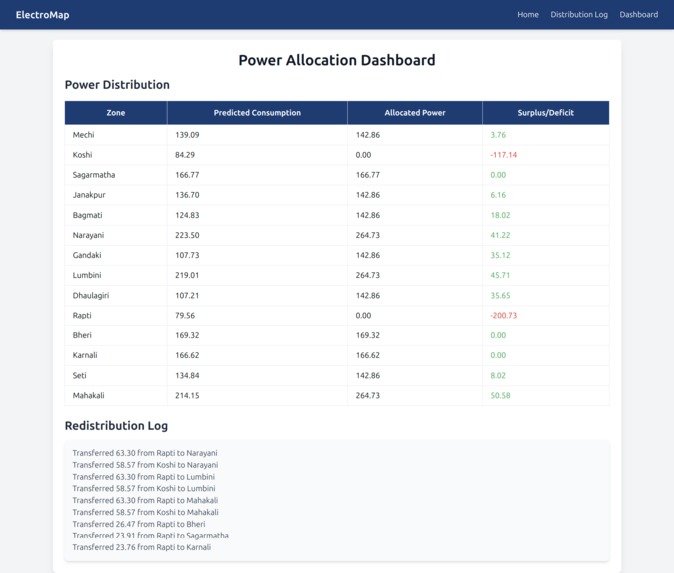
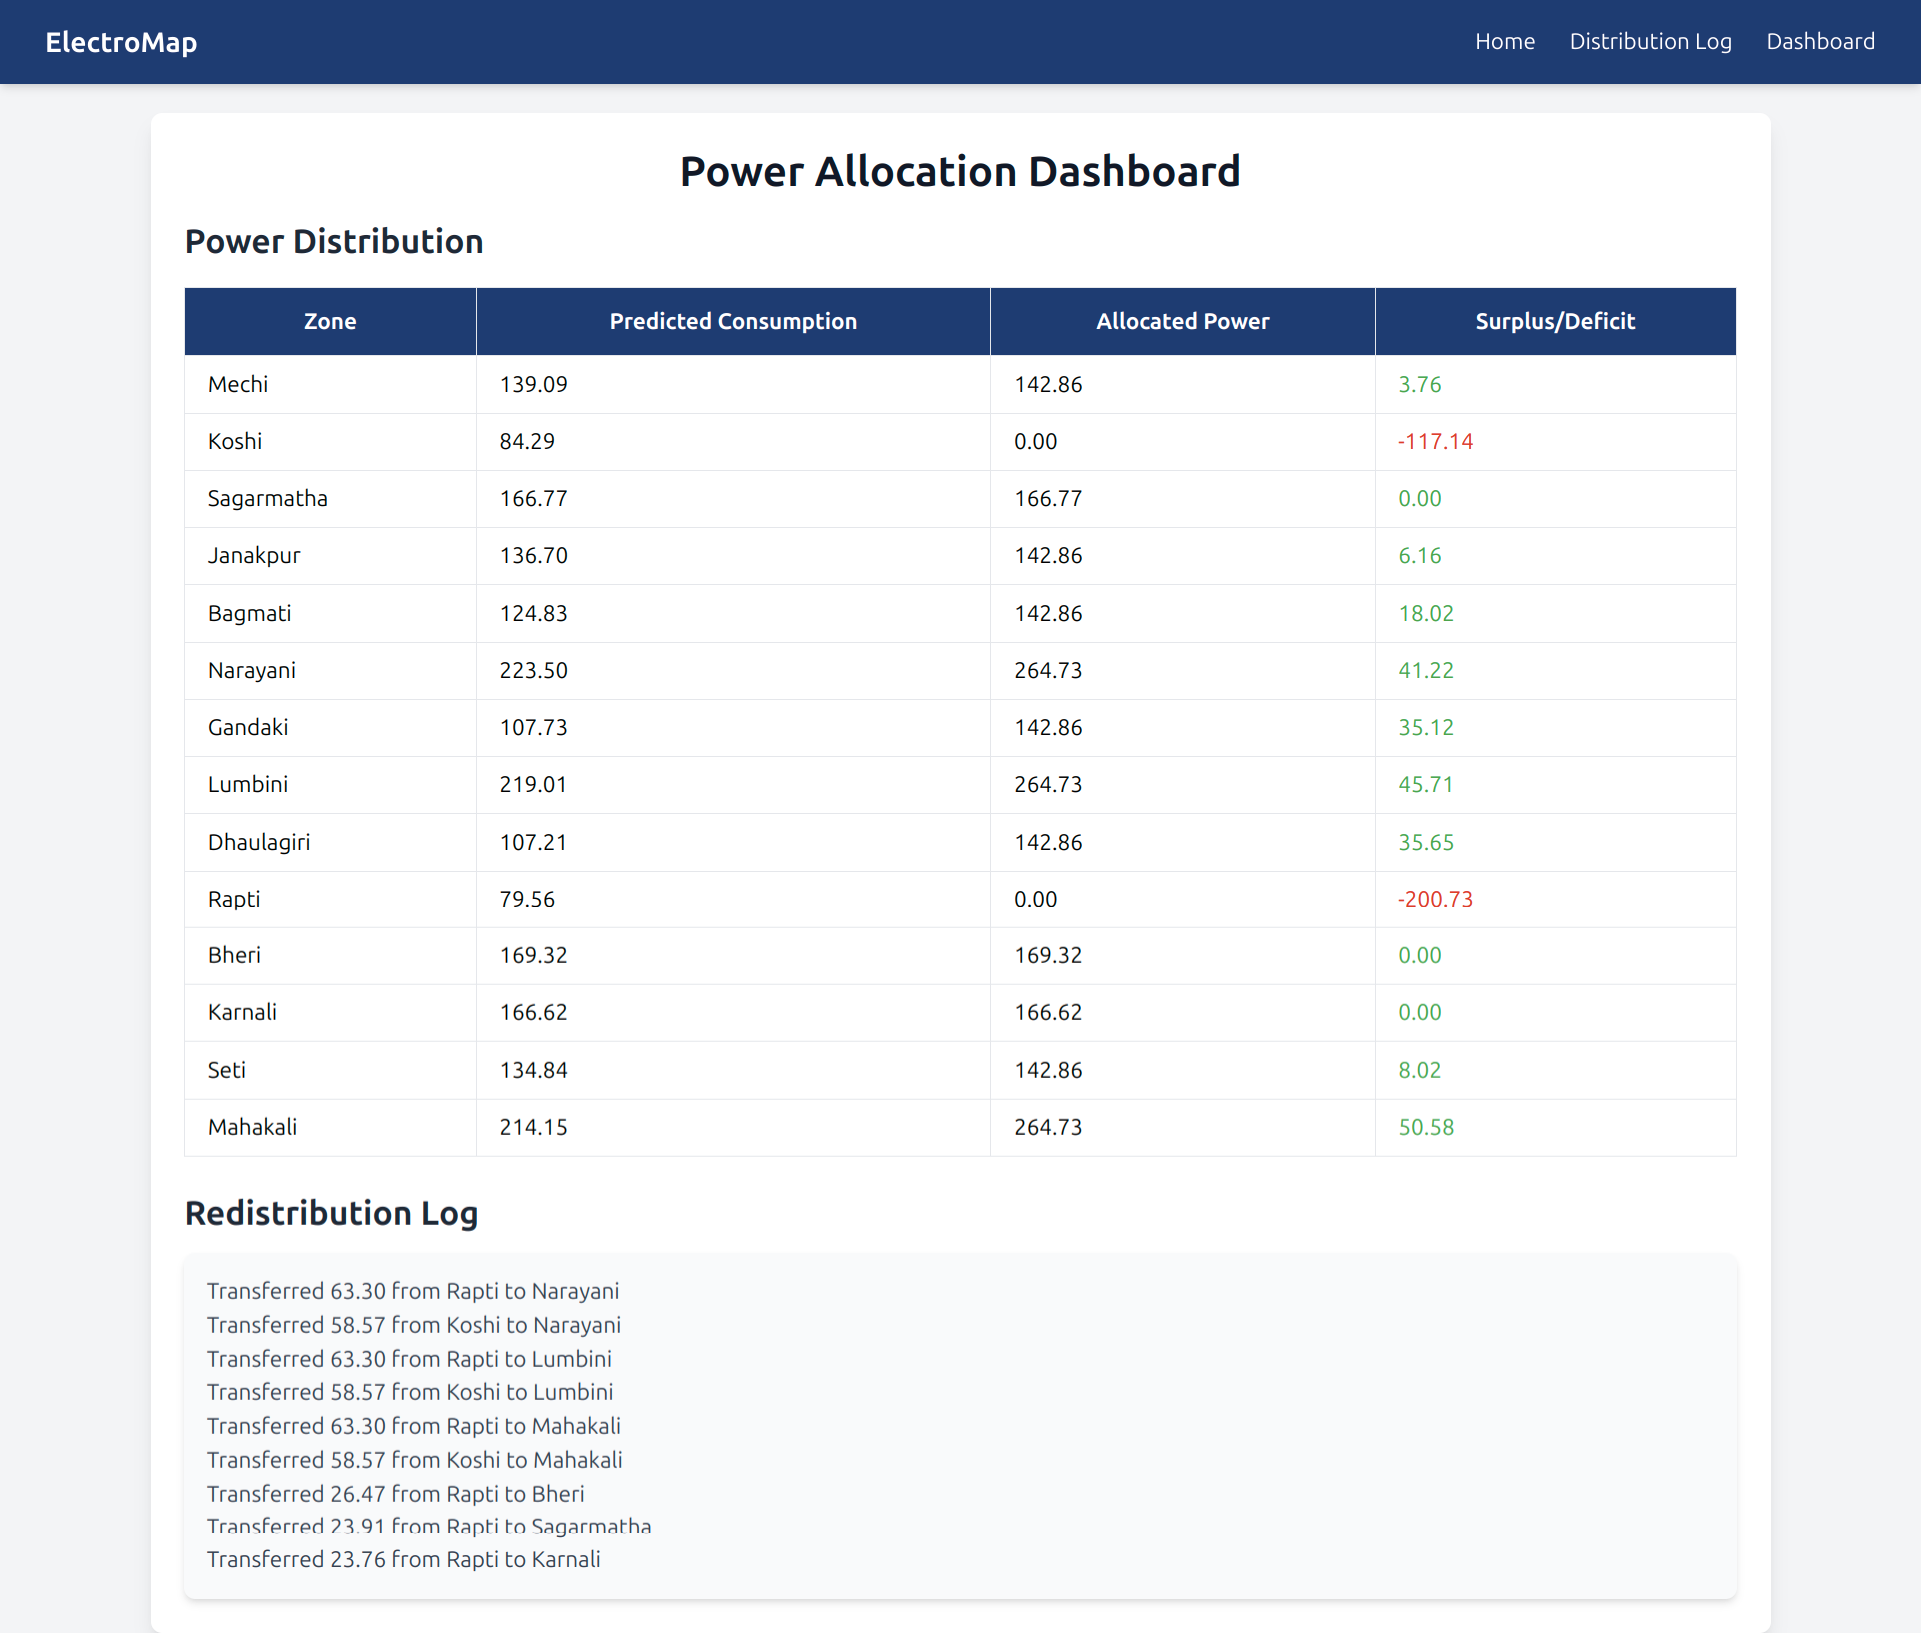
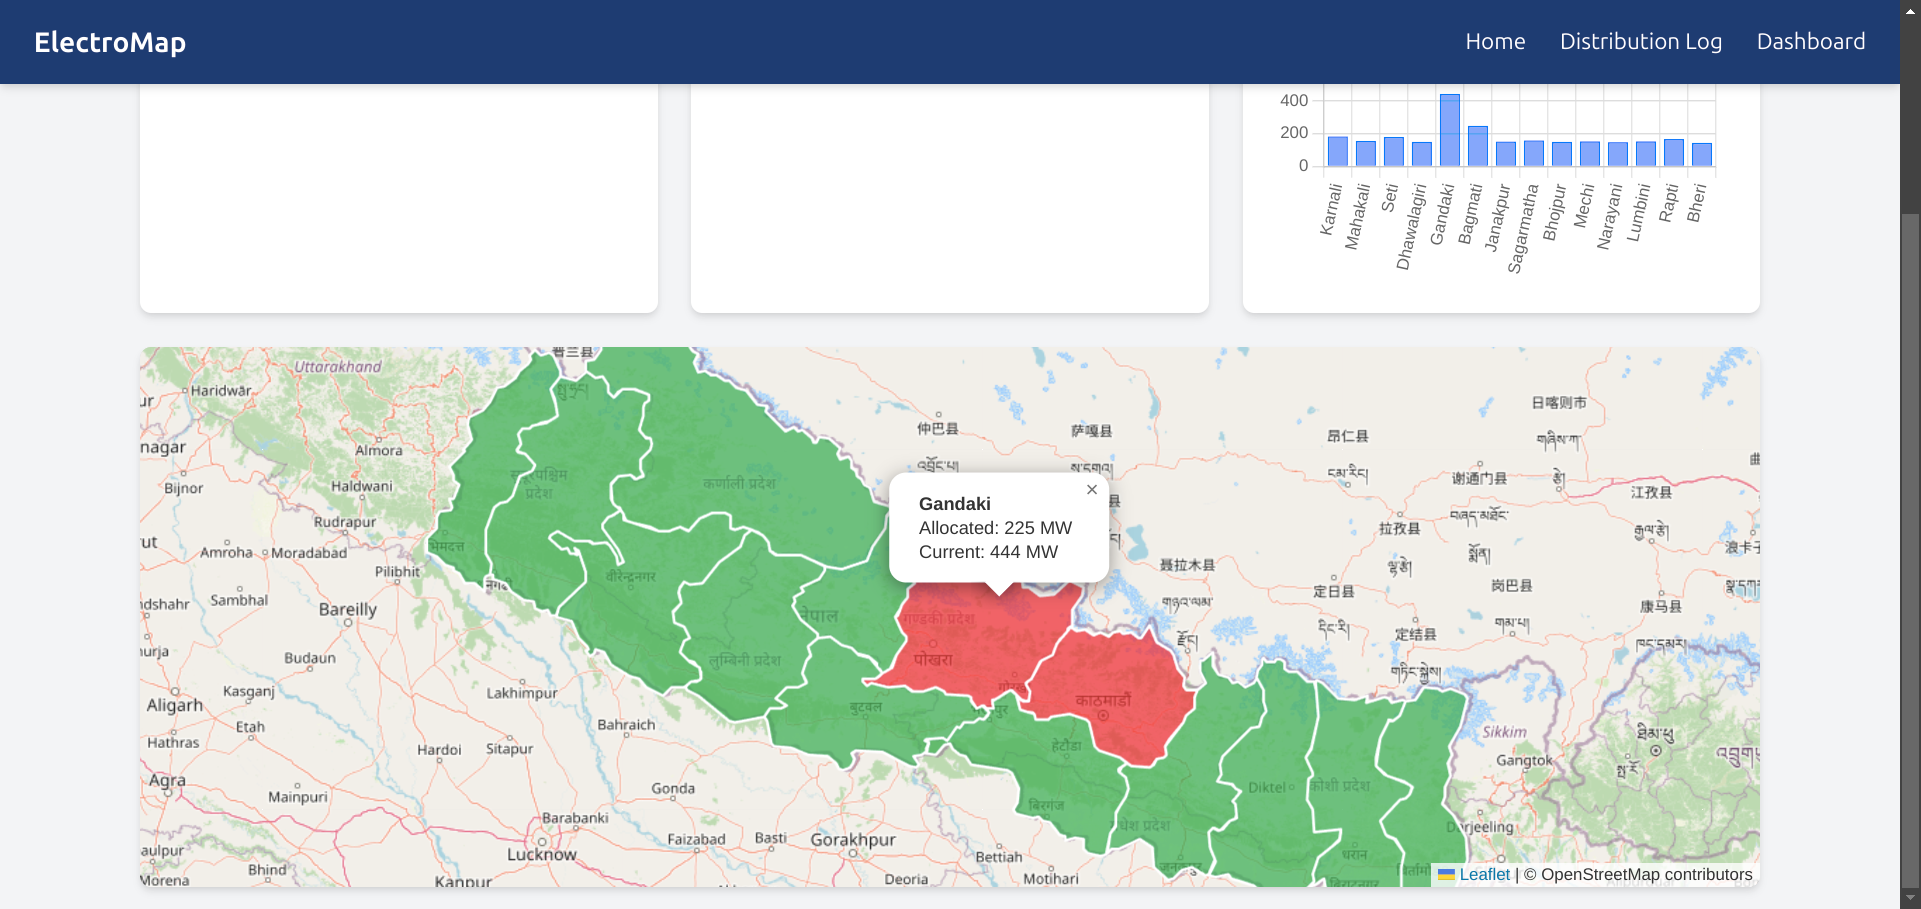
power distribution using machine learning and Redistribution Log
-
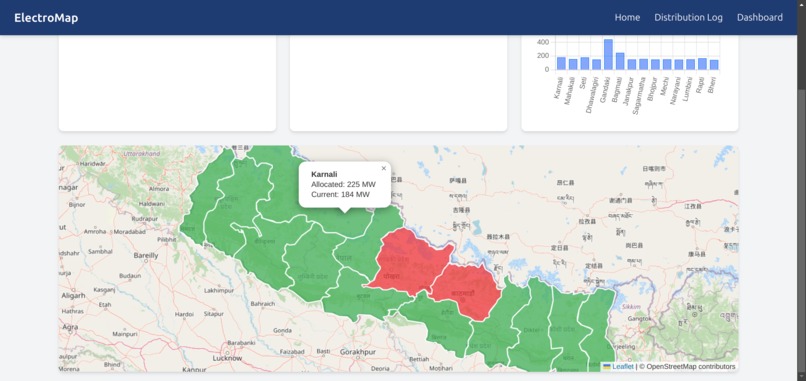
power consumption monitoring - power over allocated
-
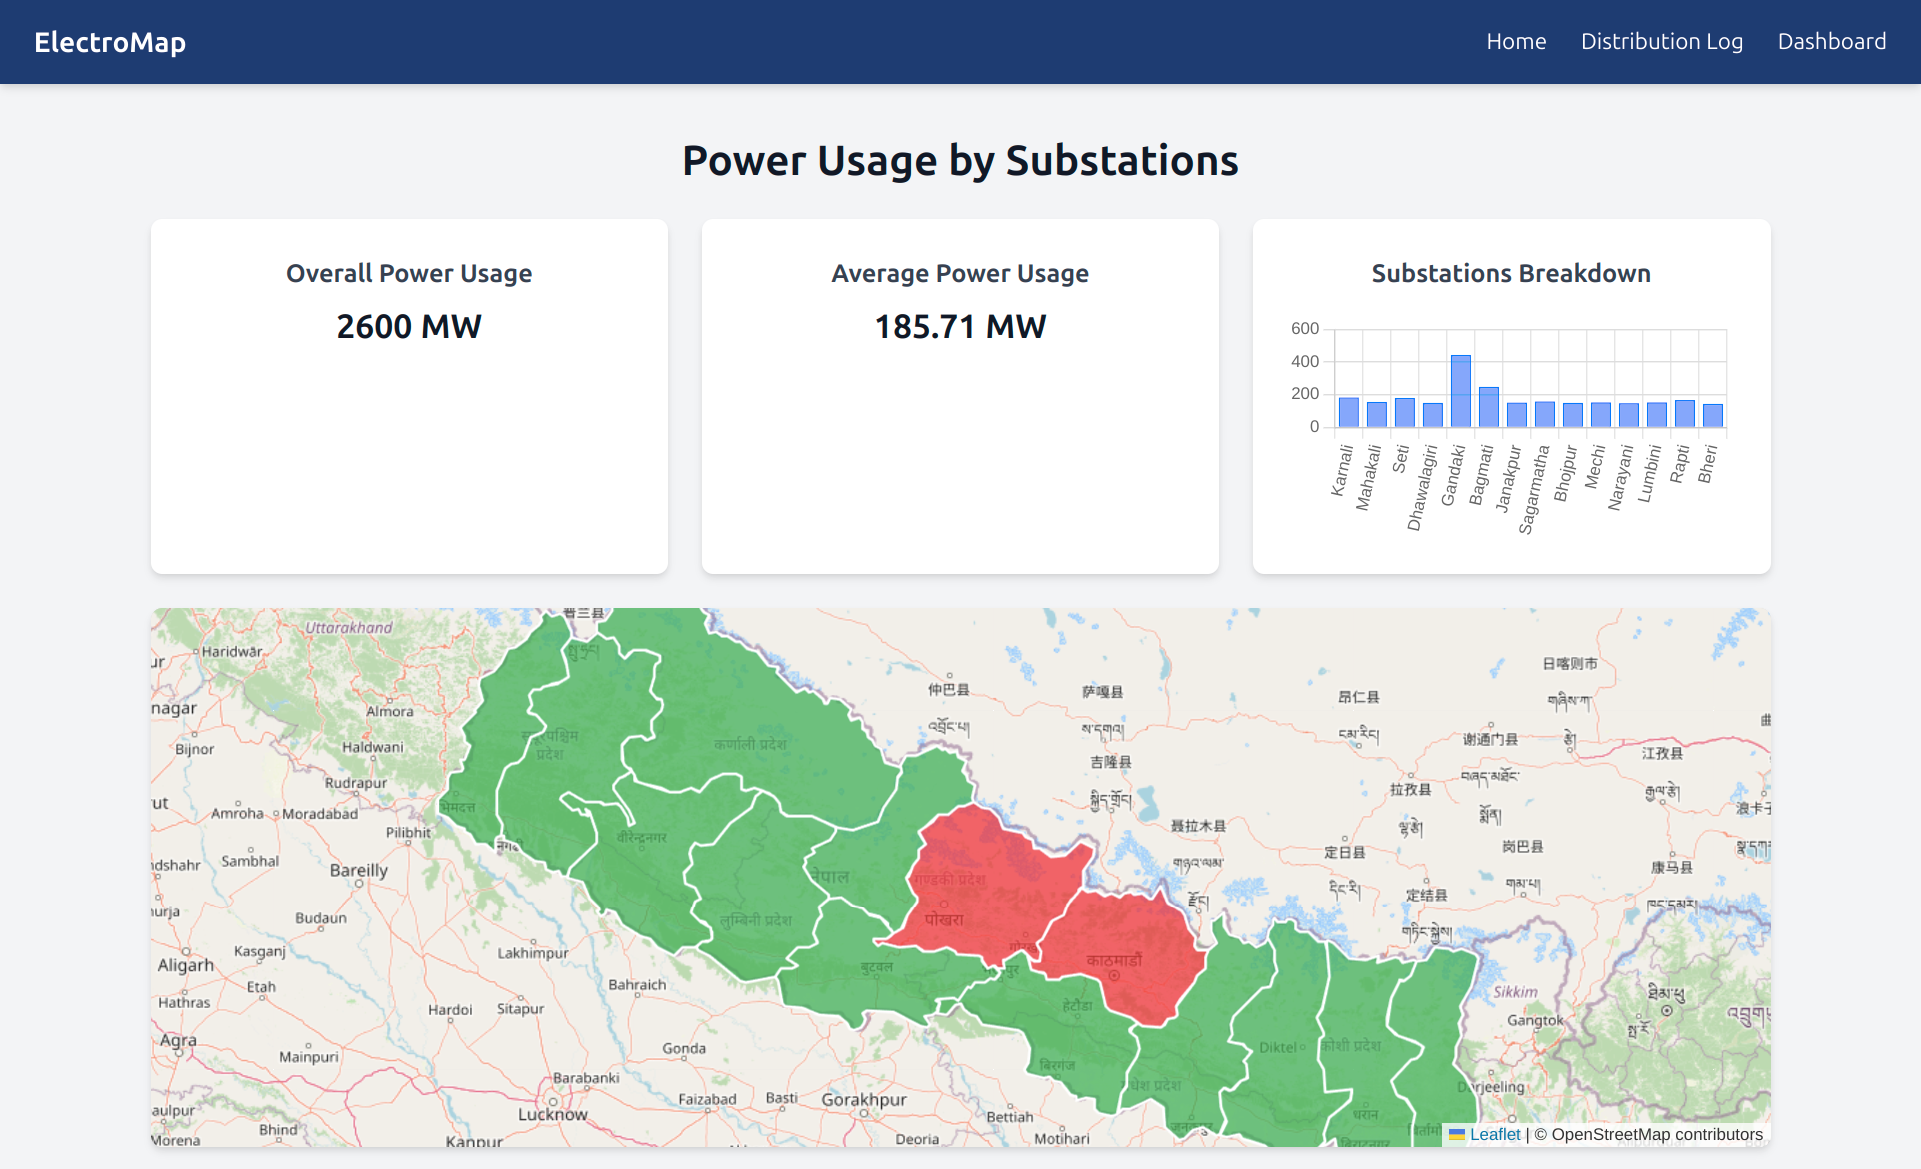
power consumption monitoring
-
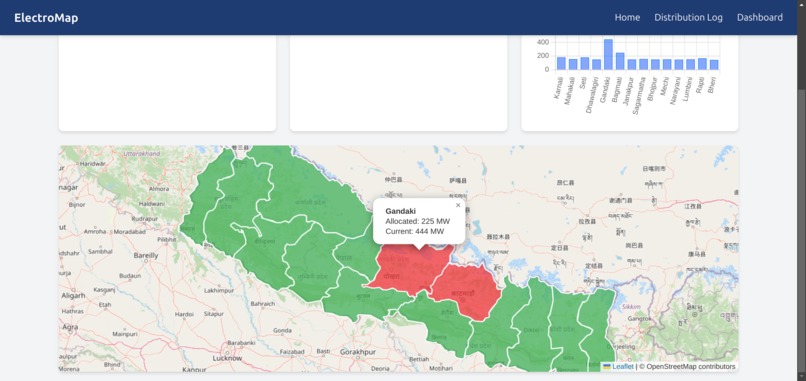
power consumption monitoring - power insufficient
-
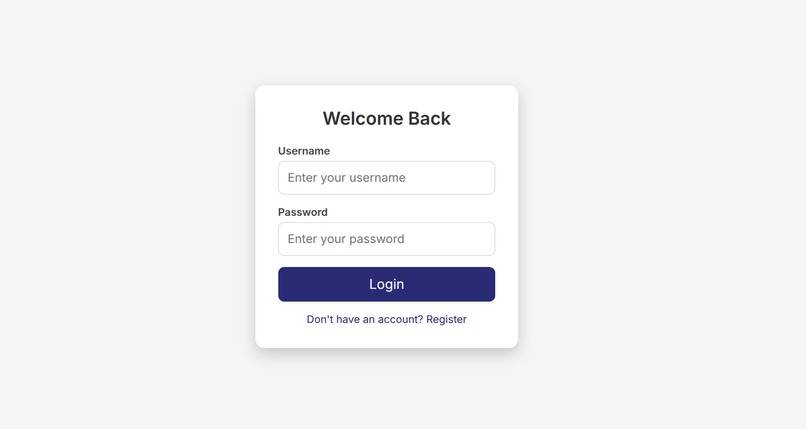
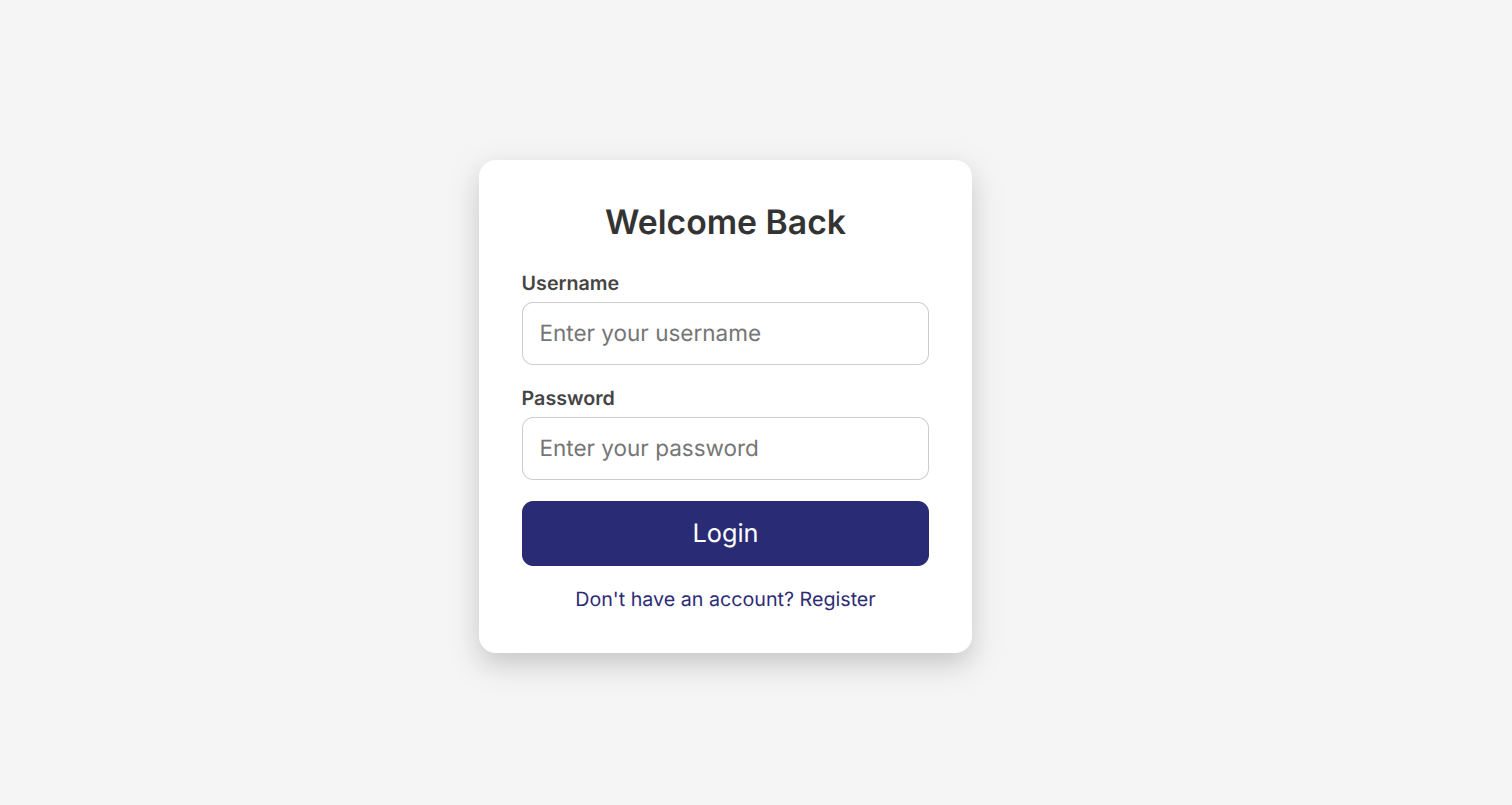
login page
-
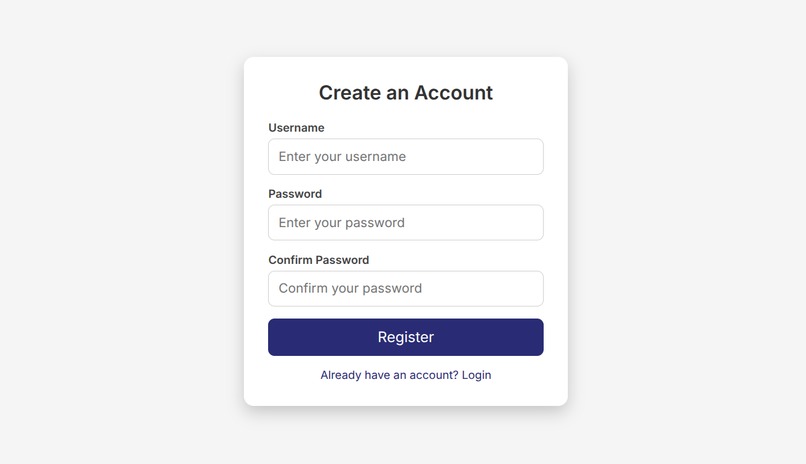
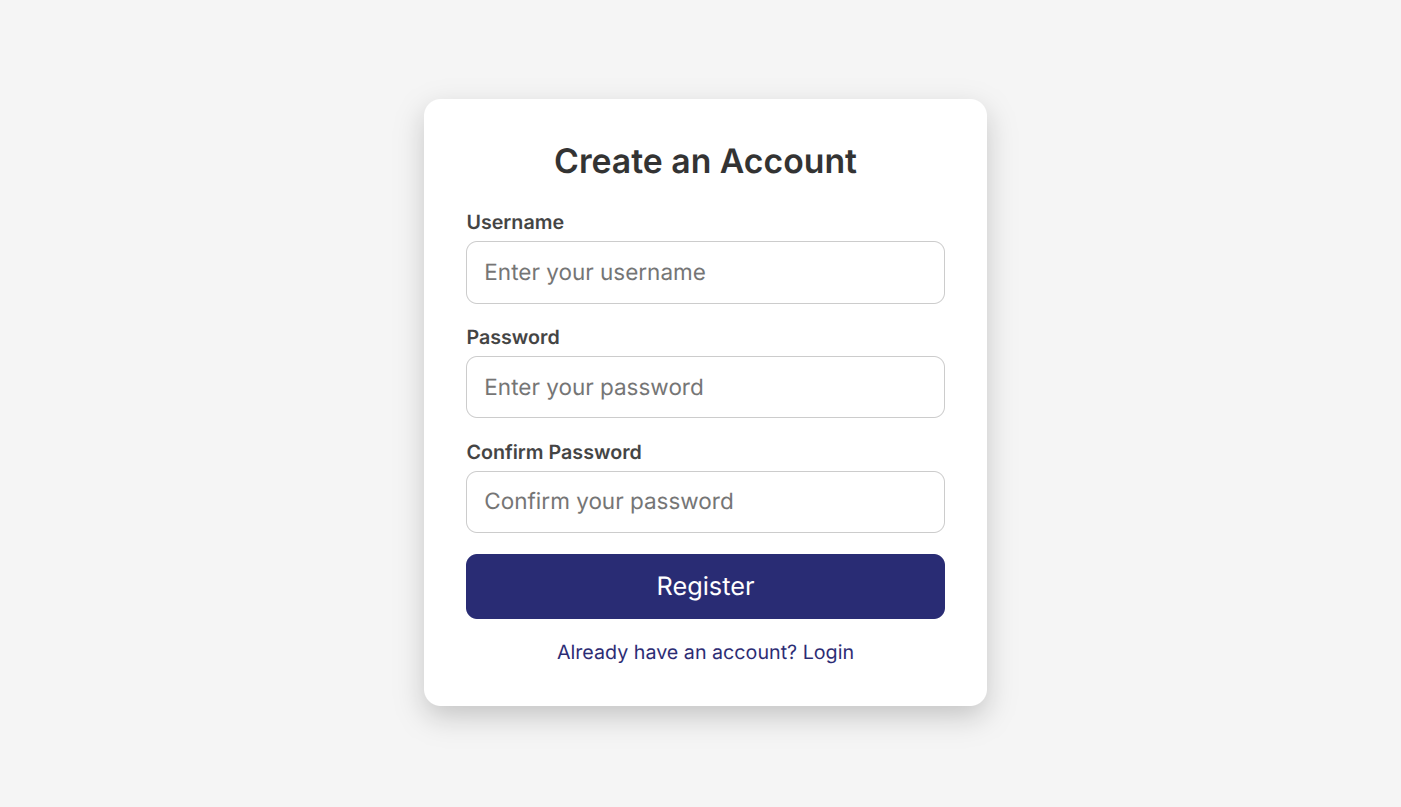
signup page

About the Project
Inspiration
In many parts of the world, especially in rural areas, access to steady electricity is still a big challenge. Power outages, inefficient distribution, and a lack of real-time monitoring often leads to wasted energy and unpredictable shortages. We came up with ElectroMap as a smart, AI-powered way to visualize electricity consumption, balance loads better, and make energy distribution more efficient.
What it does
ElectroMap is a software platform that helps with:
- Keeping track of real-time power usage from different substations
- Showing insights into overall power consumption and average usage
- Using AI to balance electricity loads intelligently
- Logging power transfers so we can analyze and optimize distribution
How we built it
Our development process went through several steps:
- Frontend – Designed using Bootstrap, Javascript, HTML, and CSS to make the dashboard easy to use and responsive
- Backend – Built with Django and Flask to handle data processing, user authentication, and AI model integration
- Database – SQLite for keeping power consumption data, logs, and user information
- AI Model – Used Scikit-learn’s Random Forest Regression to predict and balance power loads
- Map Visualization – Implemented with Leaflet.js to show substations, load levels, and power flow in real-time
Challenges we ran into
- Handling real-time data efficiently so that visualizations don’t lag
- Fine-tuning the AI model to make power distribution predictions more accurate
- Managing data pipelines and making sure authentication is secure
- Getting different technologies to work together—AI, backend, frontend, and maps
Accomplishments that we're proud of
- Being able to show real-time power usage from multiple substations
- Successfully building an AI-powered system that balances power loads
- Creating a user-friendly dashboard for easy monitoring
- Setting up a strong foundation for future IoT integration and automation
What we learned
- How AI can play a huge role in energy management and efficiency
- Ways to integrate real-time data visualization with Leaflet.js
- Improved our skills in backend development, AI model training, and UI/UX design
- Learned the importance of teamwork and good project planning
What's next for ElectroMap
- Integrating IoT devices like smart meters and sensors to make power adjustments automatic
- Improving AI models so they can predict power demands more accurately
- Moving to a cloud-based system to make it more scalable and accessible
- Expanding ElectroMap to mobile apps so users can monitor power usage on the go


Log in or sign up for Devpost to join the conversation.