-
-
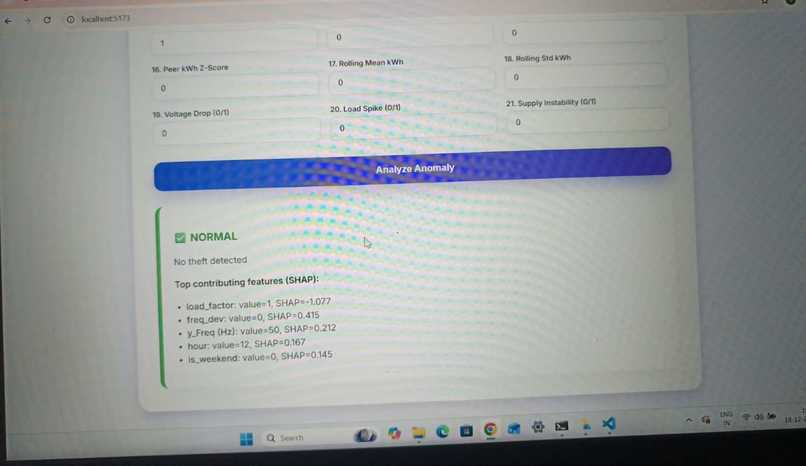
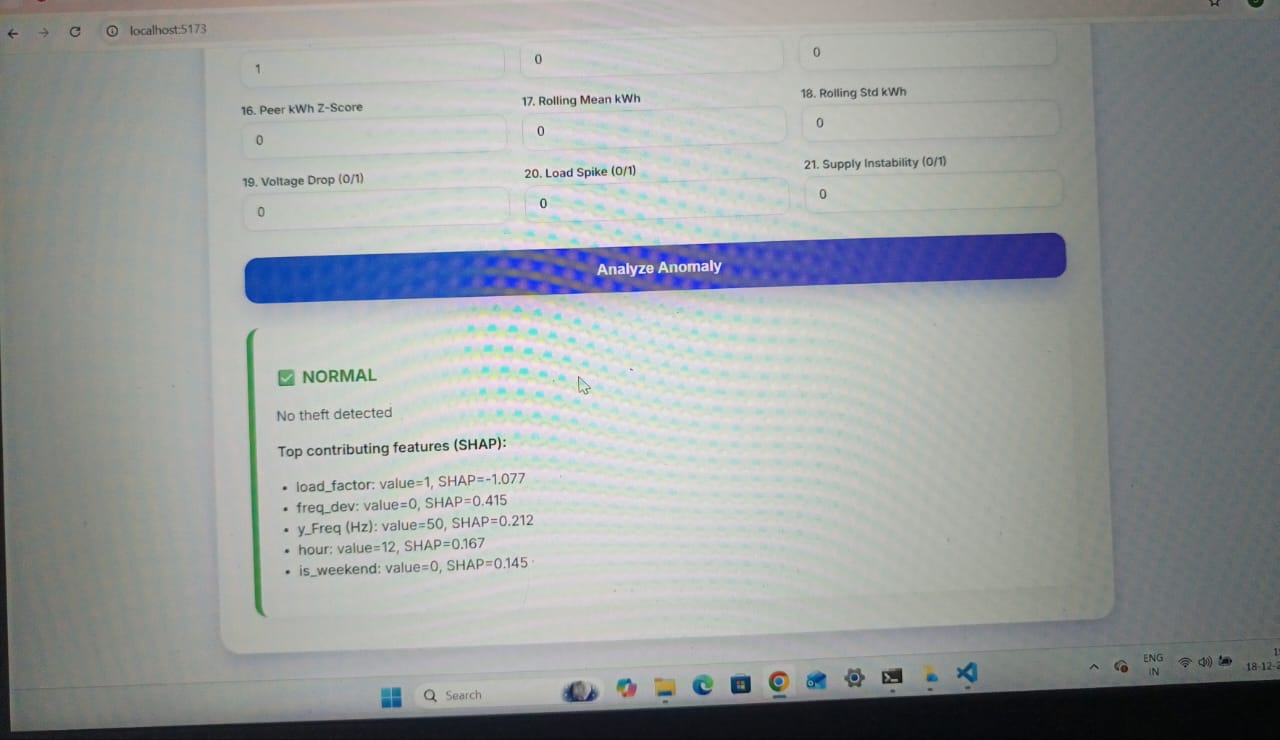
The image shows the SHAP explanation under normal electricity usage
-
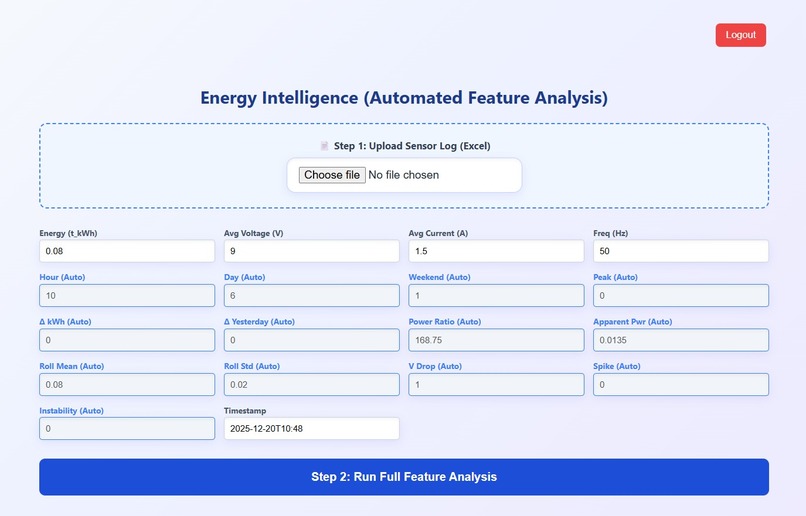
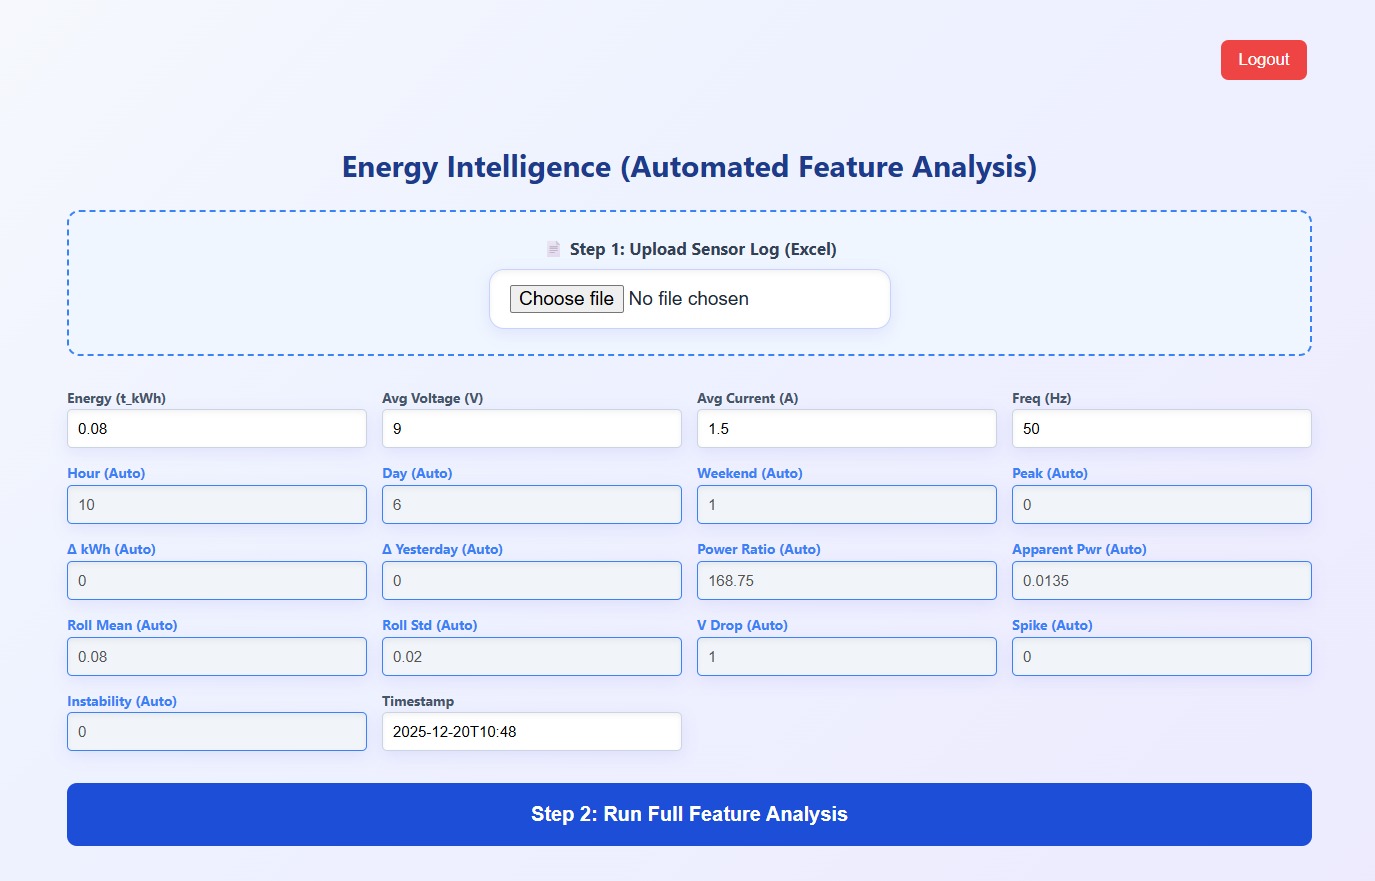
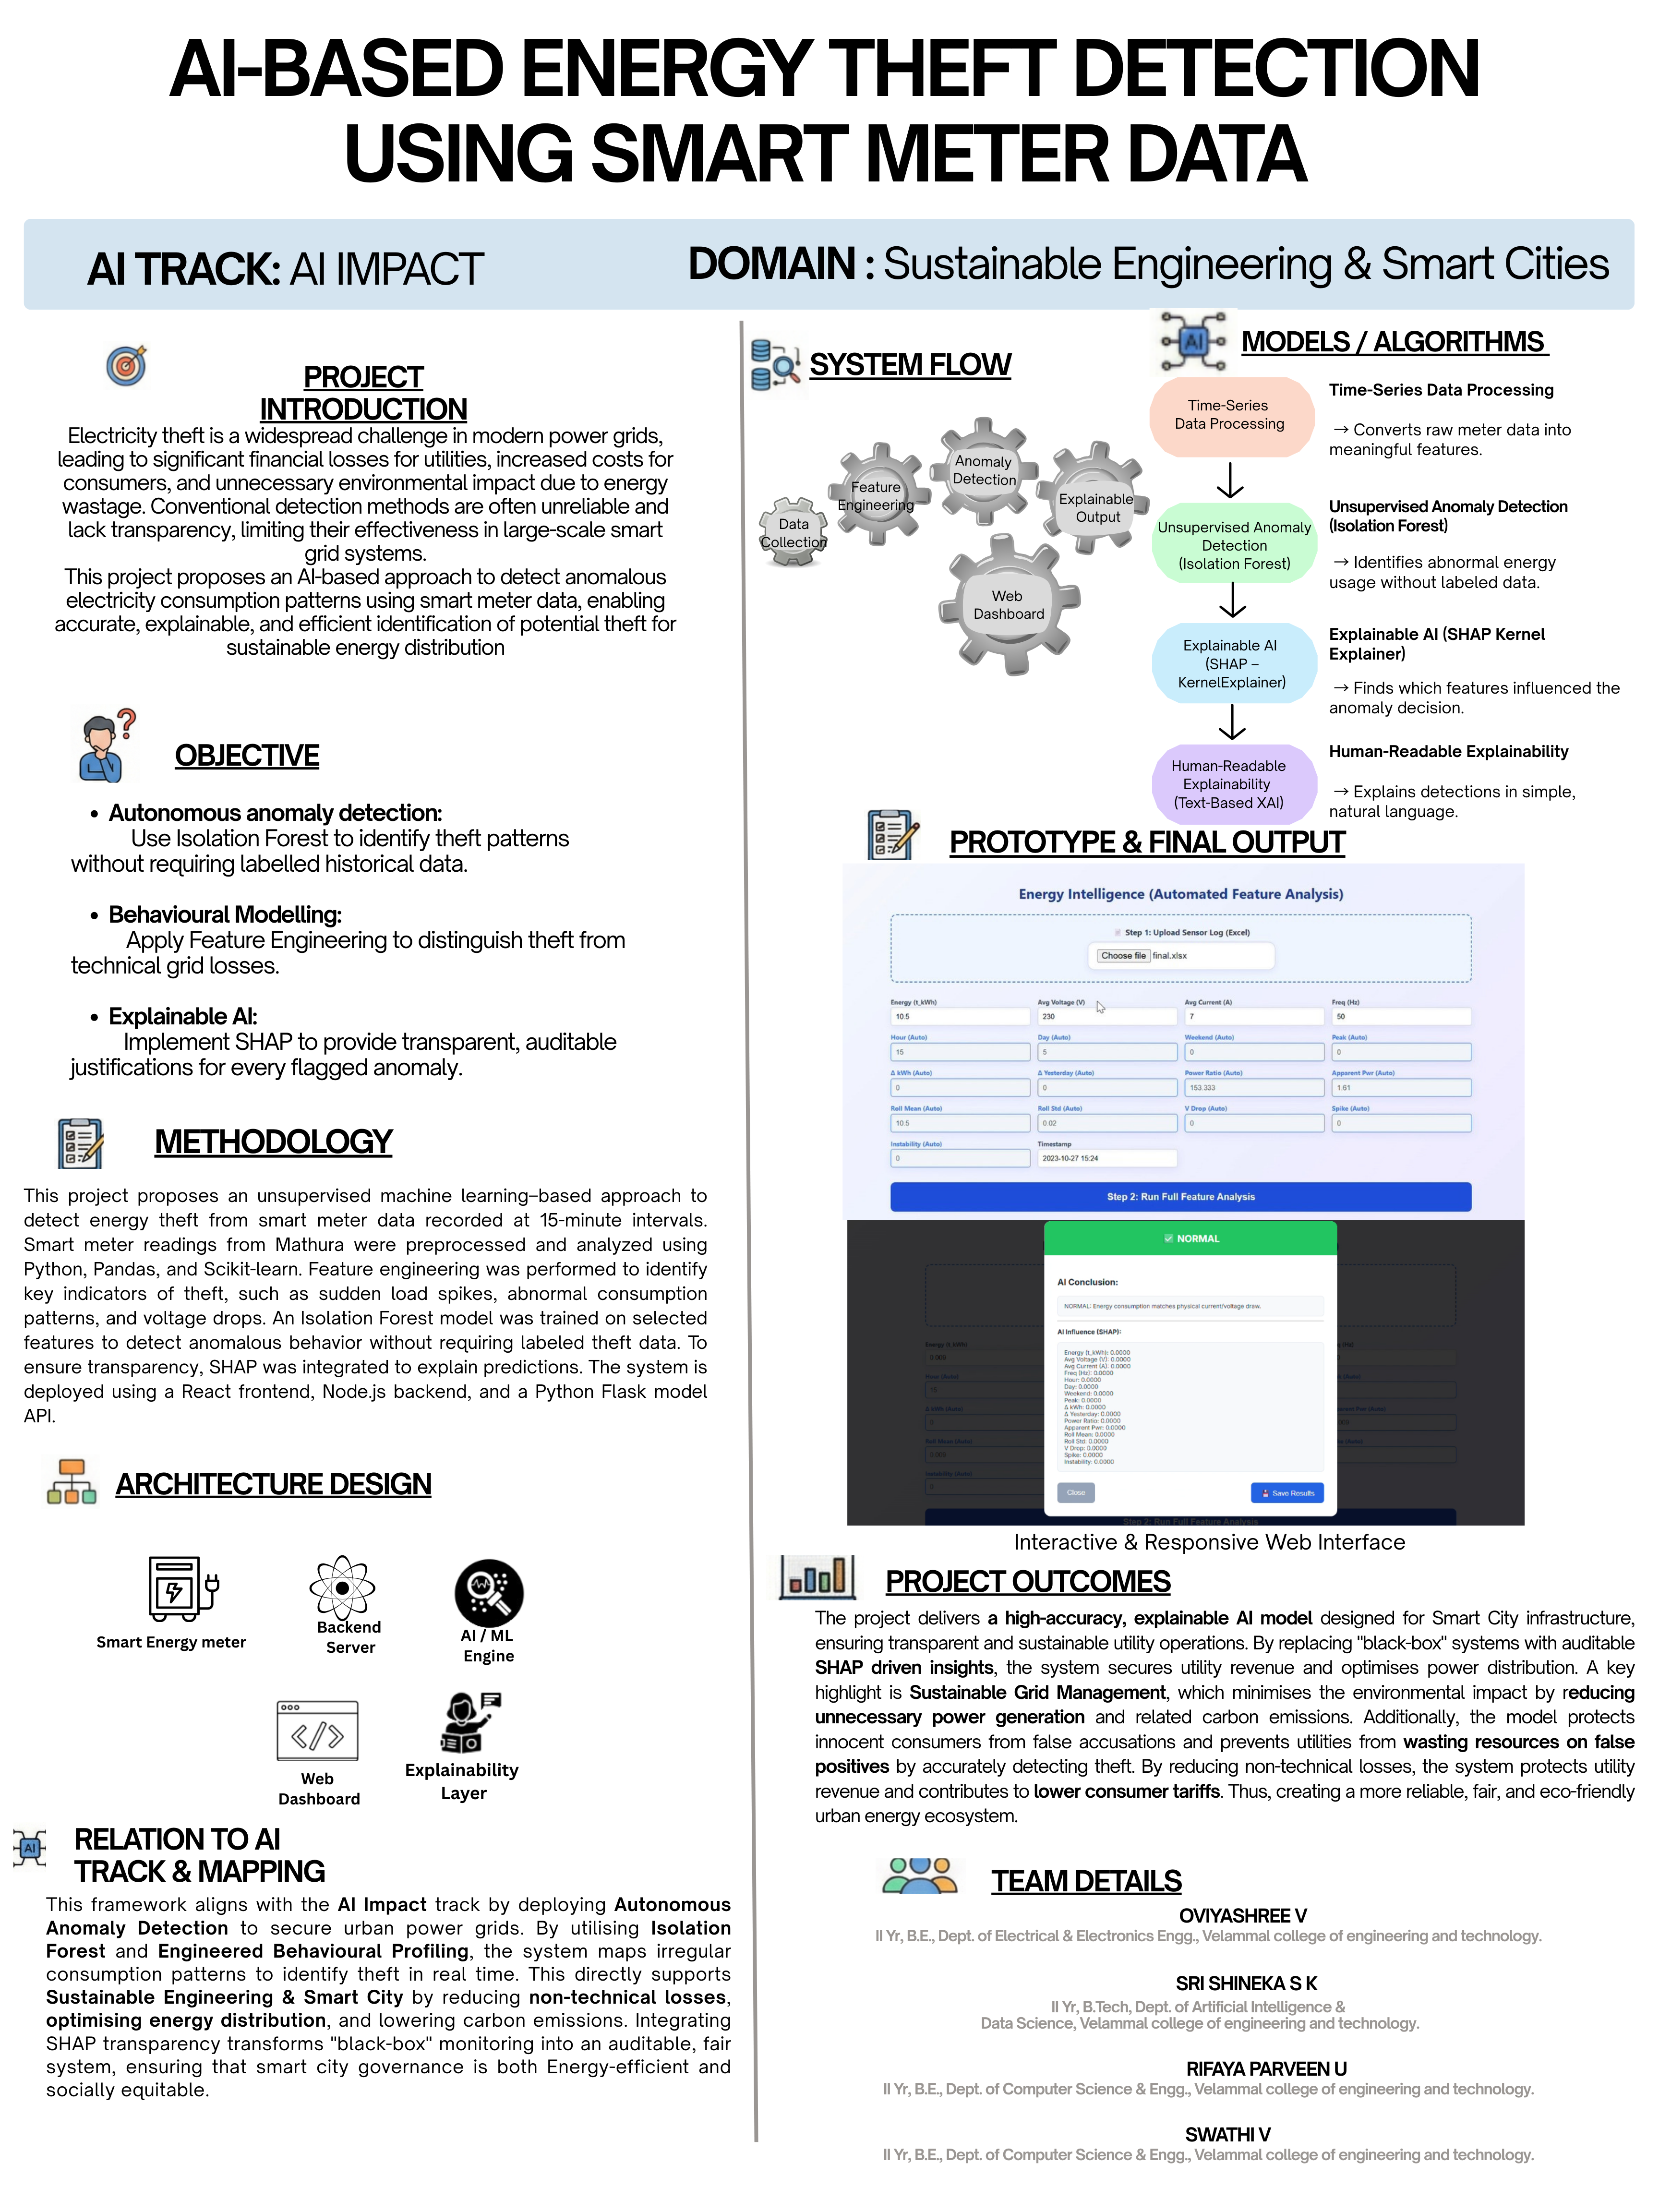
The frontend of the project
-

The poster shows the project overview
-

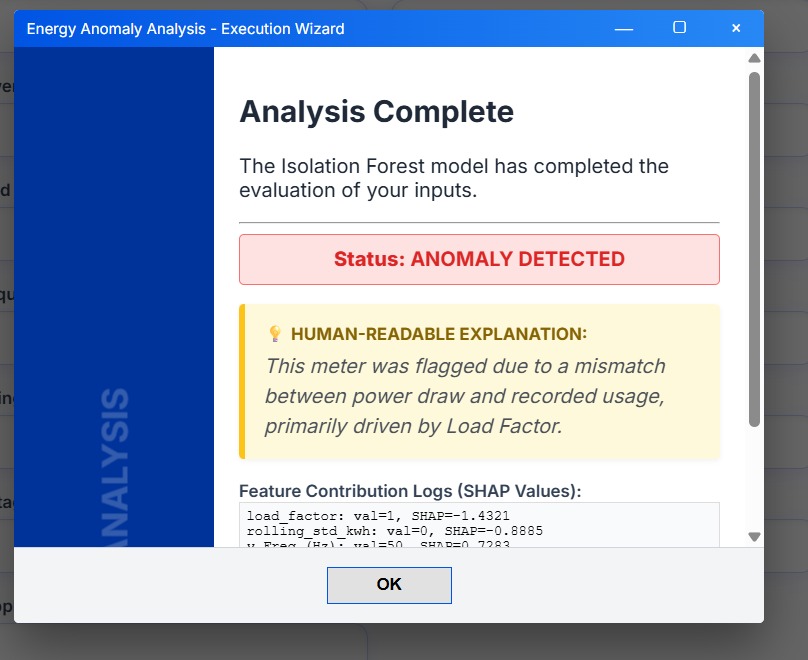
The image shows the SHAP explanation under abnormal electricity usage
TRACK 1: SOCIAL GOOD
Project Description
AI-Based Reliable and Explainable Energy Theft Detection
Electricity theft is a major challenge worldwide, leading to billions in losses, grid instability, unfair billing, and operational inefficiencies for utilities. Traditional theft detection relies on manual audits or supervised AI models that require labeled theft data which is rarely available.
Our project uses unsupervised anomaly detection on smart meter data to automatically flag unusual consumption behavior that may indicate energy theft, while also explaining why a pattern looks suspicious. This balances detection accuracy with transparency so operators can review findings rather than trusting a black-box model.
We built the solution using:
Python for data processing & modeling
Pandas / NumPy for feature engineering
scikit-learn (Isolation Forest) for anomaly detection
SHAP for explainable AI
Flask API + Node.js backend for integration
React for the dashboard frontend
The pipeline ingests smart meter readings, engineers behavioral and power-quality features, detects anomalies, and presents interpretable results to utility operators.
Purpose
Electricity theft affects millions of people. Losses are often passed onto honest consumers through higher tariffs, and unstable load conditions can damage infrastructure and appliances. At the same time, falsely accusing users is unacceptable and creates distrust.
The problem statement was choosen for the following reasons:
It has a real-world social and economic impact
Smart meters are becoming widespread
Our key motivation was to create a system that is: data-driven explainable practical for field use
Instead of claiming perfect theft detection, the system aims to assist analysts by highlighting suspicious usage patterns and showing the reasoning behind each flag.
If developed further, utilities could:
prioritize field inspections more efficiently
reduce non-technical losses
minimize billing discrepancies
improve grid reliability
All while maintaining fairness and transparency.
How it Works
Users (such as utility analysts) can upload or connect smart-meter data to the system. The application then:
Preprocesses & aggregates meter readings
Smart-meter energy, voltage, current, and frequency readings are resampled into 15-minute intervals and cleaned.
Engineers meaningful behavioral features
Including:
consumption trends and daily patterns
peer-comparison scores
rolling averages and variability
voltage and load stability metrics
peak vs off-peak behavior
Detects anomalies using Isolation Forest
The ML model identifies the ~1% most unusual readings across all meters — these become investigation candidates.
Explains each anomaly using SHAP
So operators can see:
which variables influenced detection
whether behavior looks abnormal vs peers
whether supply quality influenced readings
Displays results in a web dashboard
Key features include:
list of flagged meters/events
anomaly scores
trend visualization
human-readable explanations
Dataset
We tested using a real-world smart meter dataset from Mathura (India) containing residential & commercial consumption logs. No personally identifiable information is used.
This ensures realistic behavior patterns.
The Demo (2–5 minute walkthrough)
The demo video includes:
00:00 Problem Overview
00:21 Data Processing
00:39 Anomaly Detection (Isolation Forest)
00:46 Explainability (SHAP)
00:58 Deployment & Interface
01:38 System Integration
01:51 Conclusion
Built With
- arduino
- dataset
- flask
- isolation-forest
- javascript
- json
- node.js
- numpy
- pandas
- react
- rest-apis
- scikit-learn
- shap

Log in or sign up for Devpost to join the conversation.