Inspiration
We were inspired by the struggles of our peers to understand and visualize some key concepts relating to electric fields and potential difference. We thought that creating an interactive visual tool would facilitate the learning process as well as provide some data and graphs that aren't available by any online or educational means. In short, if we wanted access to these graphs and tools, we had to make them ourselves.
What it does
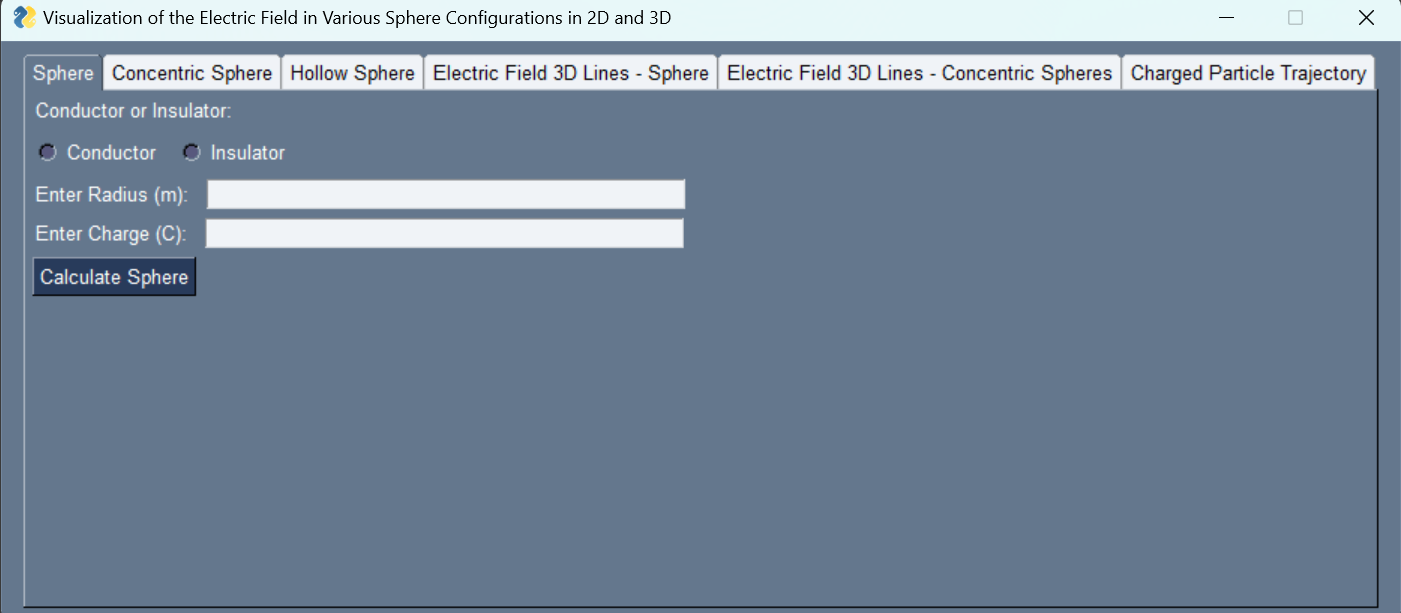
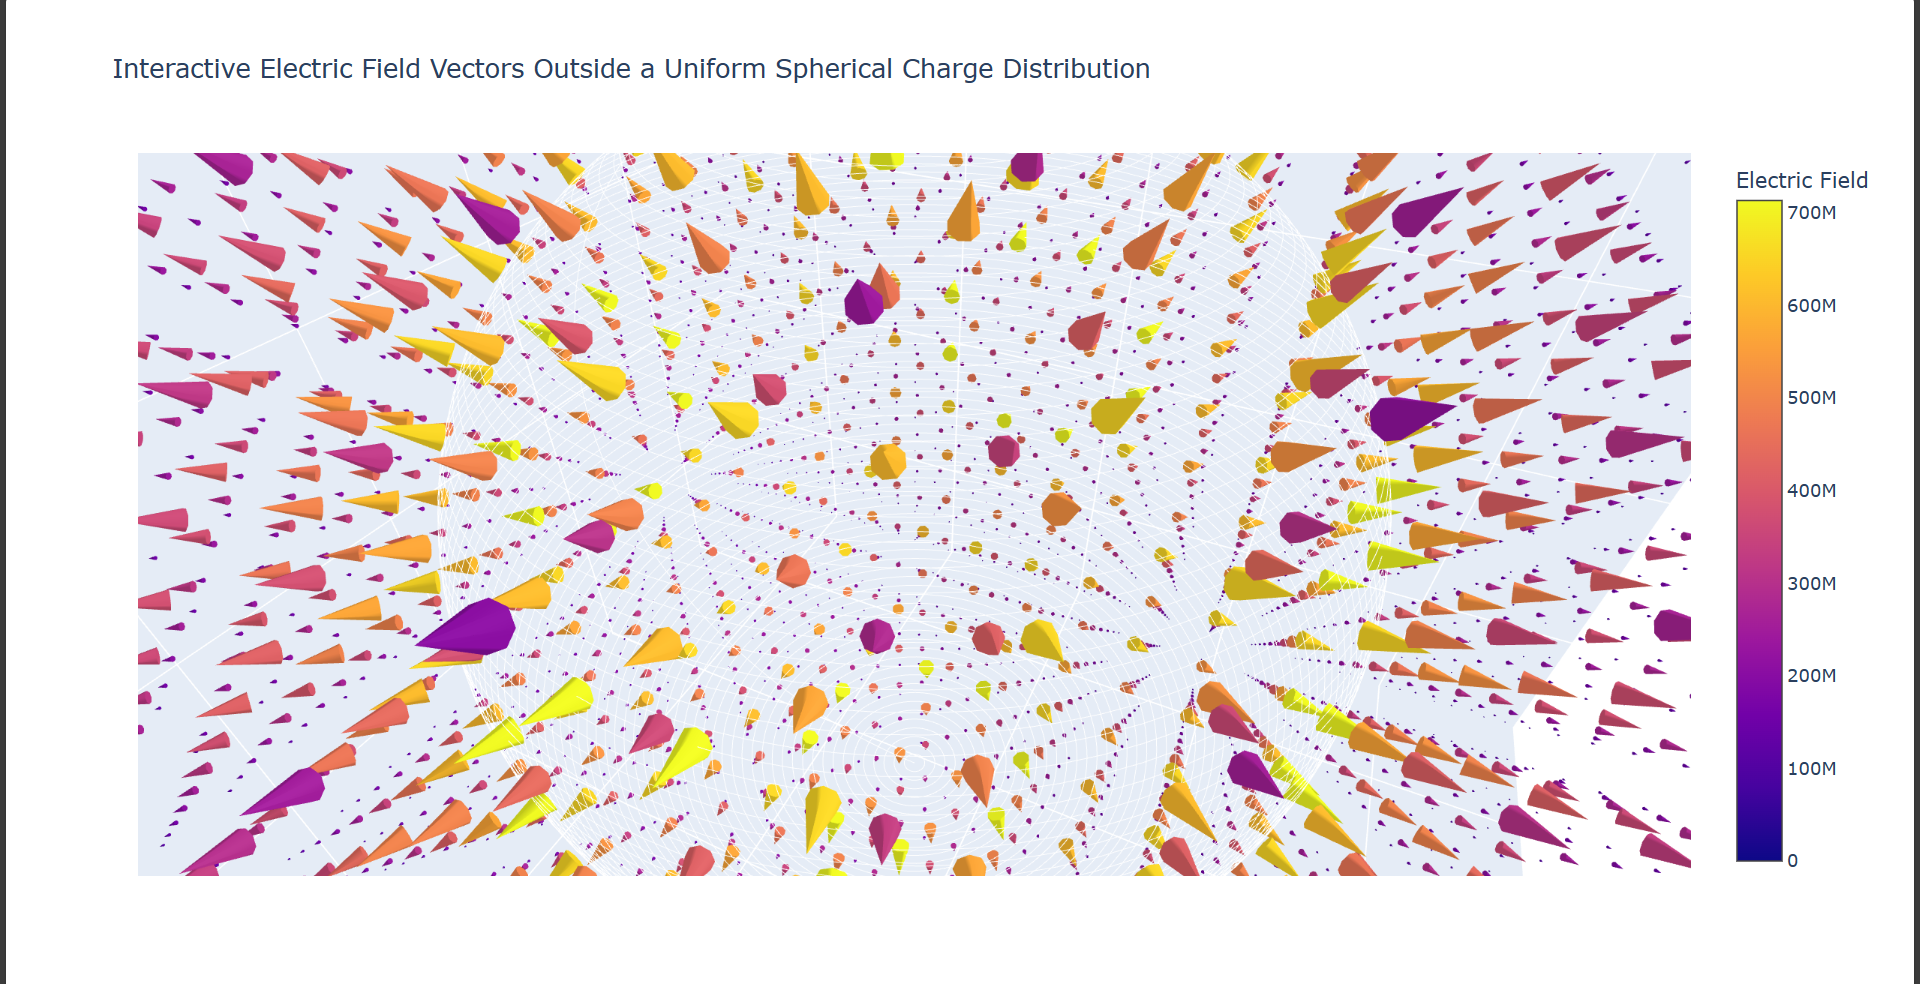
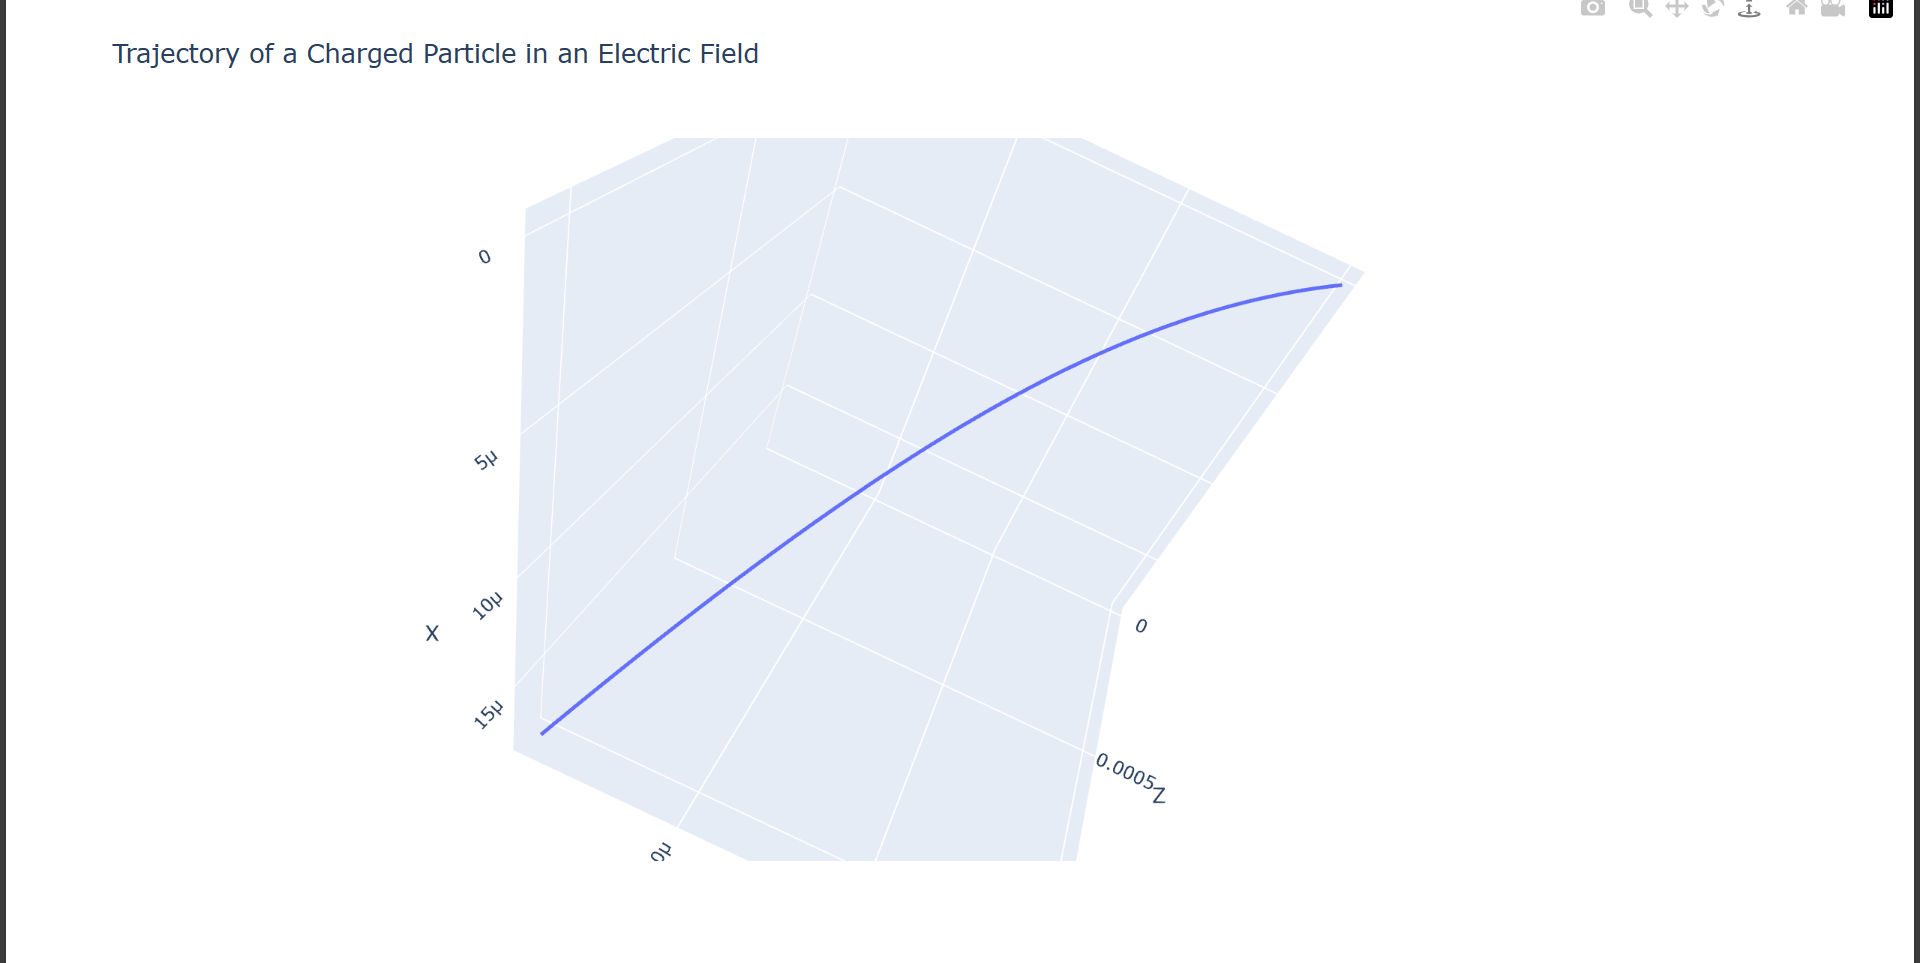
Aimed as an educational tool for the cegep NYB physics course, this project maps and presents the electric field of various charge distributions both vectorially and by magnitude. 2 and 3-dimensional graphs of the electric field and the potential difference were produced to quantitatively demonstrate the interactions between charges in conductors and insulators respectively. Vector fields were subsequently produced as a visual demonstration of the electric field’s direction and changing magnitude at various points in 3-dimensional space. Cases presented all observed symmetrical properties as covered in the Electricity & Magnetism cegep level course. This includes but is not limited to spheres, hollow spheres, shells with or without thickness, and cases including both conductors and insulators. Finally, the 3-dimensional trajectory of a single charged particle interacting with the electric field of a spherical charge distribution was mapped.
How we built it
We used python to build the project. Thus we divided the tasks into three. Alhasan and Lina built the GUI, Lina produced the 2-dimensional electric field and potential difference graphs, and Matt produced the 3-dimensional graphs as well as the graph of electron trajectory.
Challenges we ran into
As most of had little coding experience, we encountered some difficulties with more complex development requirement as well as automation and mathematical modelling.
Accomplishments that we're proud of
We're very proud of the additional knowledge we've gained as relates to physics and of the graphs we've produced. We're especially proud of our user interface.
What we learned
We learned some very useful modelling and coding techniques.
What's next for Electric Field in Various Sphere Configurations in 2D and 3D
We must produce the electric field graphs for different charge distributions. This includes cylinders, planes and multiple charges in a same map.
Built With
- gui
- python


Log in or sign up for Devpost to join the conversation.