Inspiration
We wanted to build a way to visualize data while practicing some of the skills the UMBC fails to teach. This includes web development, API development, and using languages that is not in UMBC's general curriculum.
What it does
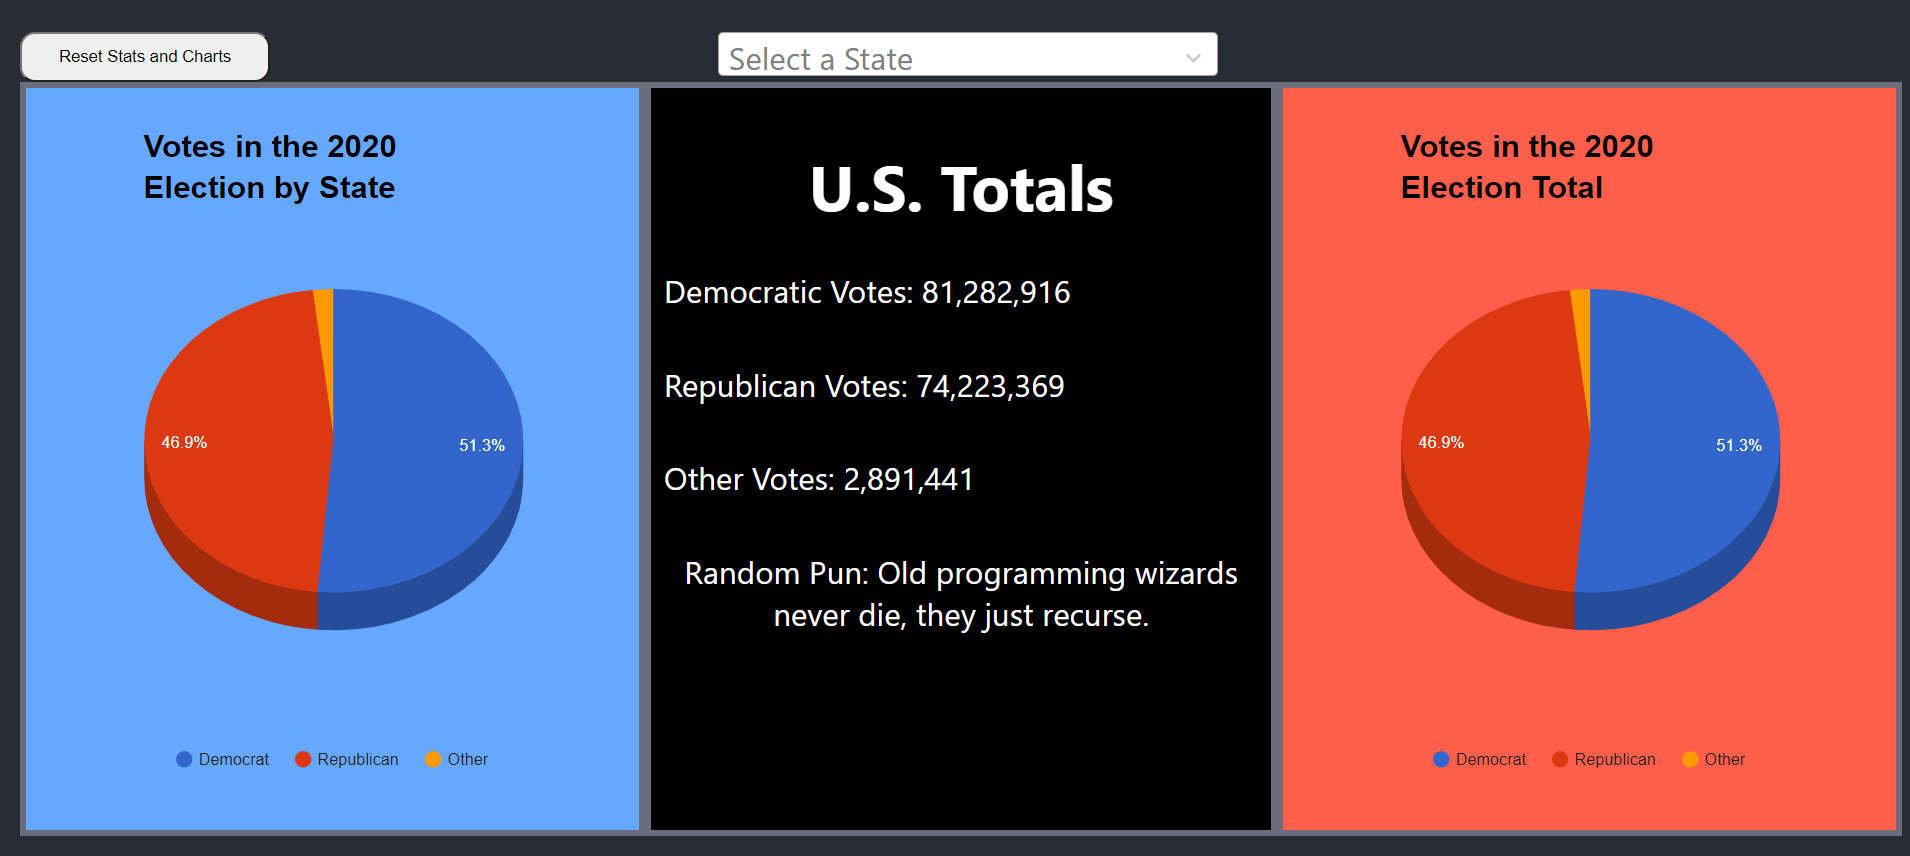
Our application stores the data from the 2020 election, and displays it in the form of pie charts and a statistics column.
How we built it
We used React.js for the front end. Python Django for the backend, and MariaDB for the database.
Challenges we ran into
Trying to get everyone working on this project was difficult. Some members have not made it too far into their CMSC track and had no experience building hardly any of the stack. Some did not have IDEs or even Git setup.
Accomplishments that we're proud of
We were able to get the application fully done and deployed by the deadline. It works and has a little joke generator inside to lighten the mood.
What we learned
We learned that cloud computing can be difficult. Google/AWS can be hard to work with. We also learned that no matter how concise you think you made your requirements, they always need to be improved.
What's next for ElectionHack2021
We would hope to be able to make this query new election results when the next election comes around. The only issue with that is waiting for testing. 3 years to go!


Log in or sign up for Devpost to join the conversation.