Inspiration
As young new voters in this upcoming election cycle, we found it difficult to find non-biased information surrounding the current election candidates as well their stances on social and political issues.
What it does
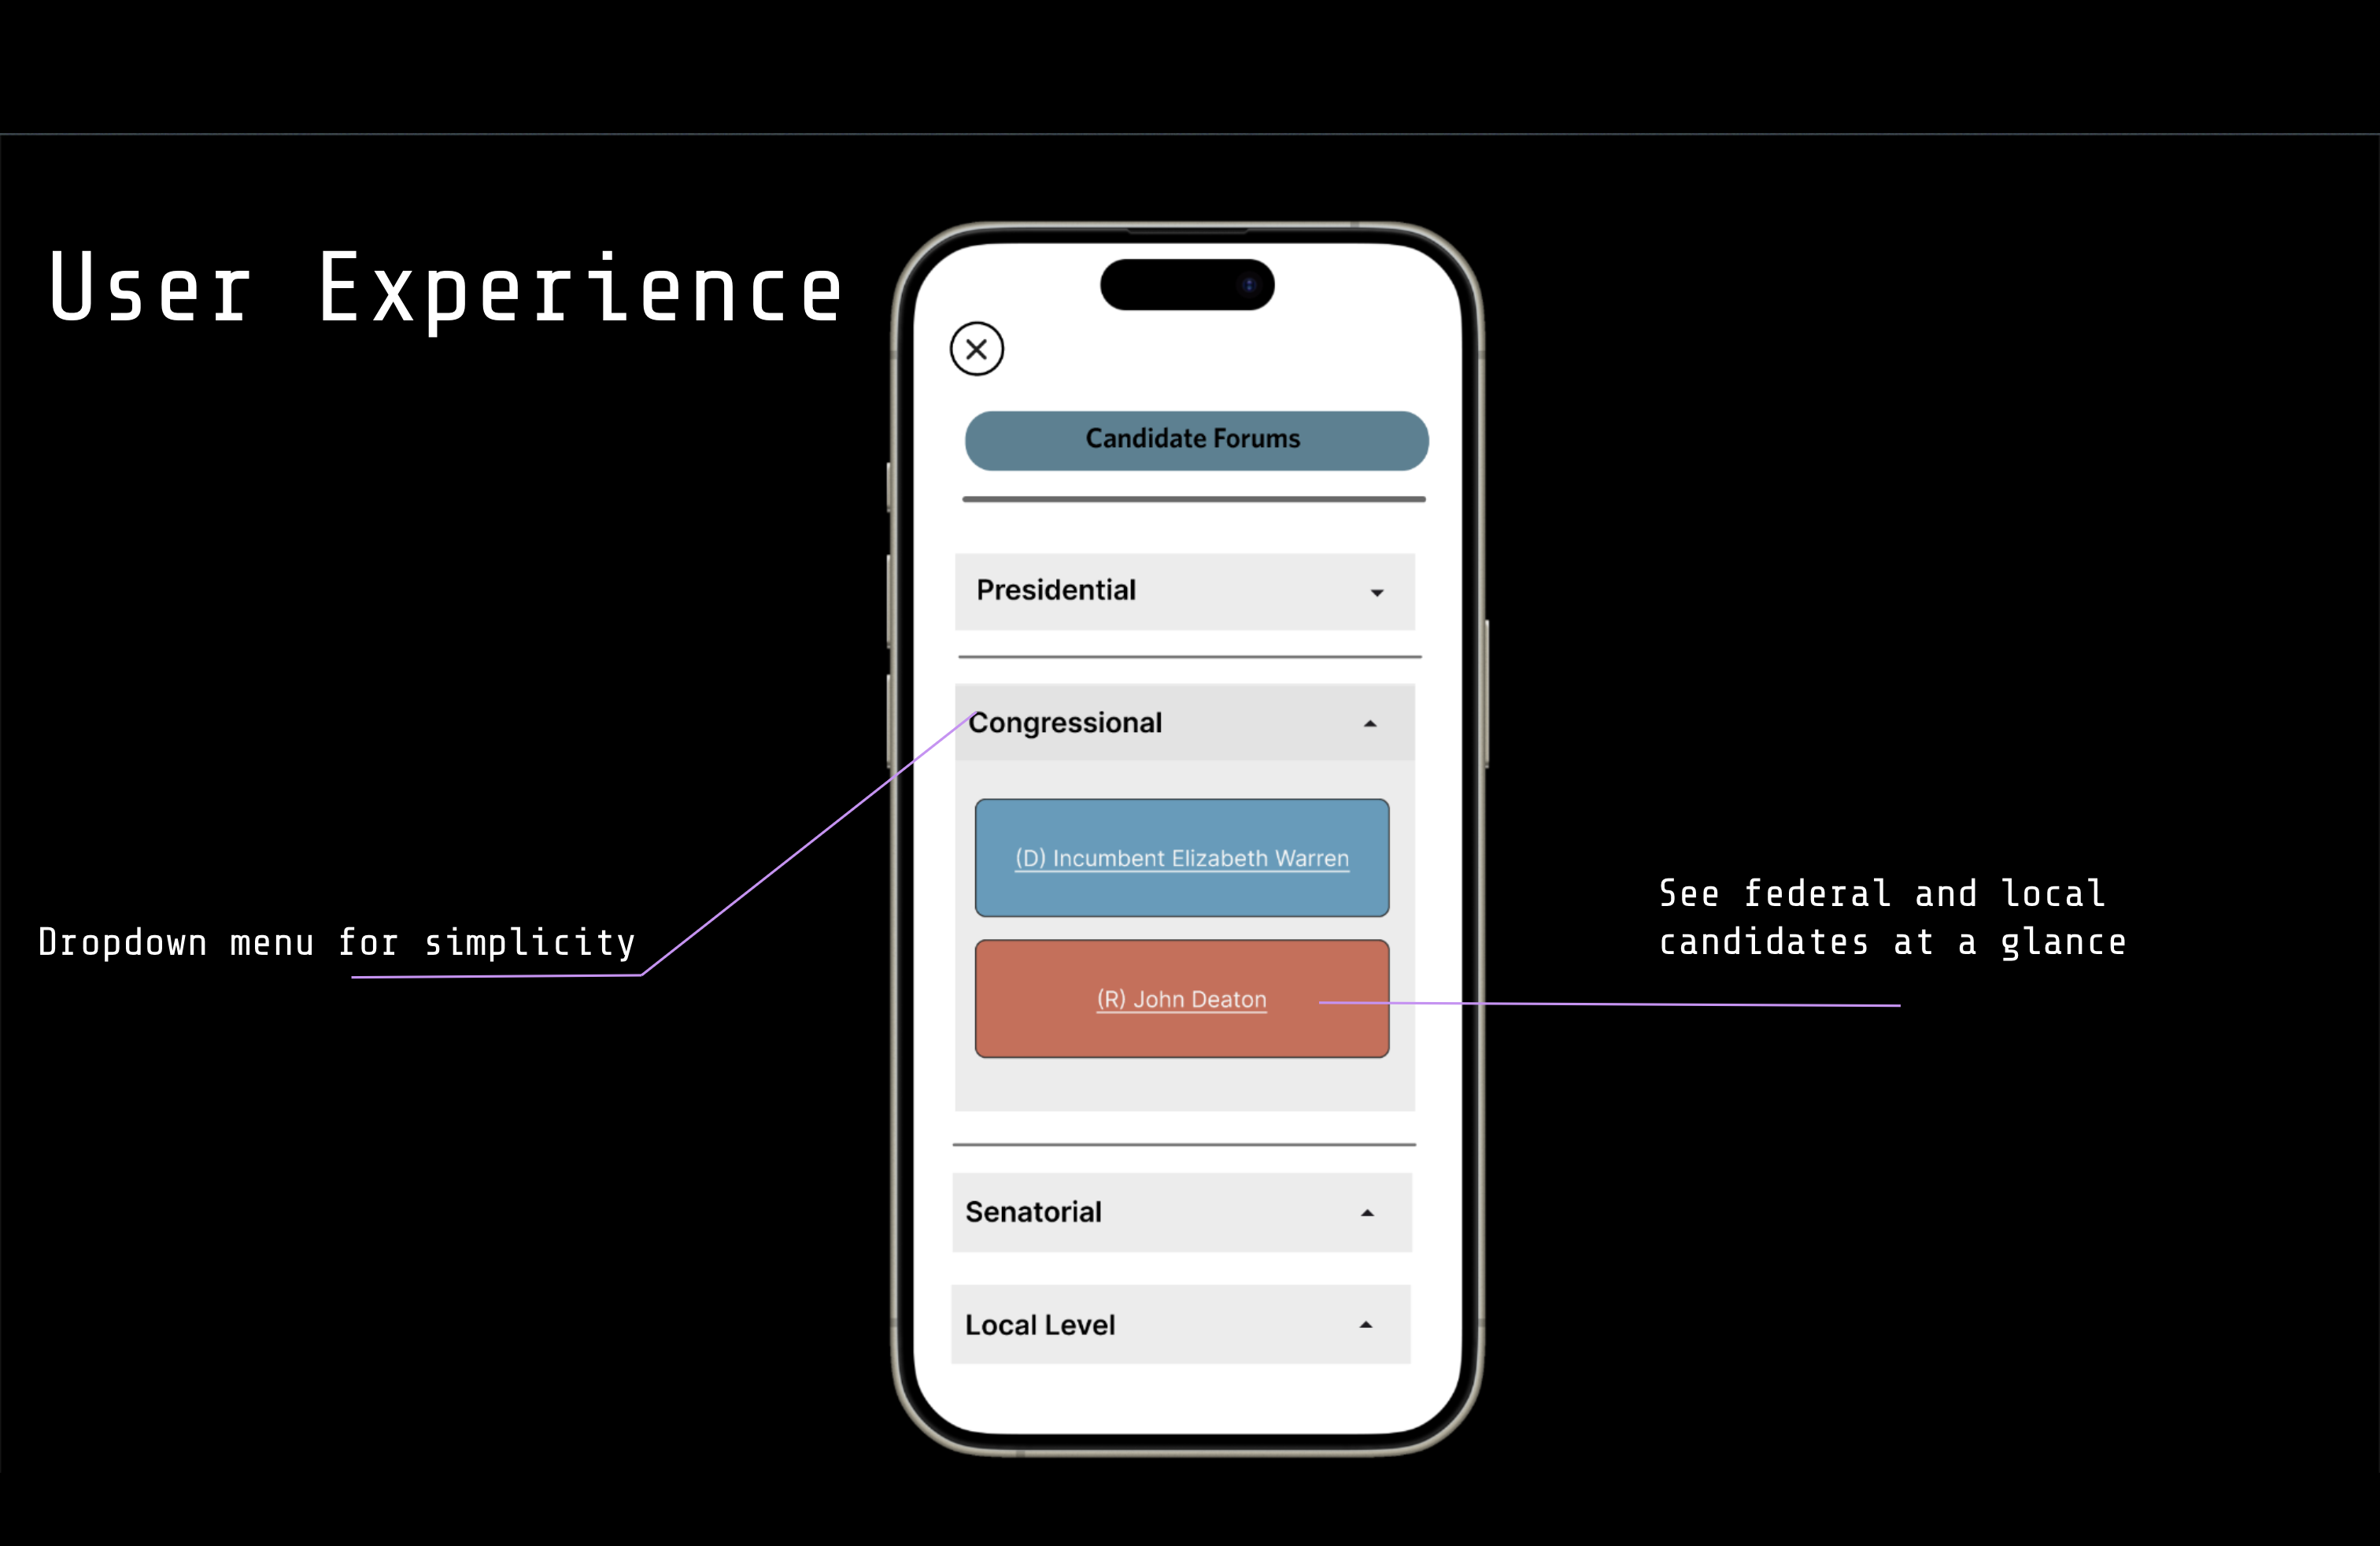
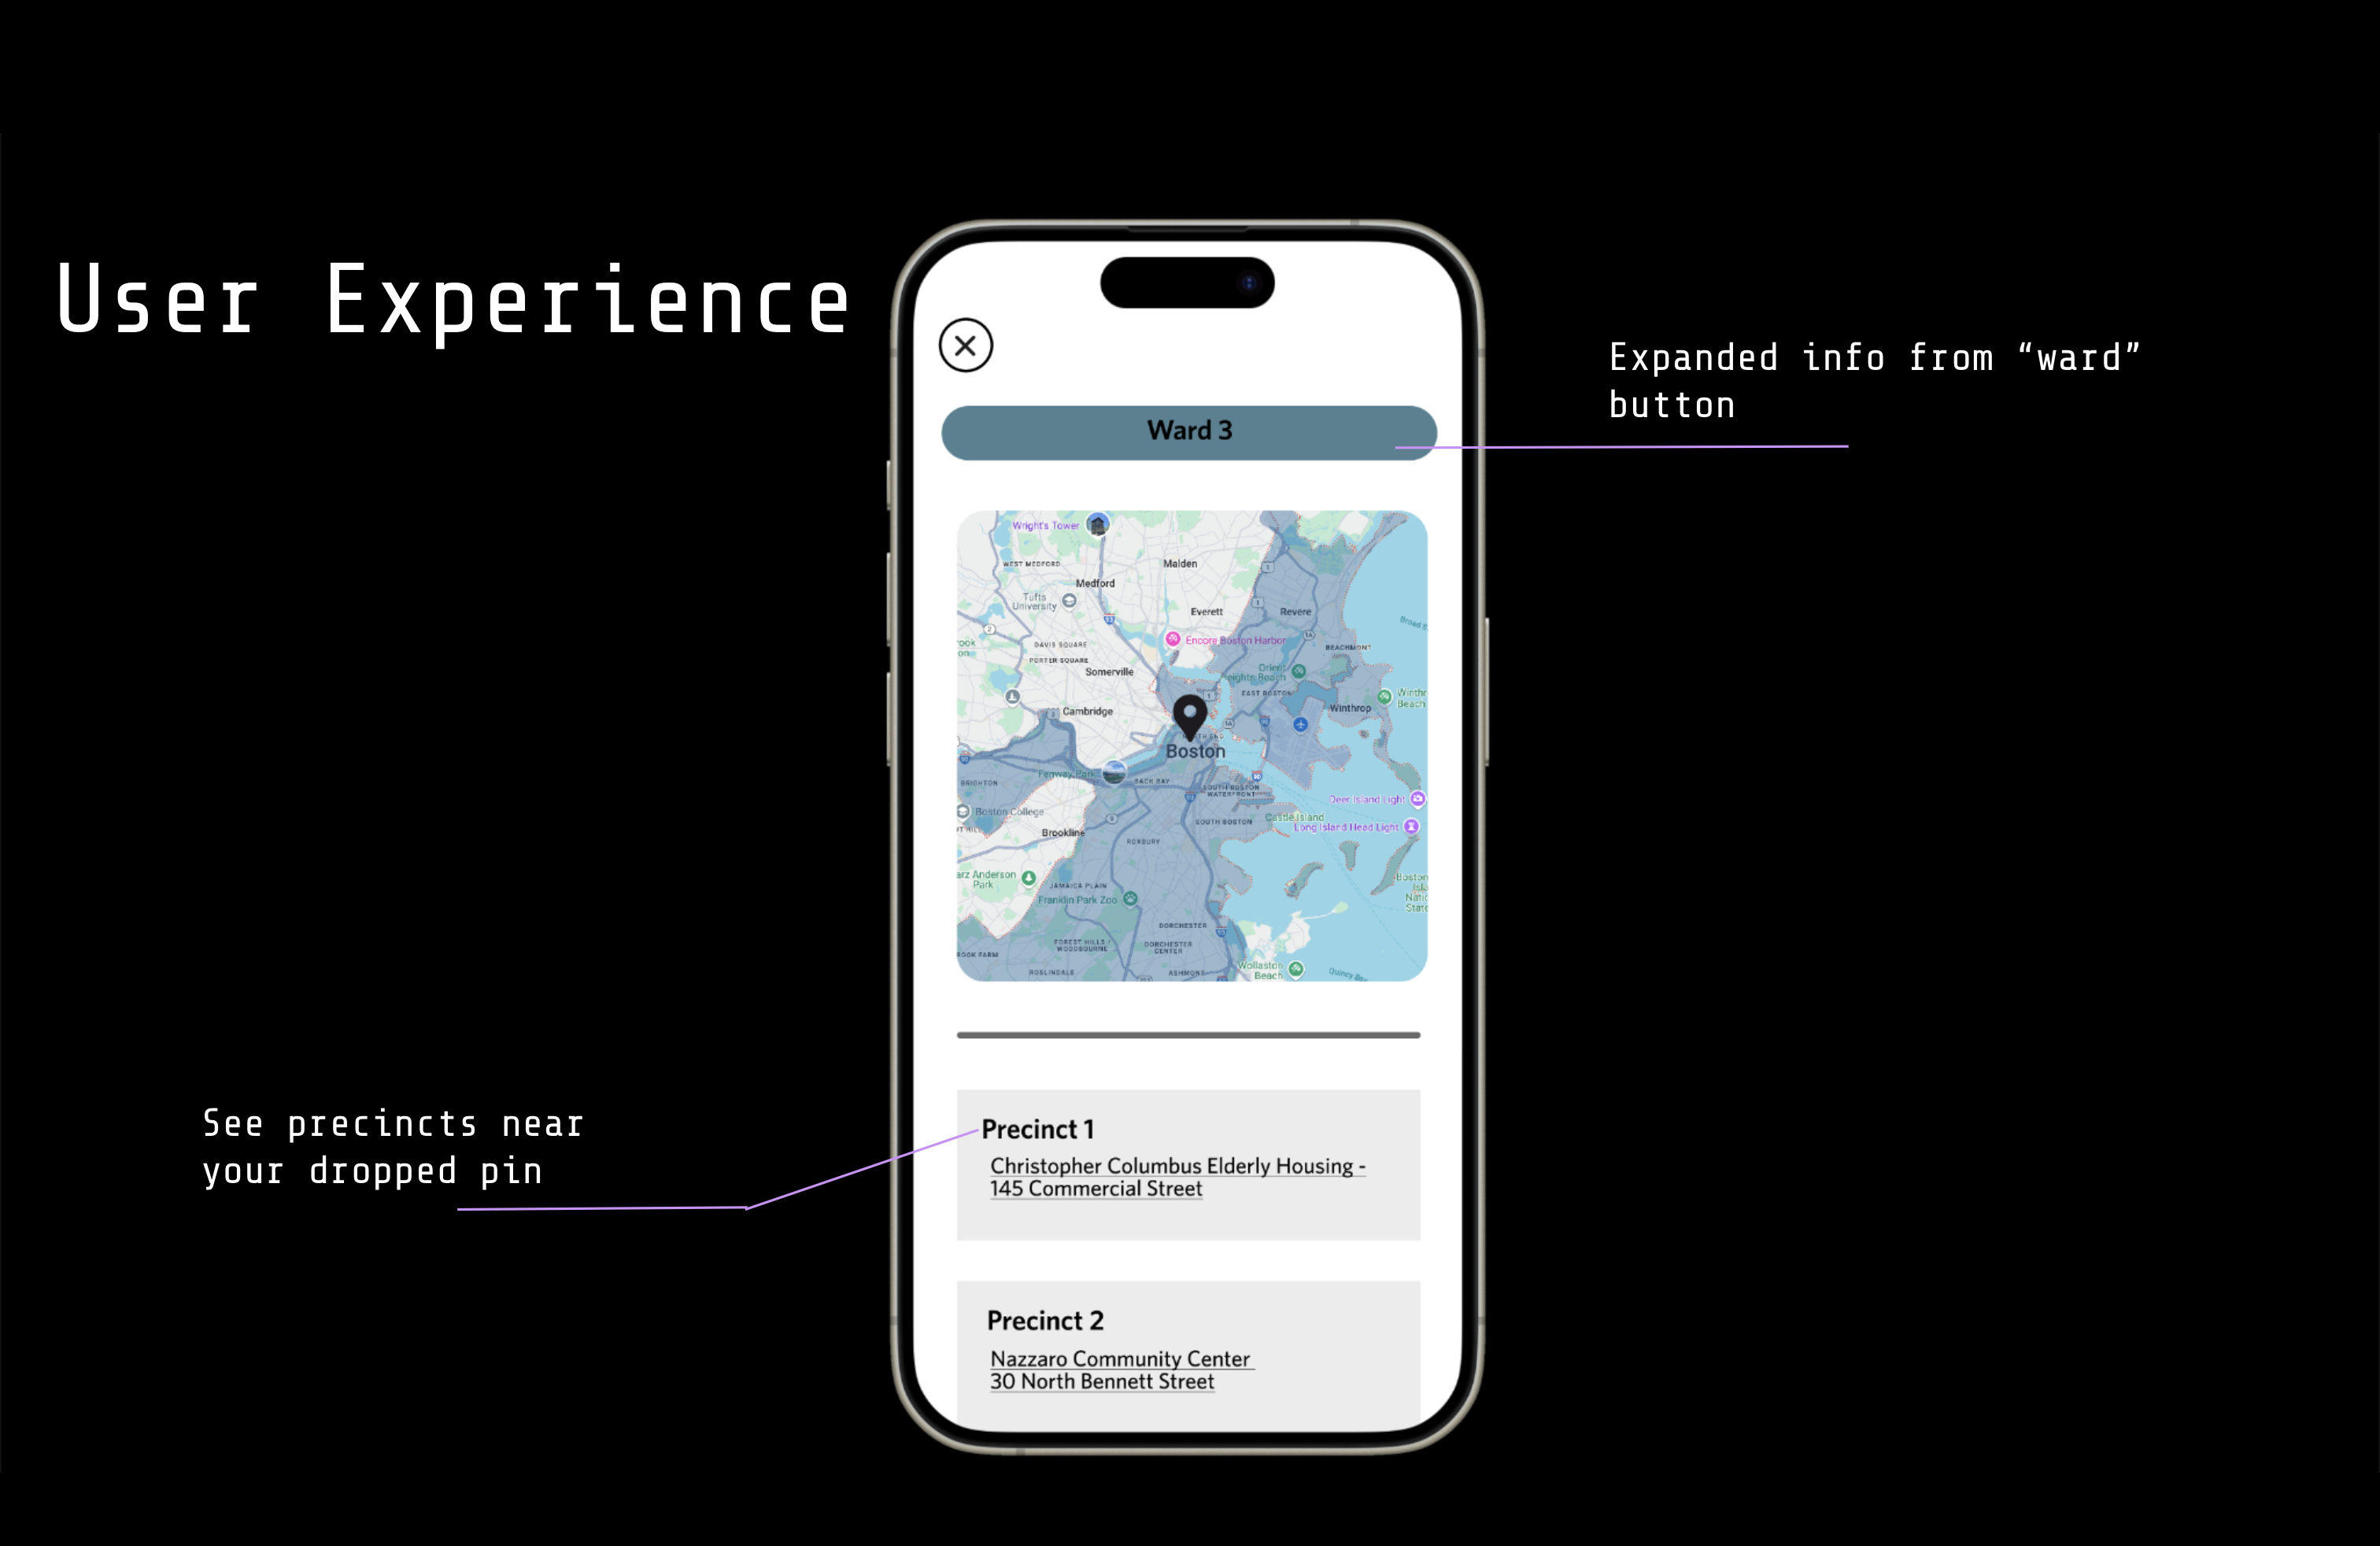
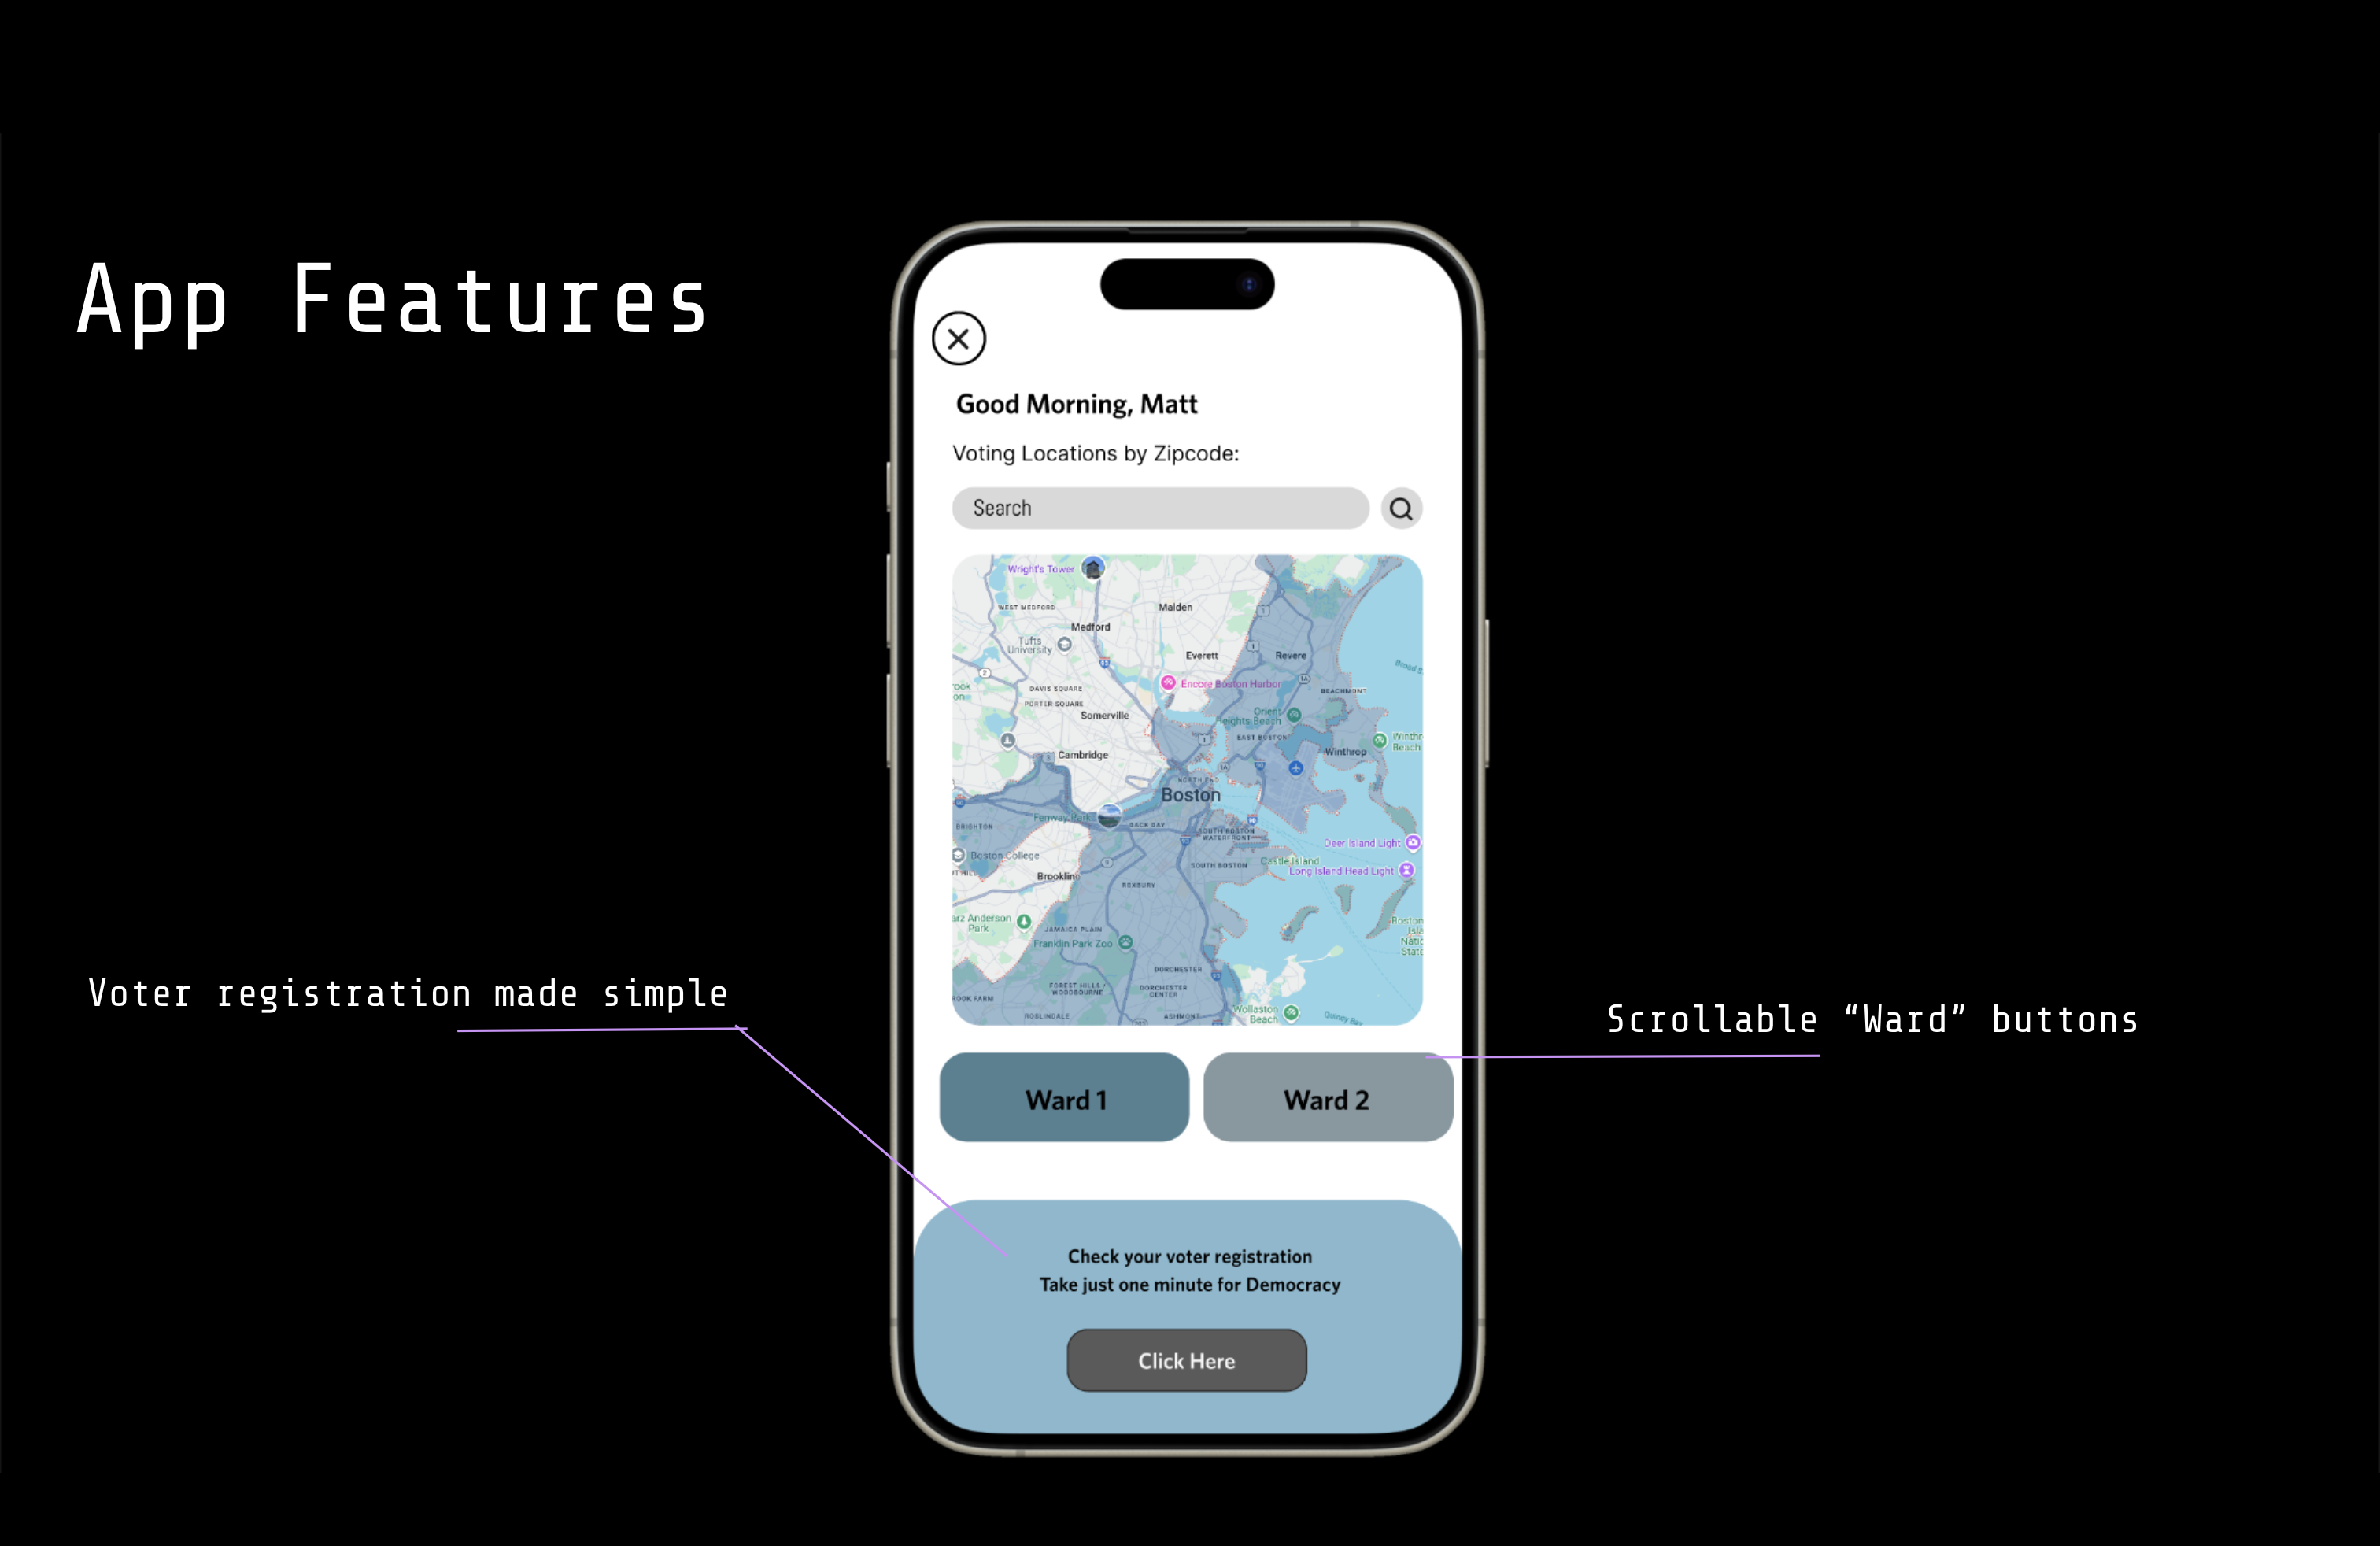
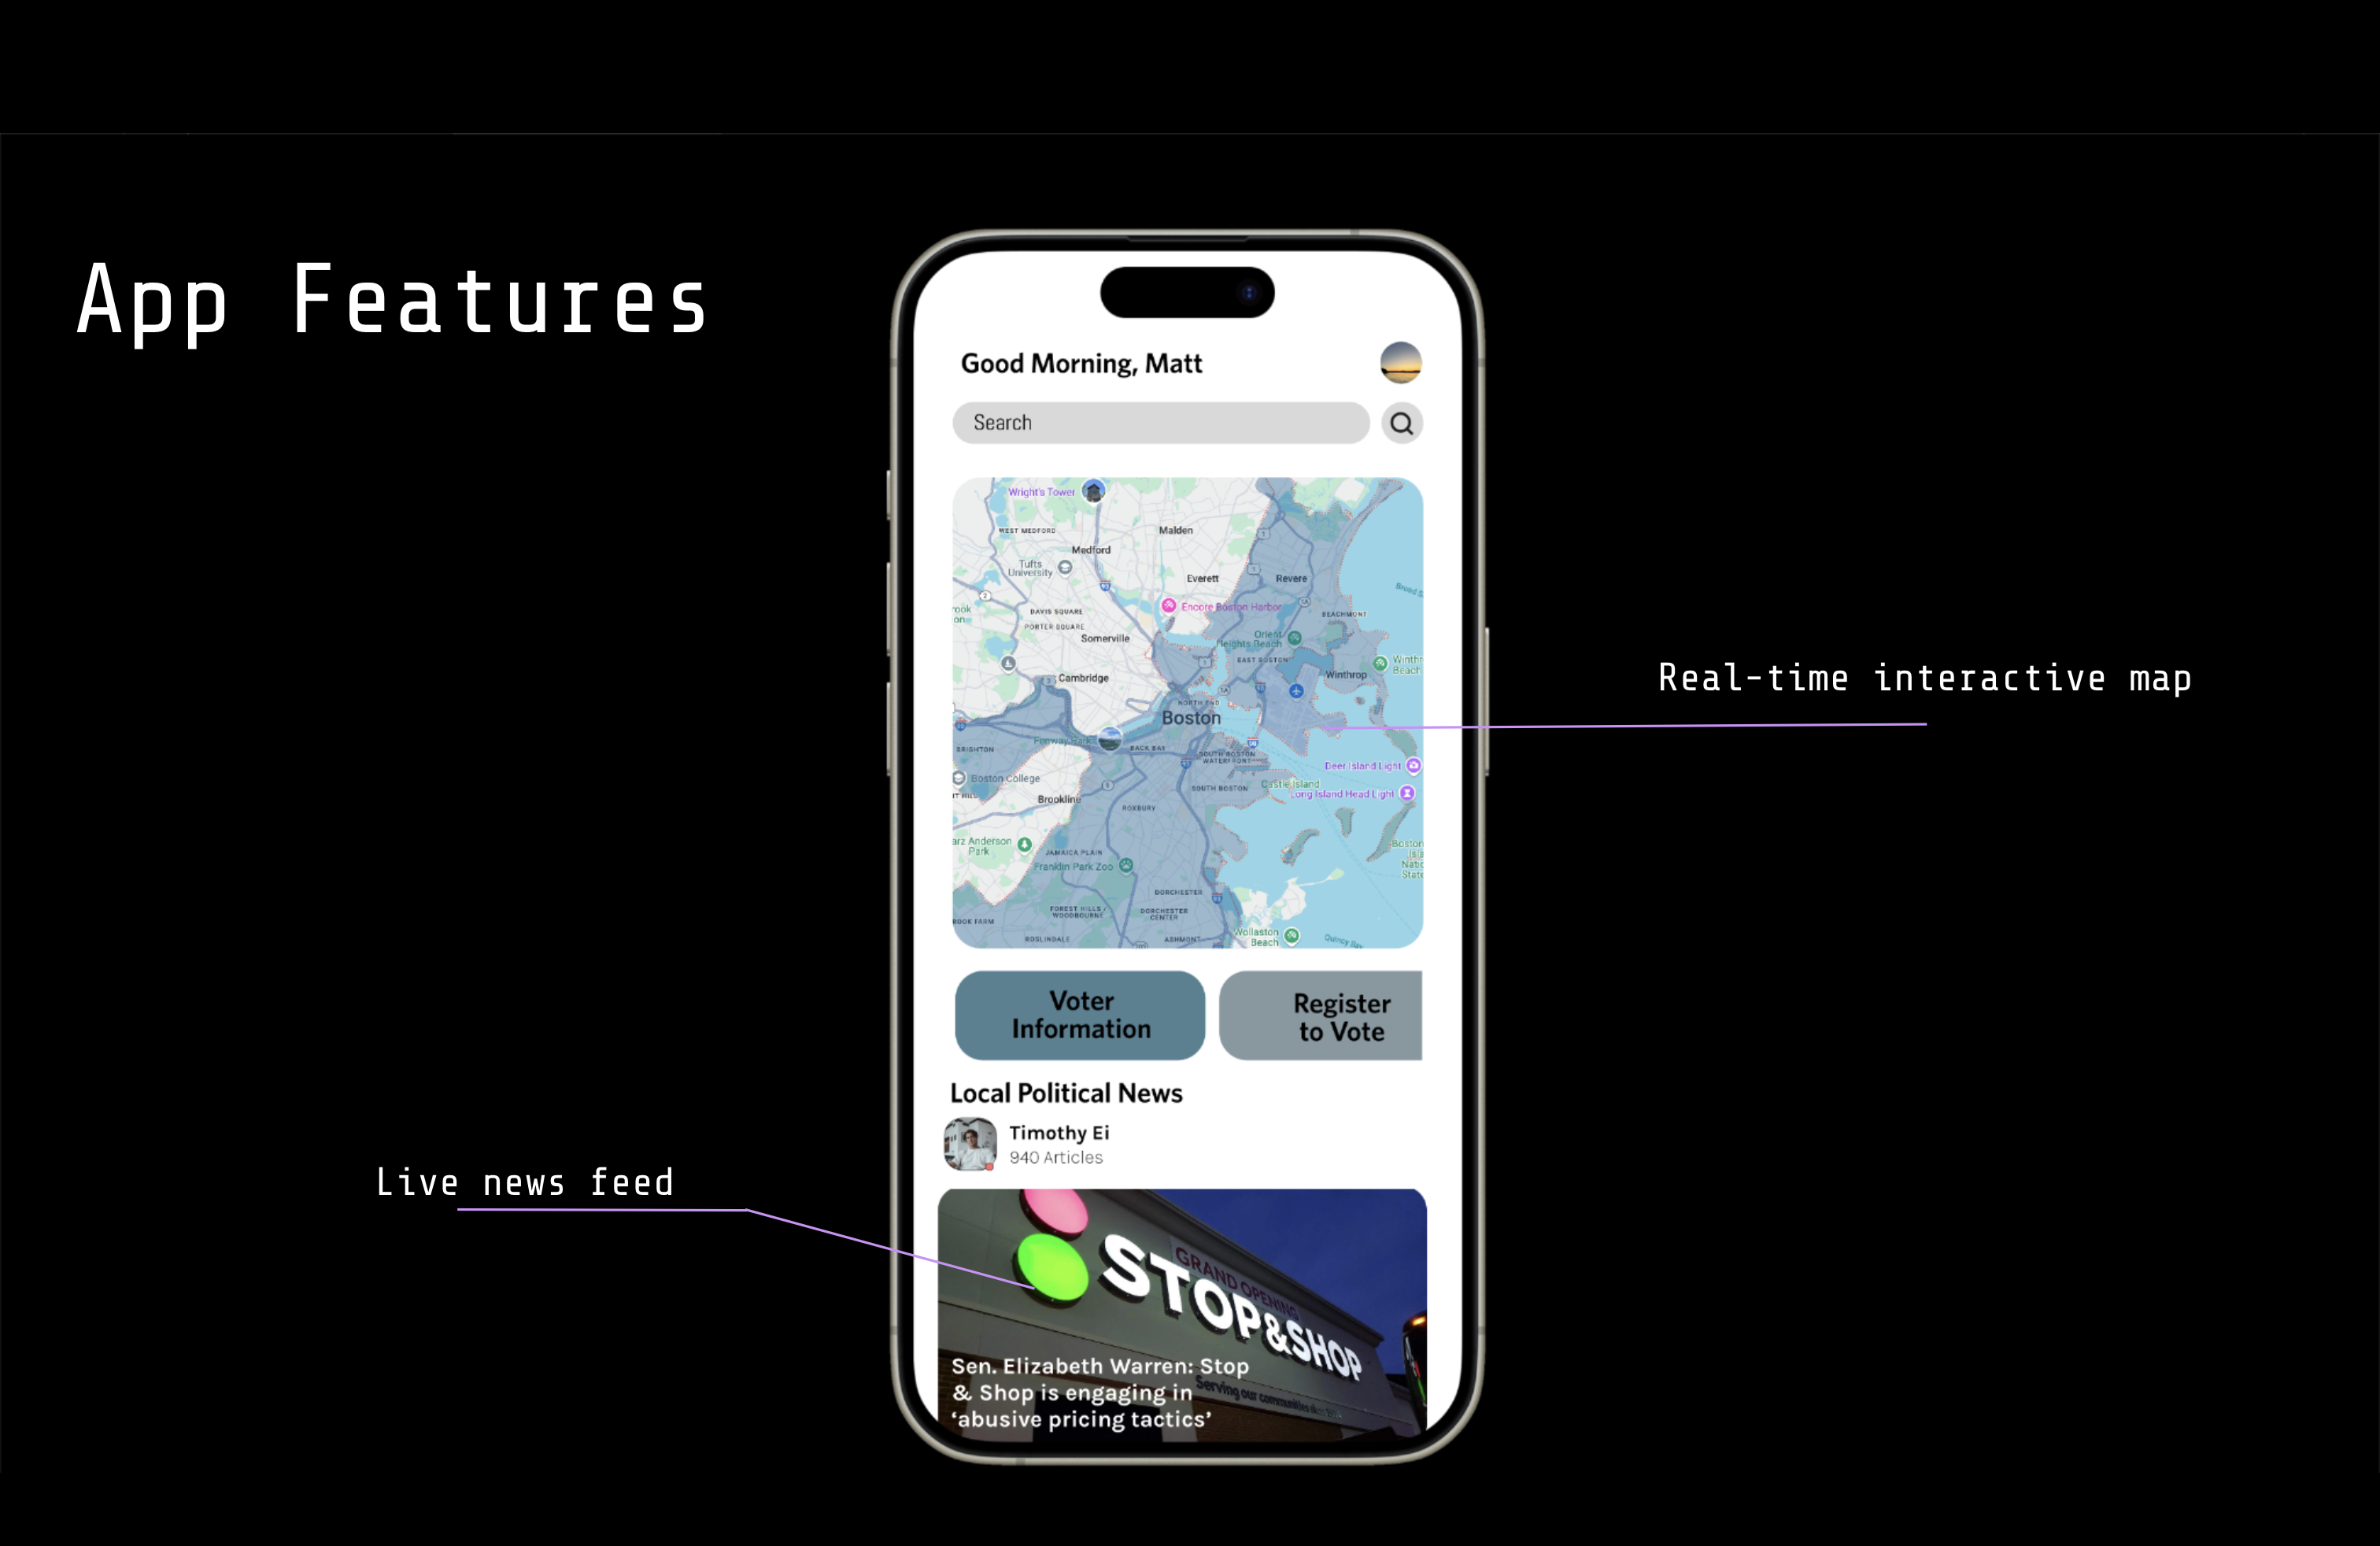
Our app uses a real-time interactive map to help users understand their voting precincts and locate nearby polls. Users can drop a pin or search their zip code, which will return information about their voting precinct, including federal and state-level elections, wards, political party leanings, and state officials and their stances on certain issues.
How we built it
We used Figma, Google Maps API, Adobe Creative Suite, AI, and VS Code. Some steps in our process included using VS code and Google Maps API to create an overlay.
Challenges we ran into
Some challenges our team faced included dealing with the sheer scale of data for mass GIS and formatting within the technical limitations of Figma. Additionally, we found logistical issues in finding data and information outside of popular presidential elections.
Accomplishments that we're proud of
We are very proud of our app and its UI/UX design. Additionally, we appreciated learning how to work with different data types, aesthetic front-end design, and movable webpage-esque aesthetics.
What we learned
We learned development techniques and bringing a product from start to finish in a limited time. We prototyped effectively with Figma and used it to introduce the population to our product without overwhelming developmental resources.
What's next for ElectAid
Currently, the scope is very local; however, with proper resources and time allocation, it may be possible to scale it into a genuine full-stack web application with a running mobile app. Furthermore, we can introduce this app to a widespread population outside of just the greater Boston area.
Built With
- adobe-creative-sdk
- figma
- github
- google-maps
- photoshop
- vscode

Log in or sign up for Devpost to join the conversation.