-
-
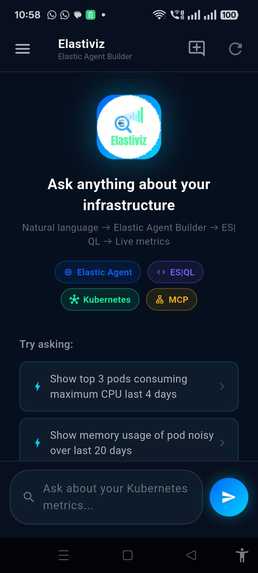
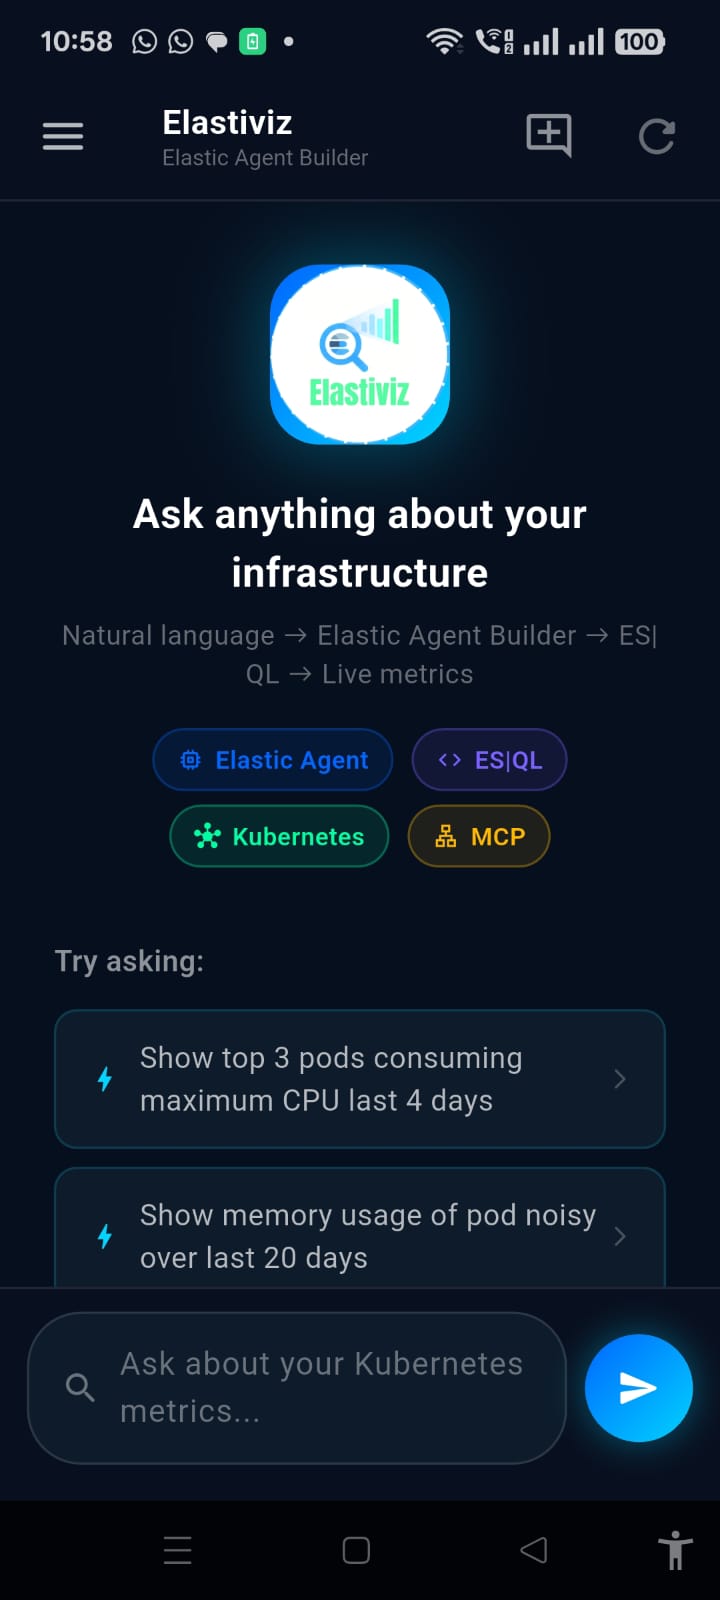
Home screen
-
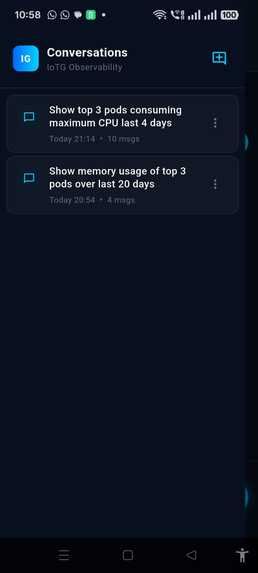
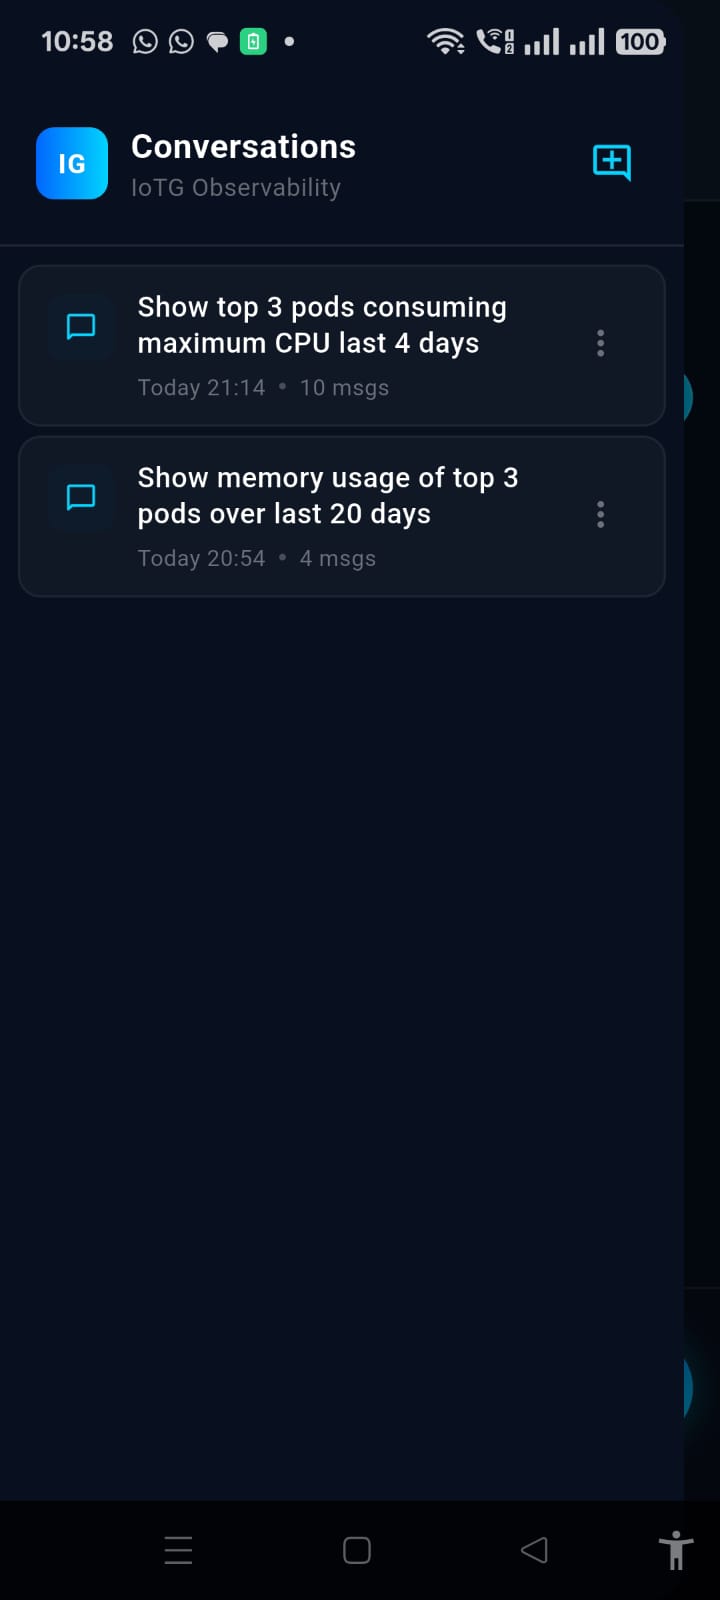
Conversation history
-
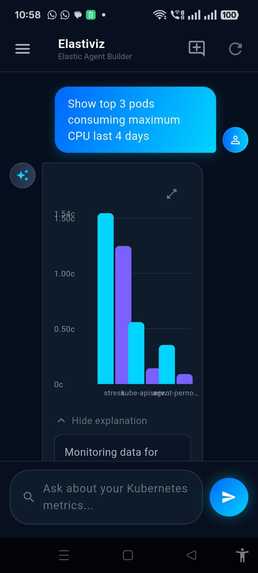
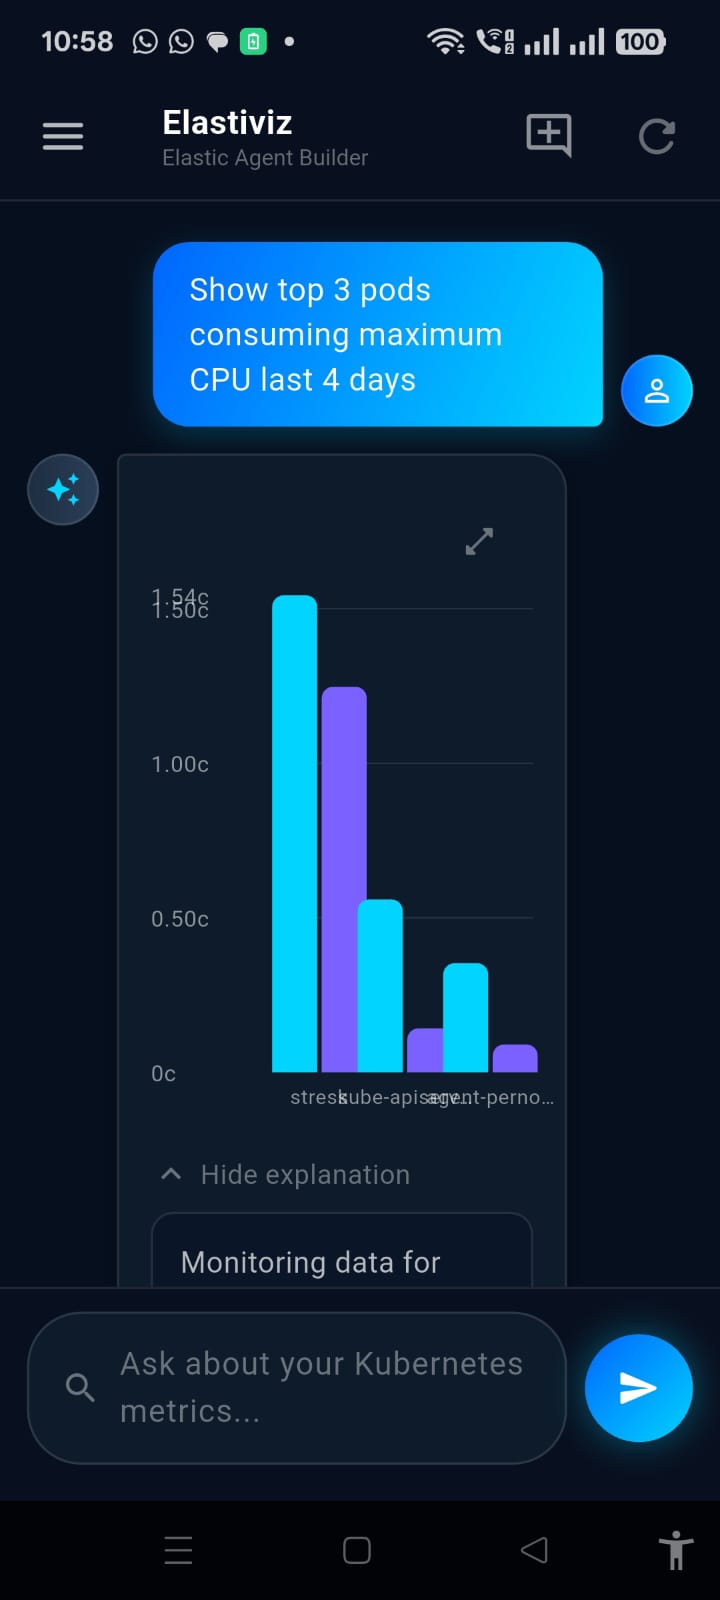
Query->Bar chart
-
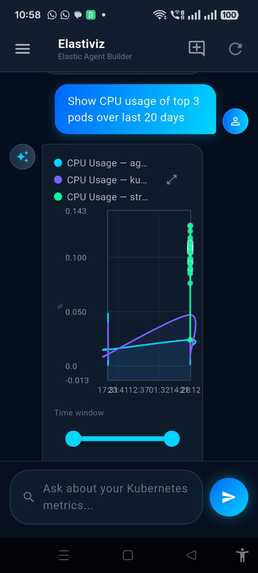
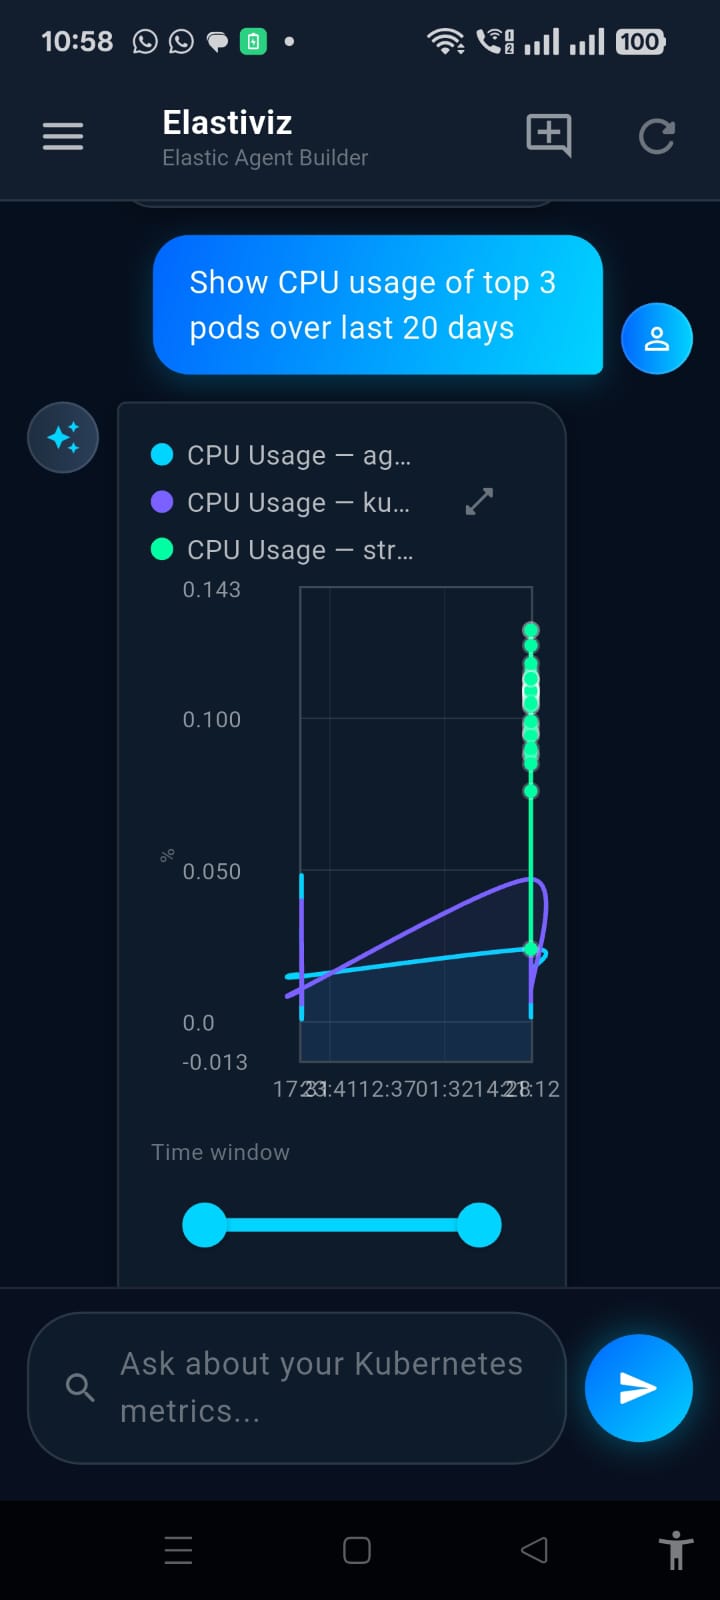
Query->Line chart
-
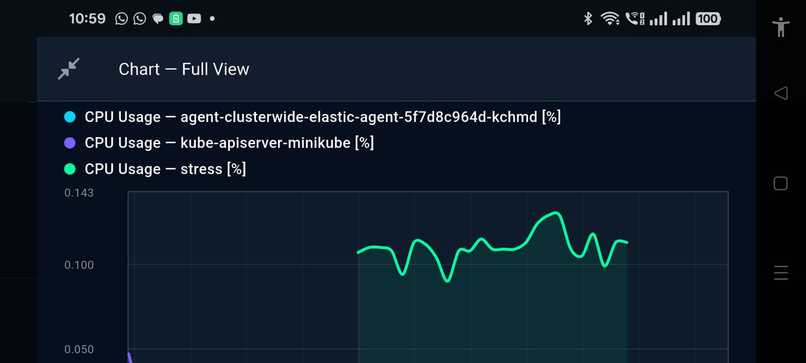
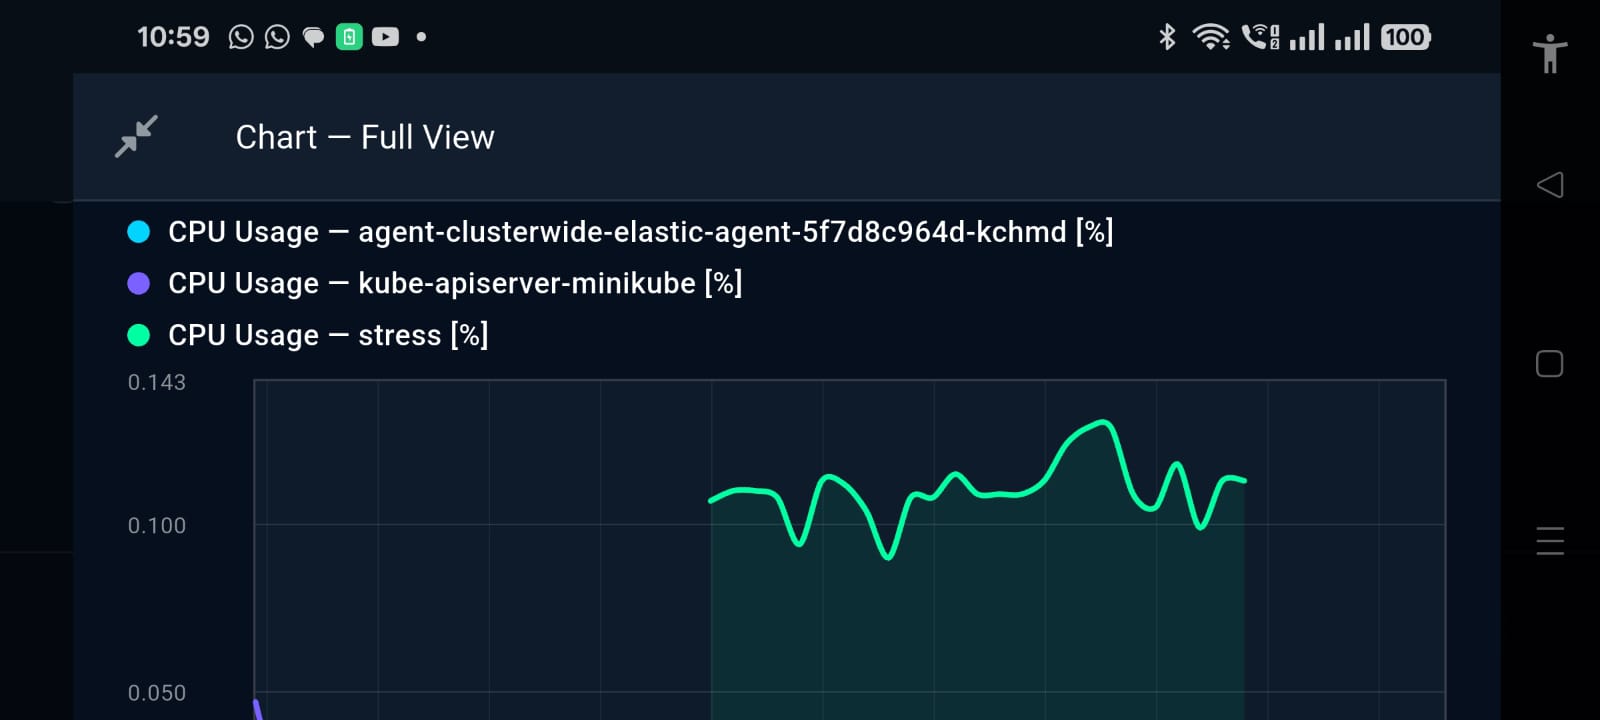
Maximised Line chart
Inspiration
The inspiration for Elastiviz came from a simple frustration: observability isn't truly "mobile." While we can check emails and Slack on the go, deep infrastructure analysis still requires a laptop, an ultra-wide monitor, and the ability to write complex queries (KQL/ES|QL). Having visualizations means either manually building dashboards beforehand or writing queries on the fly—neither of which is accessible or intuitive from a mobile phone during a commute or a quick middle-of-the-night alert.
What it does
Elastiviz is a mobile-first observability platform that prioritizes "Visuals over Verbiage." It allows users to query their infrastructure using natural language and converts those queries directly into interactive, real-time charts. Instead of reading a text summary of an error, users see the spike in memory or the drop in request throughput immediately. It bridges the gap between raw telemetry and human intent, making infrastructure health checks as easy as sending a text message.
How we built it
We built the frontend using Flutter to ensure a premium, high-performance experience across mobile and web. The backend is powered by Serverpod (Dart), orchestrating our data flow. For the data layer, we integrated Elastic's serverless observability project as our primary metrics and logs engine, utilizing the high-speed ES|QL (Elasticsearch SQL) for precise data retrieval.
Challenges we ran into
One significant hurdle was the architectural limitation of the existing Elastic AI ecosystem. At the time of development, the native Elastic AI agent could only be initialized for standard Elasticsearch projects, while our data was hosted on the Observability project. This meant we couldn't rely on out-of-the-box agentic features. To solve this, we had to "roll our own" intelligence layer.
Accomplishments that we're proud of
Despite the agent limitations, we successfully built a robust, multi-step reasoning engine from scratch. We are particularly proud of implementing our own MCP (Model Context Protocol) endpoints. This allowed us to expose complex tools—like capability discovery, metric resolution, and ESQL compilation—directly to the AI. Watching the agent reason through a multi-step investigation (discovering available metrics -> building a plan -> compiling a query -> fetching data) and seeing it land on a correct visualization was a huge win.
What we learned
We learned a massive amount about the Model Context Protocol and the power of "standardizing" tool interaction. We also discovered that for observability, "absolute" metrics (like bytes or cores) are often more reliable than percentages in environments where resource limits aren't strictly defined. Building a manual schema discovery pipeline taught us exactly how flexible—and demanding—Elasticsearch's ECS schema can be.
What's next for Elastiviz
Making this more robust so it can be able to plot any kind of complex user queries
Built With
- elasticsearch
- flutter
- serverpod


Log in or sign up for Devpost to join the conversation.