-
-
LandingDashboardCenter
-
Integrations
-
MainChat
-
MainChat
-
MainChat
-
In-depth Metrics&Analysis
-
Slack Team ALERTS
-
Github PR
-
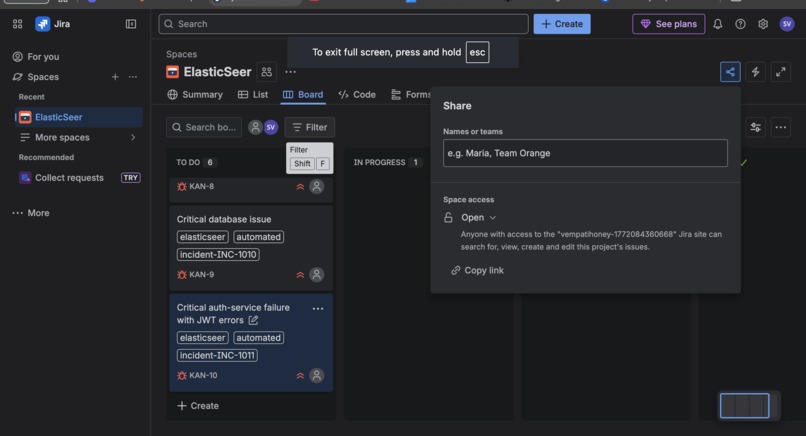
Jira Tickets


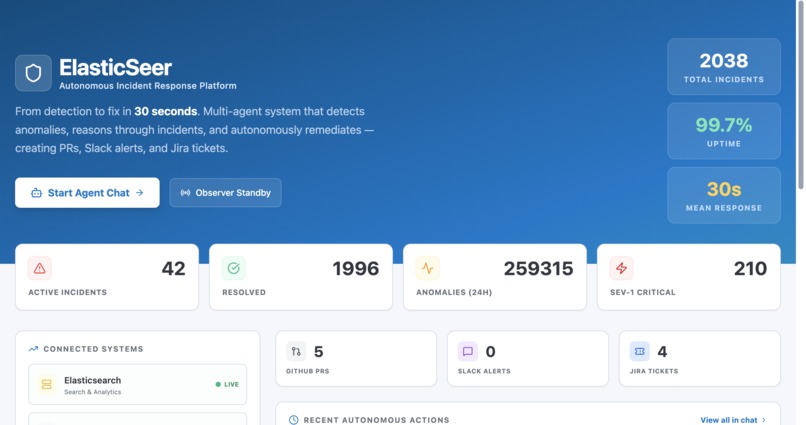
ElasticSeer: The Autonomous SRE
Inspiration
Modern cloud architectures move faster than human SREs can type. We noticed a critical gap: traditional observability platforms tell you what is broken, but leave the "Why" and "How to fix it" to burnt-out engineers.
We built ElasticSeer to bridge the gap between raw telemetry and autonomous action. We wanted a platform that doesn't just watch your system—it actively repairs it.
What it does
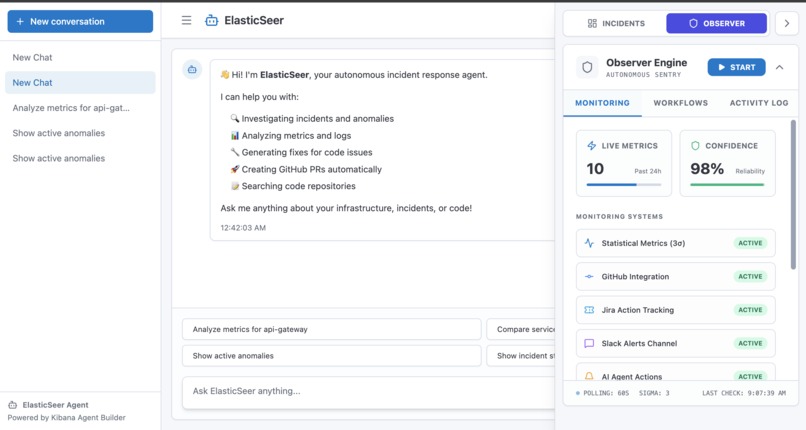
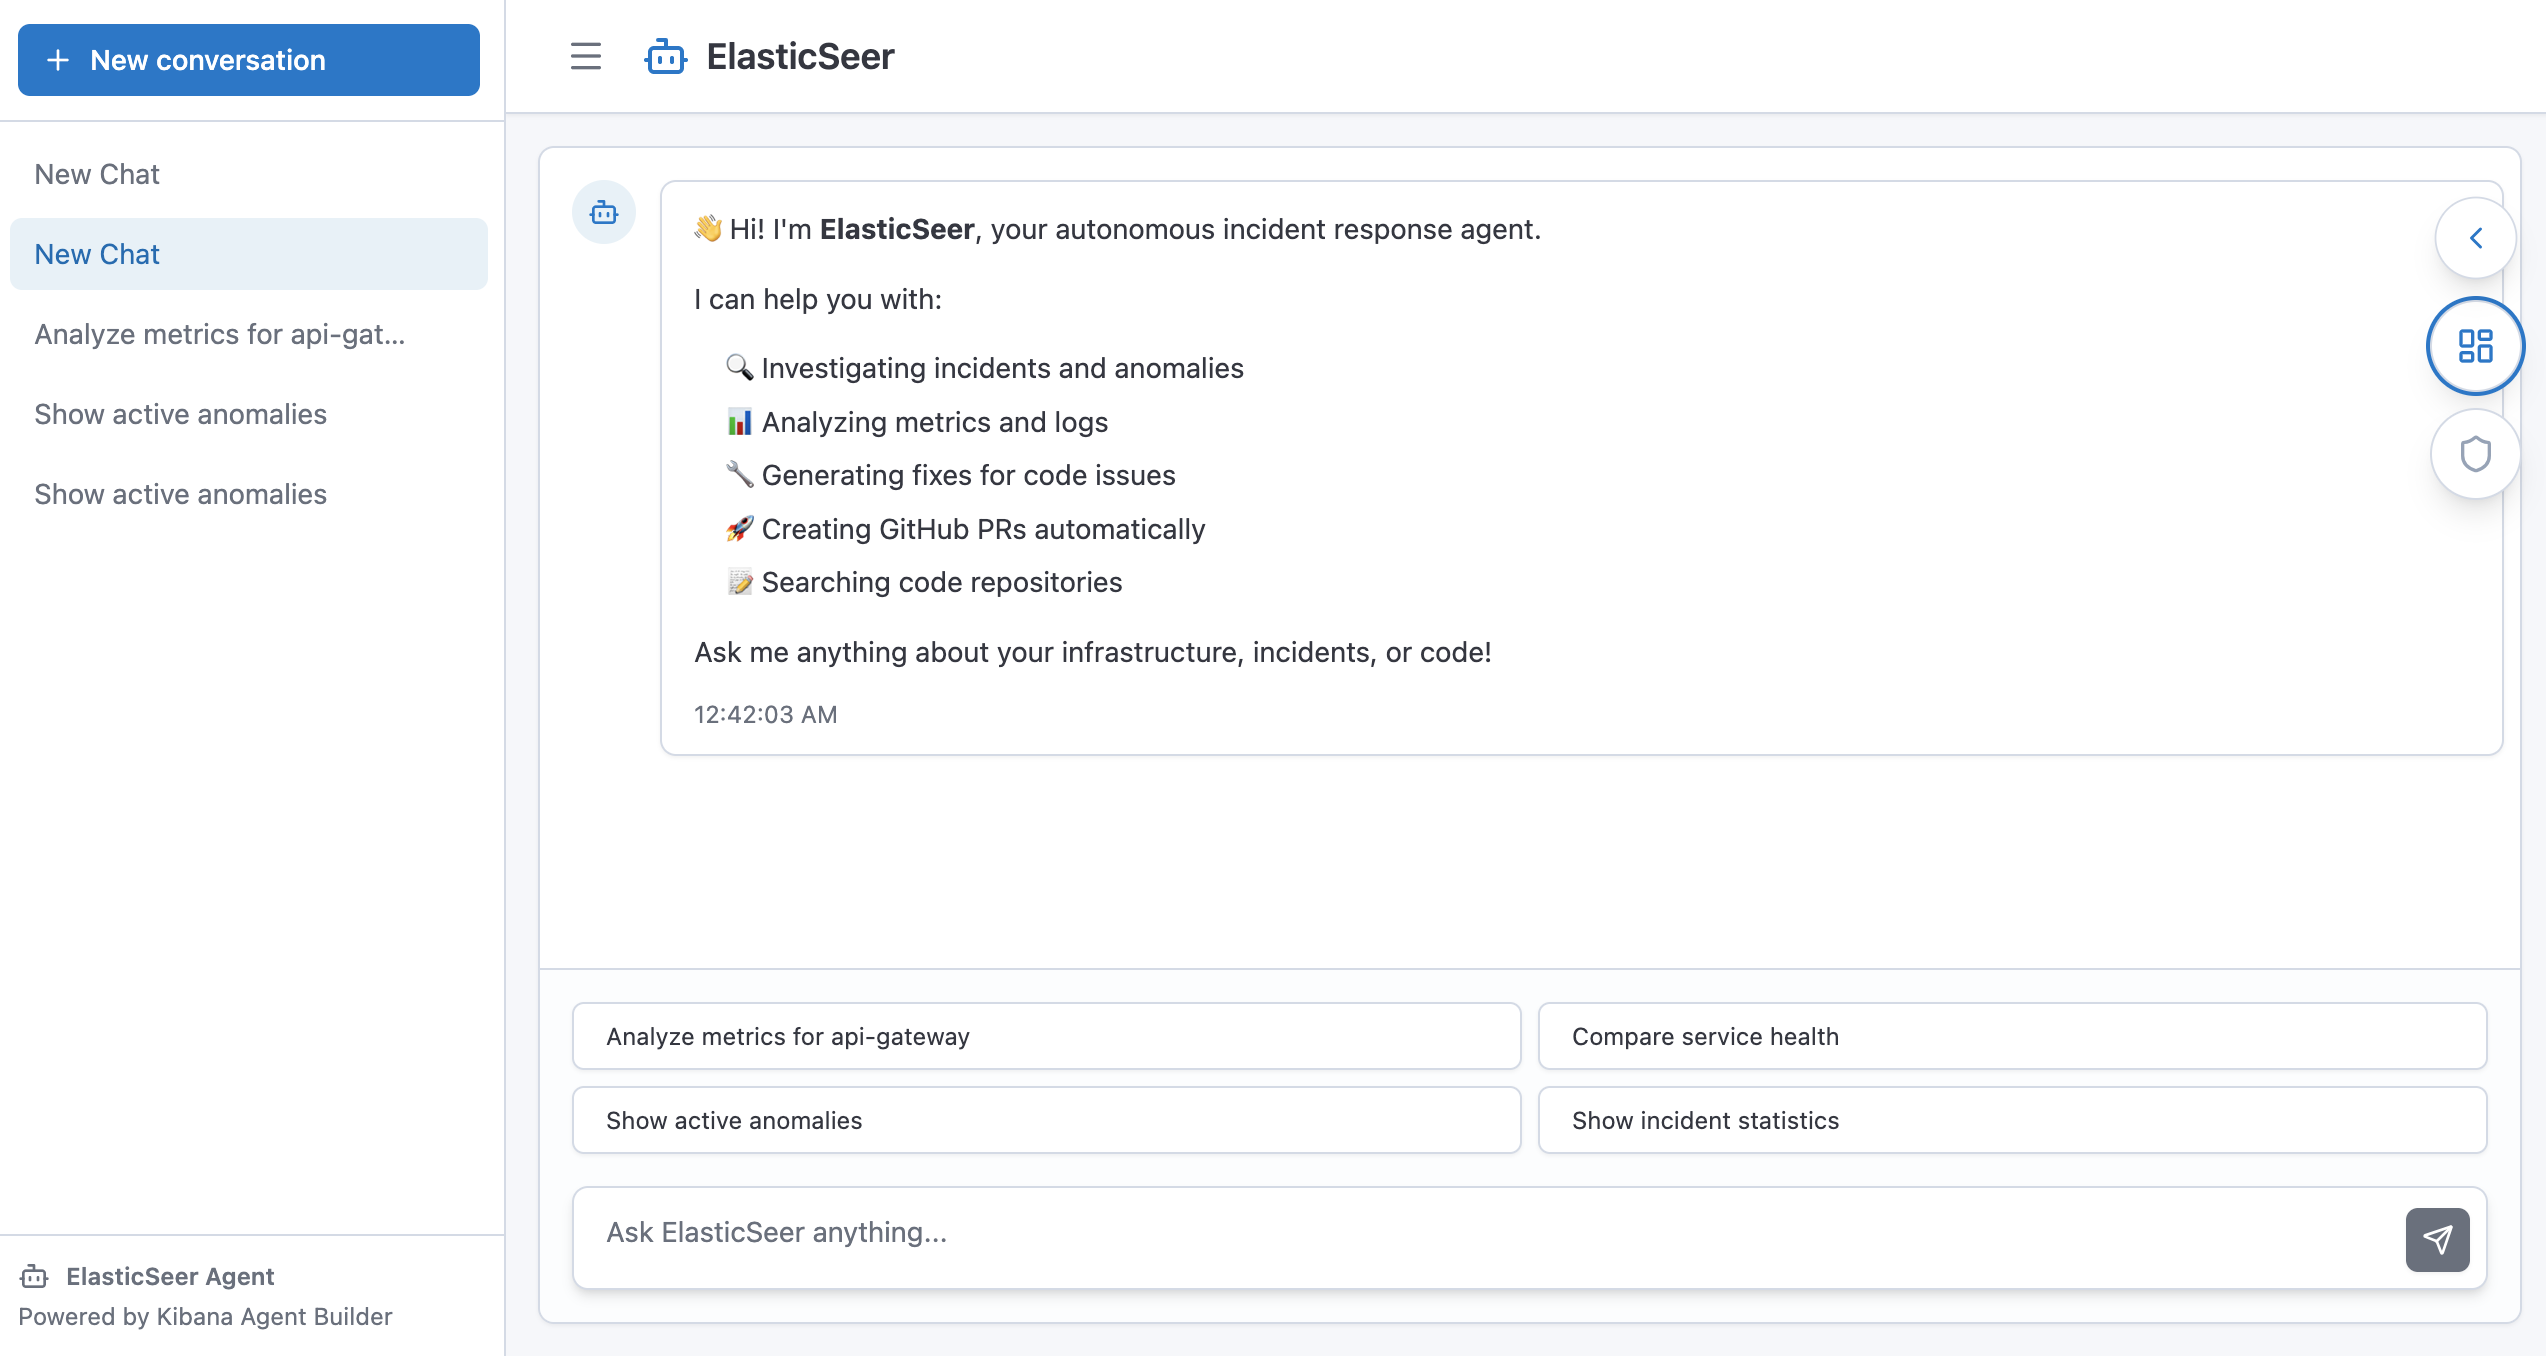
ElasticSeer is an Autonomous AI SRE that monitors your production stack 24/7. It handles the entire incident lifecycle in four phases:
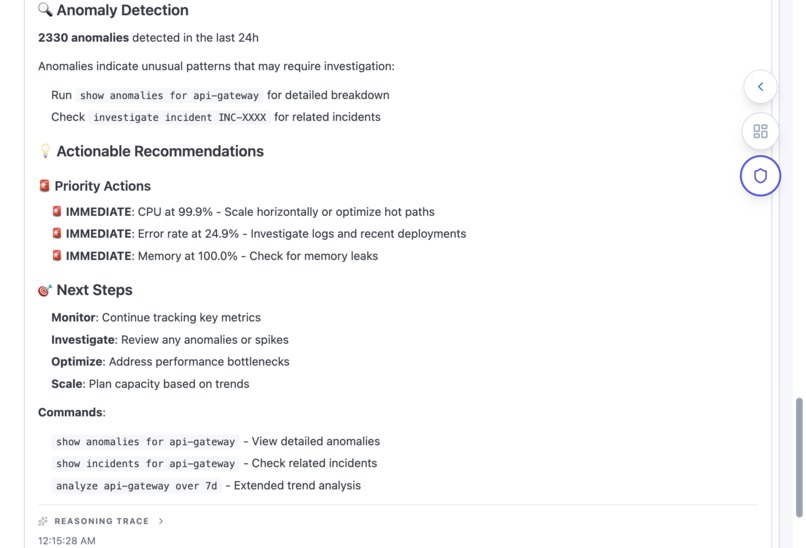
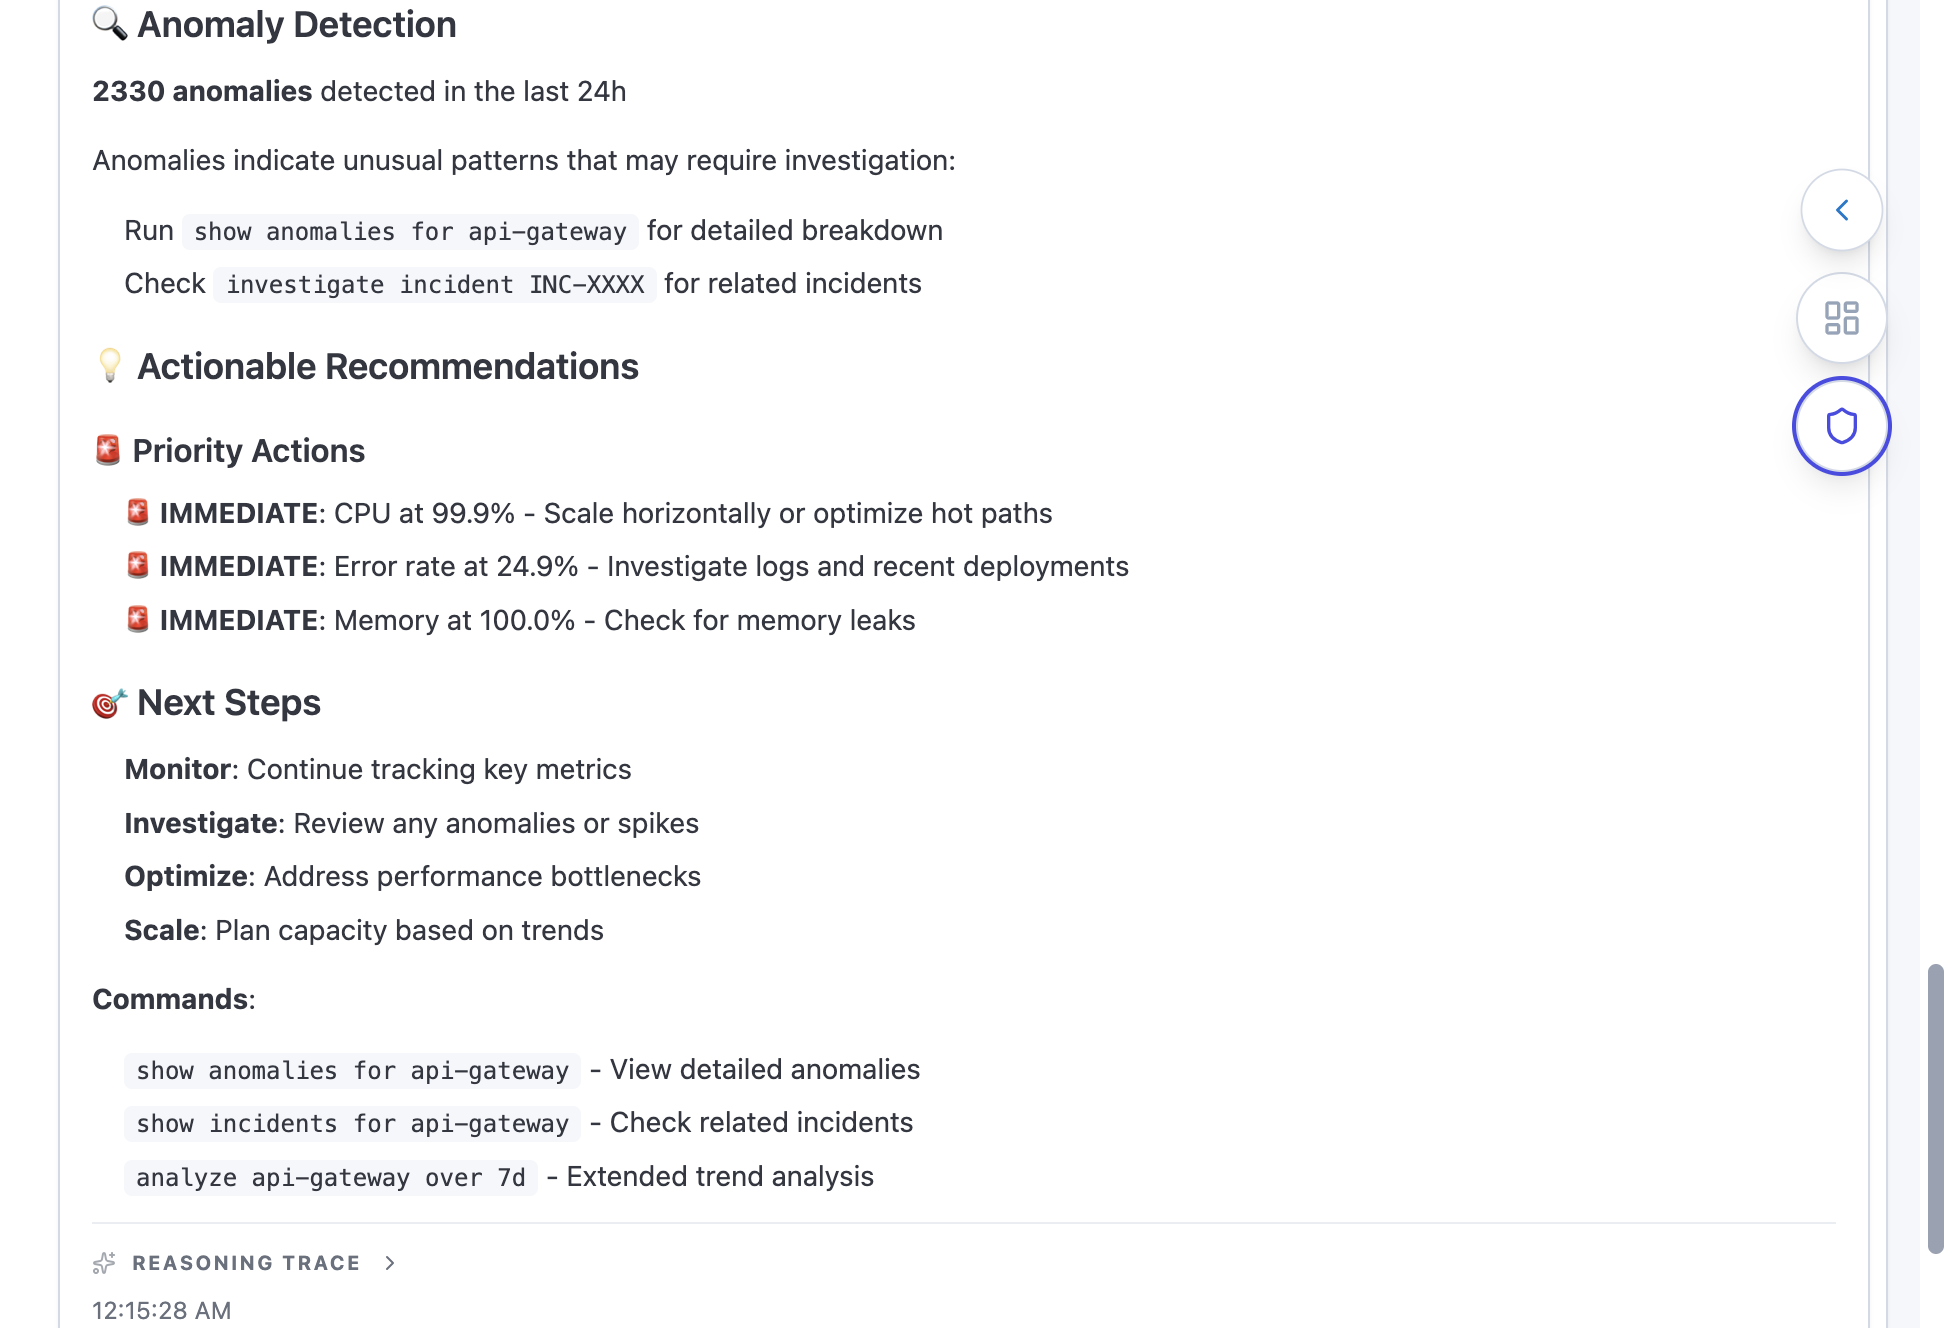
- Observe: The Observer Engine continuously scans Elasticsearch indices for metric anomalies using 3-sigma statistical analysis.
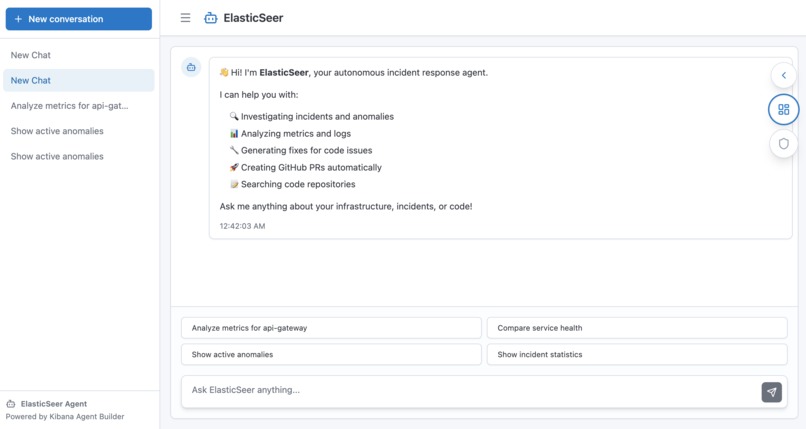
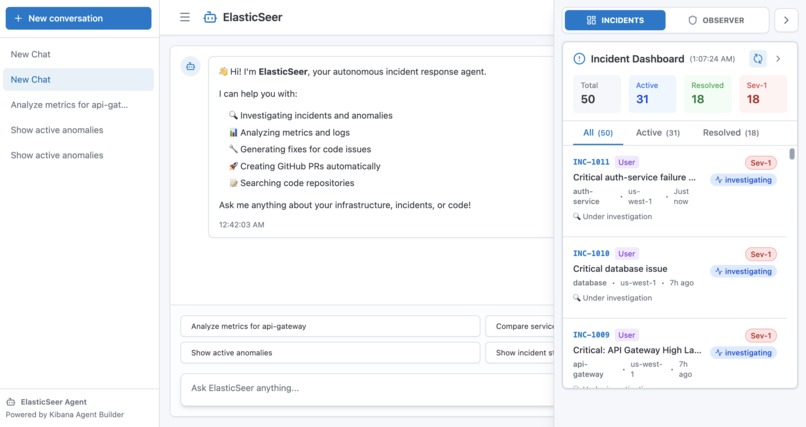
- Analyze: When a spike occurs, Gemini 1.5 Flash (via Agent Builder) performs a "Rich Analysis," correlating logs, metrics, and traces to find the root cause.
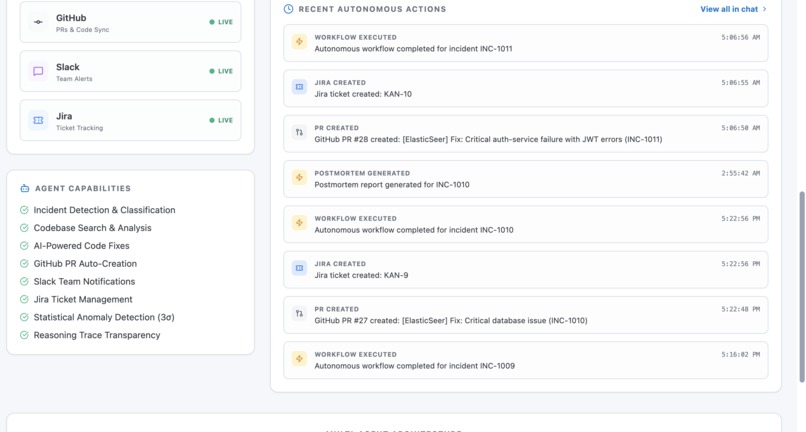
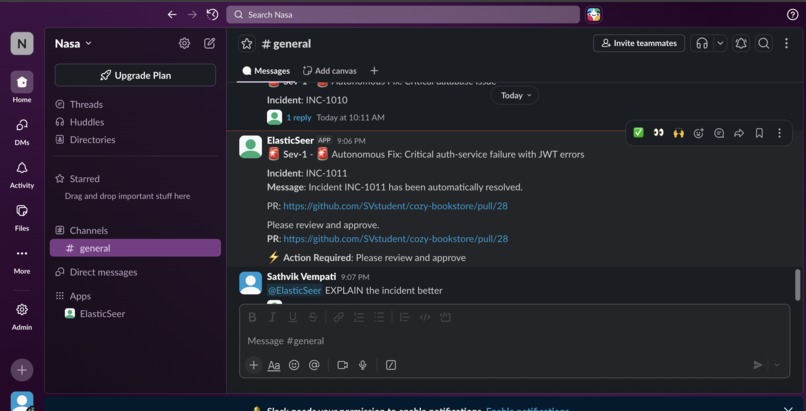
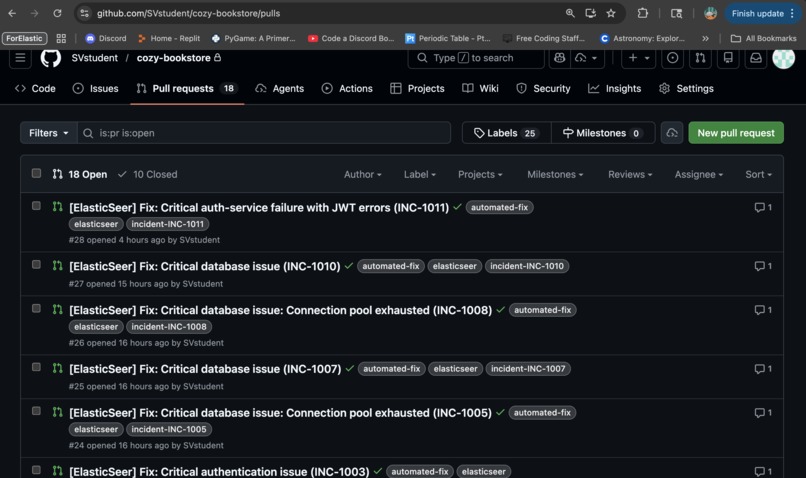
- Remediate: The agent identifies the bug in the codebase, creates a GitHub PR with the patch, and notifies the team via Slack and Jira—all in under 60 seconds.
- Visualize: A stunning "Command Center" dashboard shows live reasoning traces, KPI counters, and the system's "thought process" in real-time.
How we built it
- Intelligence: Gemini 1.5 Flash orchestrated via the Model Context Protocol (MCP), allowing the AI to query internal Elasticsearch data securely through the Elastic Agent Builder.
- Data Engine: Elasticsearch Serverless for high-performance log storage, service metrics, and incident history.
- The Core: A FastAPI (Python) backend handling persistent monitoring loops and autonomous multi-agent workflows.
- The UI: A React/Vite/Tailwind frontend featuring "Elastic Aesthetics"—glassmorphism, animated data flows, and a "Reasoning Trace" feed.
- Infrastructure: A distributed setup with the backend on Vultr (VPS) and the frontend on Vercel.
Challenges we ran into
- Mixed Content Hurdles: Deploying a cross-cloud architecture (Vercel HTTPS calling a Vultr HTTP VPS) triggered browser security blocks. We solved this by implementing a server-side proxy (Vercel Rewrites) to ensure a seamless experience.
- Reasoning at Scale: Making complex AI "thoughts" feel real-time in the UI required a specialized Reasoning-Trace architecture using Server-Sent Events (SSE) to prevent API timeouts.
- Data Consistency: Aligning complex Pydantic data models between the AI's reasoning engine and the React UI to ensure zero-crash reliability during high-pressure incident simulations.
Accomplishments we're proud of
- One-Prompt Remediation: Achieving a full "One Prompt to PR" flow where the AI fixes real production code based on live telemetry.
- The Command Center: Building a premium, "wow-factor" dashboard that feels like a professional enterprise SaaS product.
- ES|QL Mastery: Implementing complex ES|QL queries through the MCP tools to perform cross-index correlation that would normally take hours of manual filtering.
What we learned
- The Value of MCP: Grounding an LLM in real-world observability data via the Model Context Protocol is a game-changer for agent reliability.
- Agentic UX: We learned that a "Black Box" AI can be unsettling. Showing the AI's "Reasoning Trace" builds user trust and makes the autonomous experience feel magical rather than mysterious.
🔮 What's next for ElasticSeer
- Historical Learning: Implementing vector-based "Similar Fix" retrieval using Elasticsearch Vector Database to let the agent learn from previous incidents.
- Human-in-the-Loop 2.0: Expanding Slack interactivity to allow engineers to approve or edit AI patches directly via interactive Slack buttons.
- Multi-Cloud Discovery: Extending the Observer Engine to auto-discover and monitor resources across AWS, GCP, and Azure.
Built With
- agentbuilder
- elasticsearch
- fastapi
- react
- serverless
- vector
- vercel
- vultr


Log in or sign up for Devpost to join the conversation.