-
-
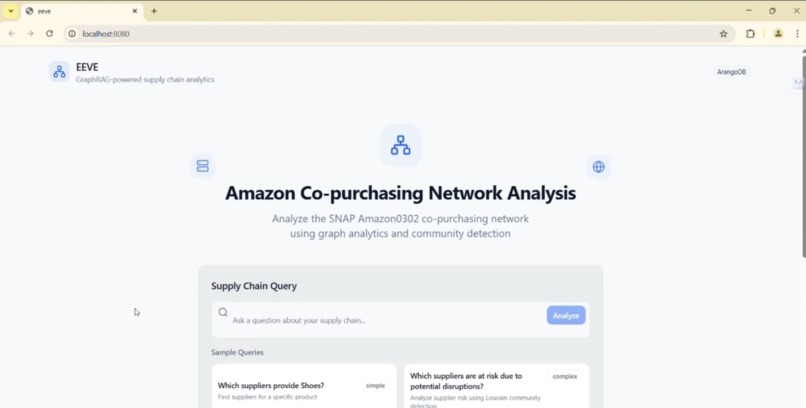
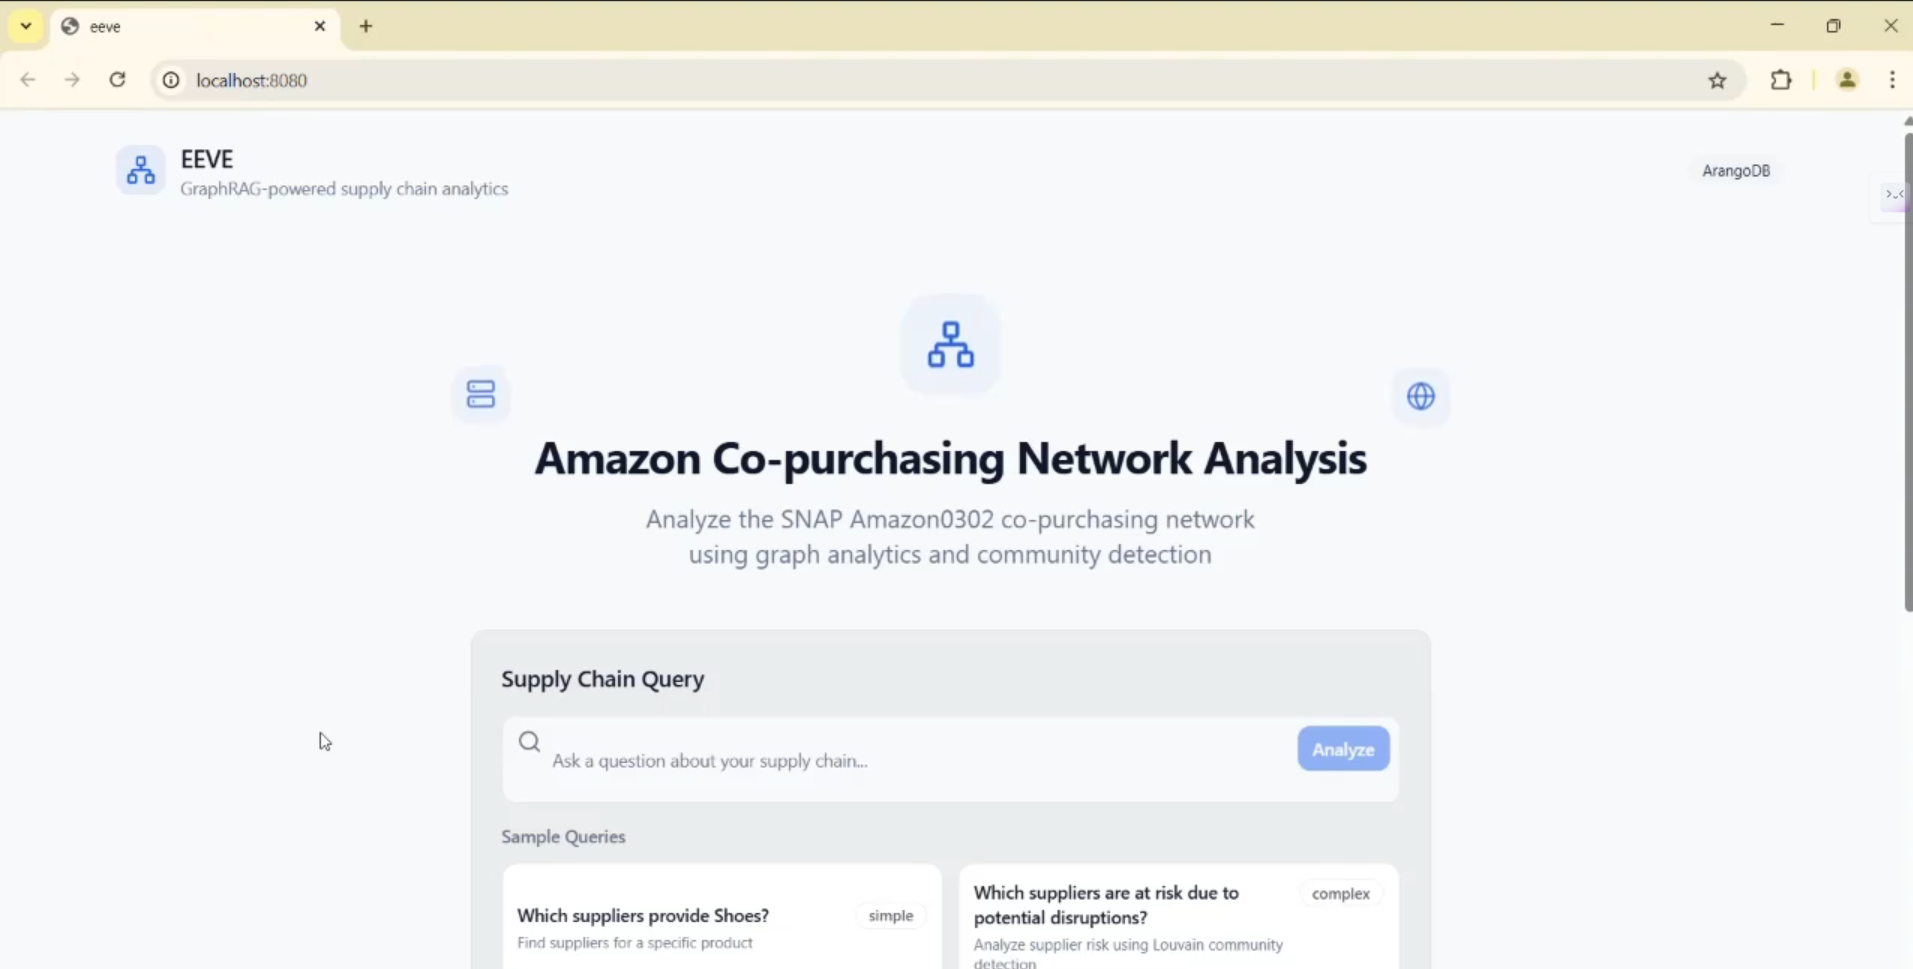
Home Page
-
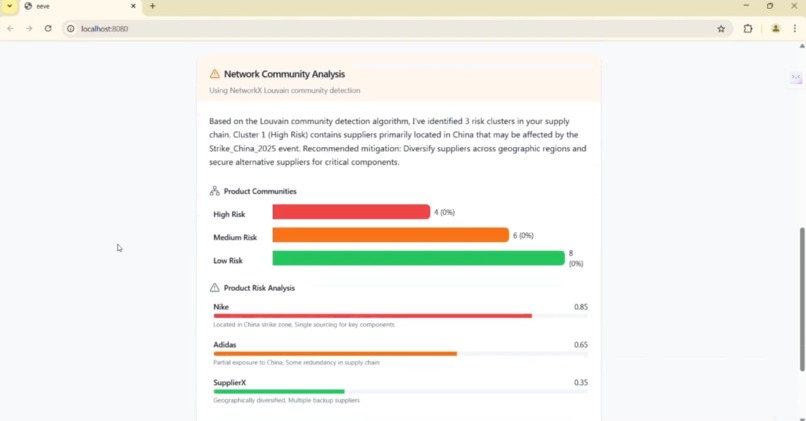
Output Analysis
-
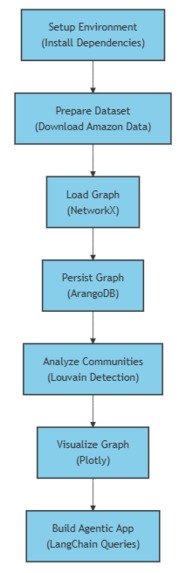
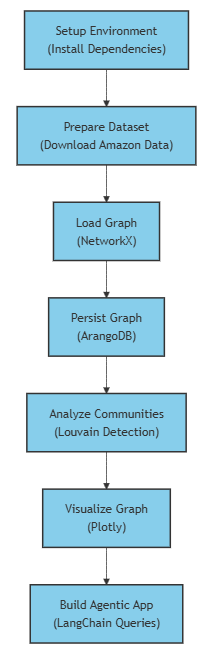
Workflow

Inspiration Behind Eevee
Imagine a supply chain as adaptable as Eevee, Pokémon’s ultimate evolver, thriving through any storm. That vision sparked this project—turning rigid networks into dynamic systems that don’t just survive but grow stronger under pressure. Inspired by anime’s flair for transformation and resilience, Eevee channels that energy into real-world impact, proving even the toughest disruptions can be tamed with the right spark of ingenuity.
About the Project
Eevee is a powerhouse built for the ArangoDB Hackathon, wielding the Amazon Co-Purchase dataset—260,000+ products, 1.2 million links—into a living graph. It clusters nodes with mock Louvain detection, spotlighting synthetic suppliers like Nike (red for risk) and Adidas (green for safe) in a vivid Plotly visualization. Powered by LangChain and GPT, it answers queries like “Which suppliers are at risk?” in a flash, blending graph analytics with AI to evolve supply chain resilience.
How I Built It
I kicked off by loading the Amazon dataset into NetworkX, enriching it with synthetic suppliers and events like Nike and Strike_China_2025. Next, we persisted it to ArangoDB with nx_arangodb, mocked Louvain detection for clustering, and spun up a Plotly graph to visualize risks. Finally, we wired LangChain with GPT-3.5 turbo into a LangGraph agent, letting it tackle natural language queries—all stitched together in Python with grit and caffeine.
Challenges We Ran Into
The dataset’s sheer size—over a million edges—tested our patience, slowing down initial loads without GPU tweaks. Louvain detection was a method that felt clunky compared to real cuGraph runs, and syncing the AI agent’s responses with graph data threw curveballs. Time crunched me hard, leaving some edges rougher than I’d hoped, but I powered through with late-night hacks.
Accomplishments That We’re Proud Of
I am stoked to have tamed a massive dataset into a sleek, interactive graph that screams resilience—red flags on Nike and Adidas pop like a boss. Nailing AI-driven queries like “Who supplies Product_2?” with spot-on answers feels epic. Plus, delivering a hackathon-ready tool with a Pokémon vibe under pressure? That’s a badge of honor we’re wearing proud.
What I Learned
I learned graph analytics can turn chaos into clarity—Louvain clustering is gold for spotting patterns. AI’s a beast at bridging data and humans, but it needs tight reins. Scaling big datasets taught me to lean on tools like ArangoDB, and hackathons showed us teamwork and deadlines can spark magic, even when the clock’s screaming.
What’s Next for Eevee
Eevee’s just hatched—next, we’re juicing it with real-time Louvain via cuGraph, scaling it for live supply data, and polishing the UI beyond Plotly HTML. We’ll weave in dynamic risk simulations (think weather or geopolitics) and aim for a deployable app that businesses can wield. Eevee’s evolution is far from over—it’s ready to level up and reshape supply chains.
Why Eevee Matters
Why settle for static tools when Eevee adapts like its namesake? It’s more than a hackathon gem—it’s a bold step toward smarter, tougher supply chains, ready to face strikes, sanctions, or anything else. With Eevee, you’re not just managing a network; you’re unleashing its potential. Want to lead the charge? Eevee’s your evolution.


Log in or sign up for Devpost to join the conversation.