EEG Scan Visualization
Inspiration
The inspiration behind this project came from my interest in artificial intelligence, neuroscience, and data visualization. EEG scans contain large amounts of brainwave data that can be difficult to interpret in raw numerical form, so I wanted to create a way to visually represent EEG activity through graphs and signal plots.
As a Computer Science student, I also wanted to gain more experience working with scientific datasets and learn how data visualization can make complex information easier to understand and analyze.
What It Does
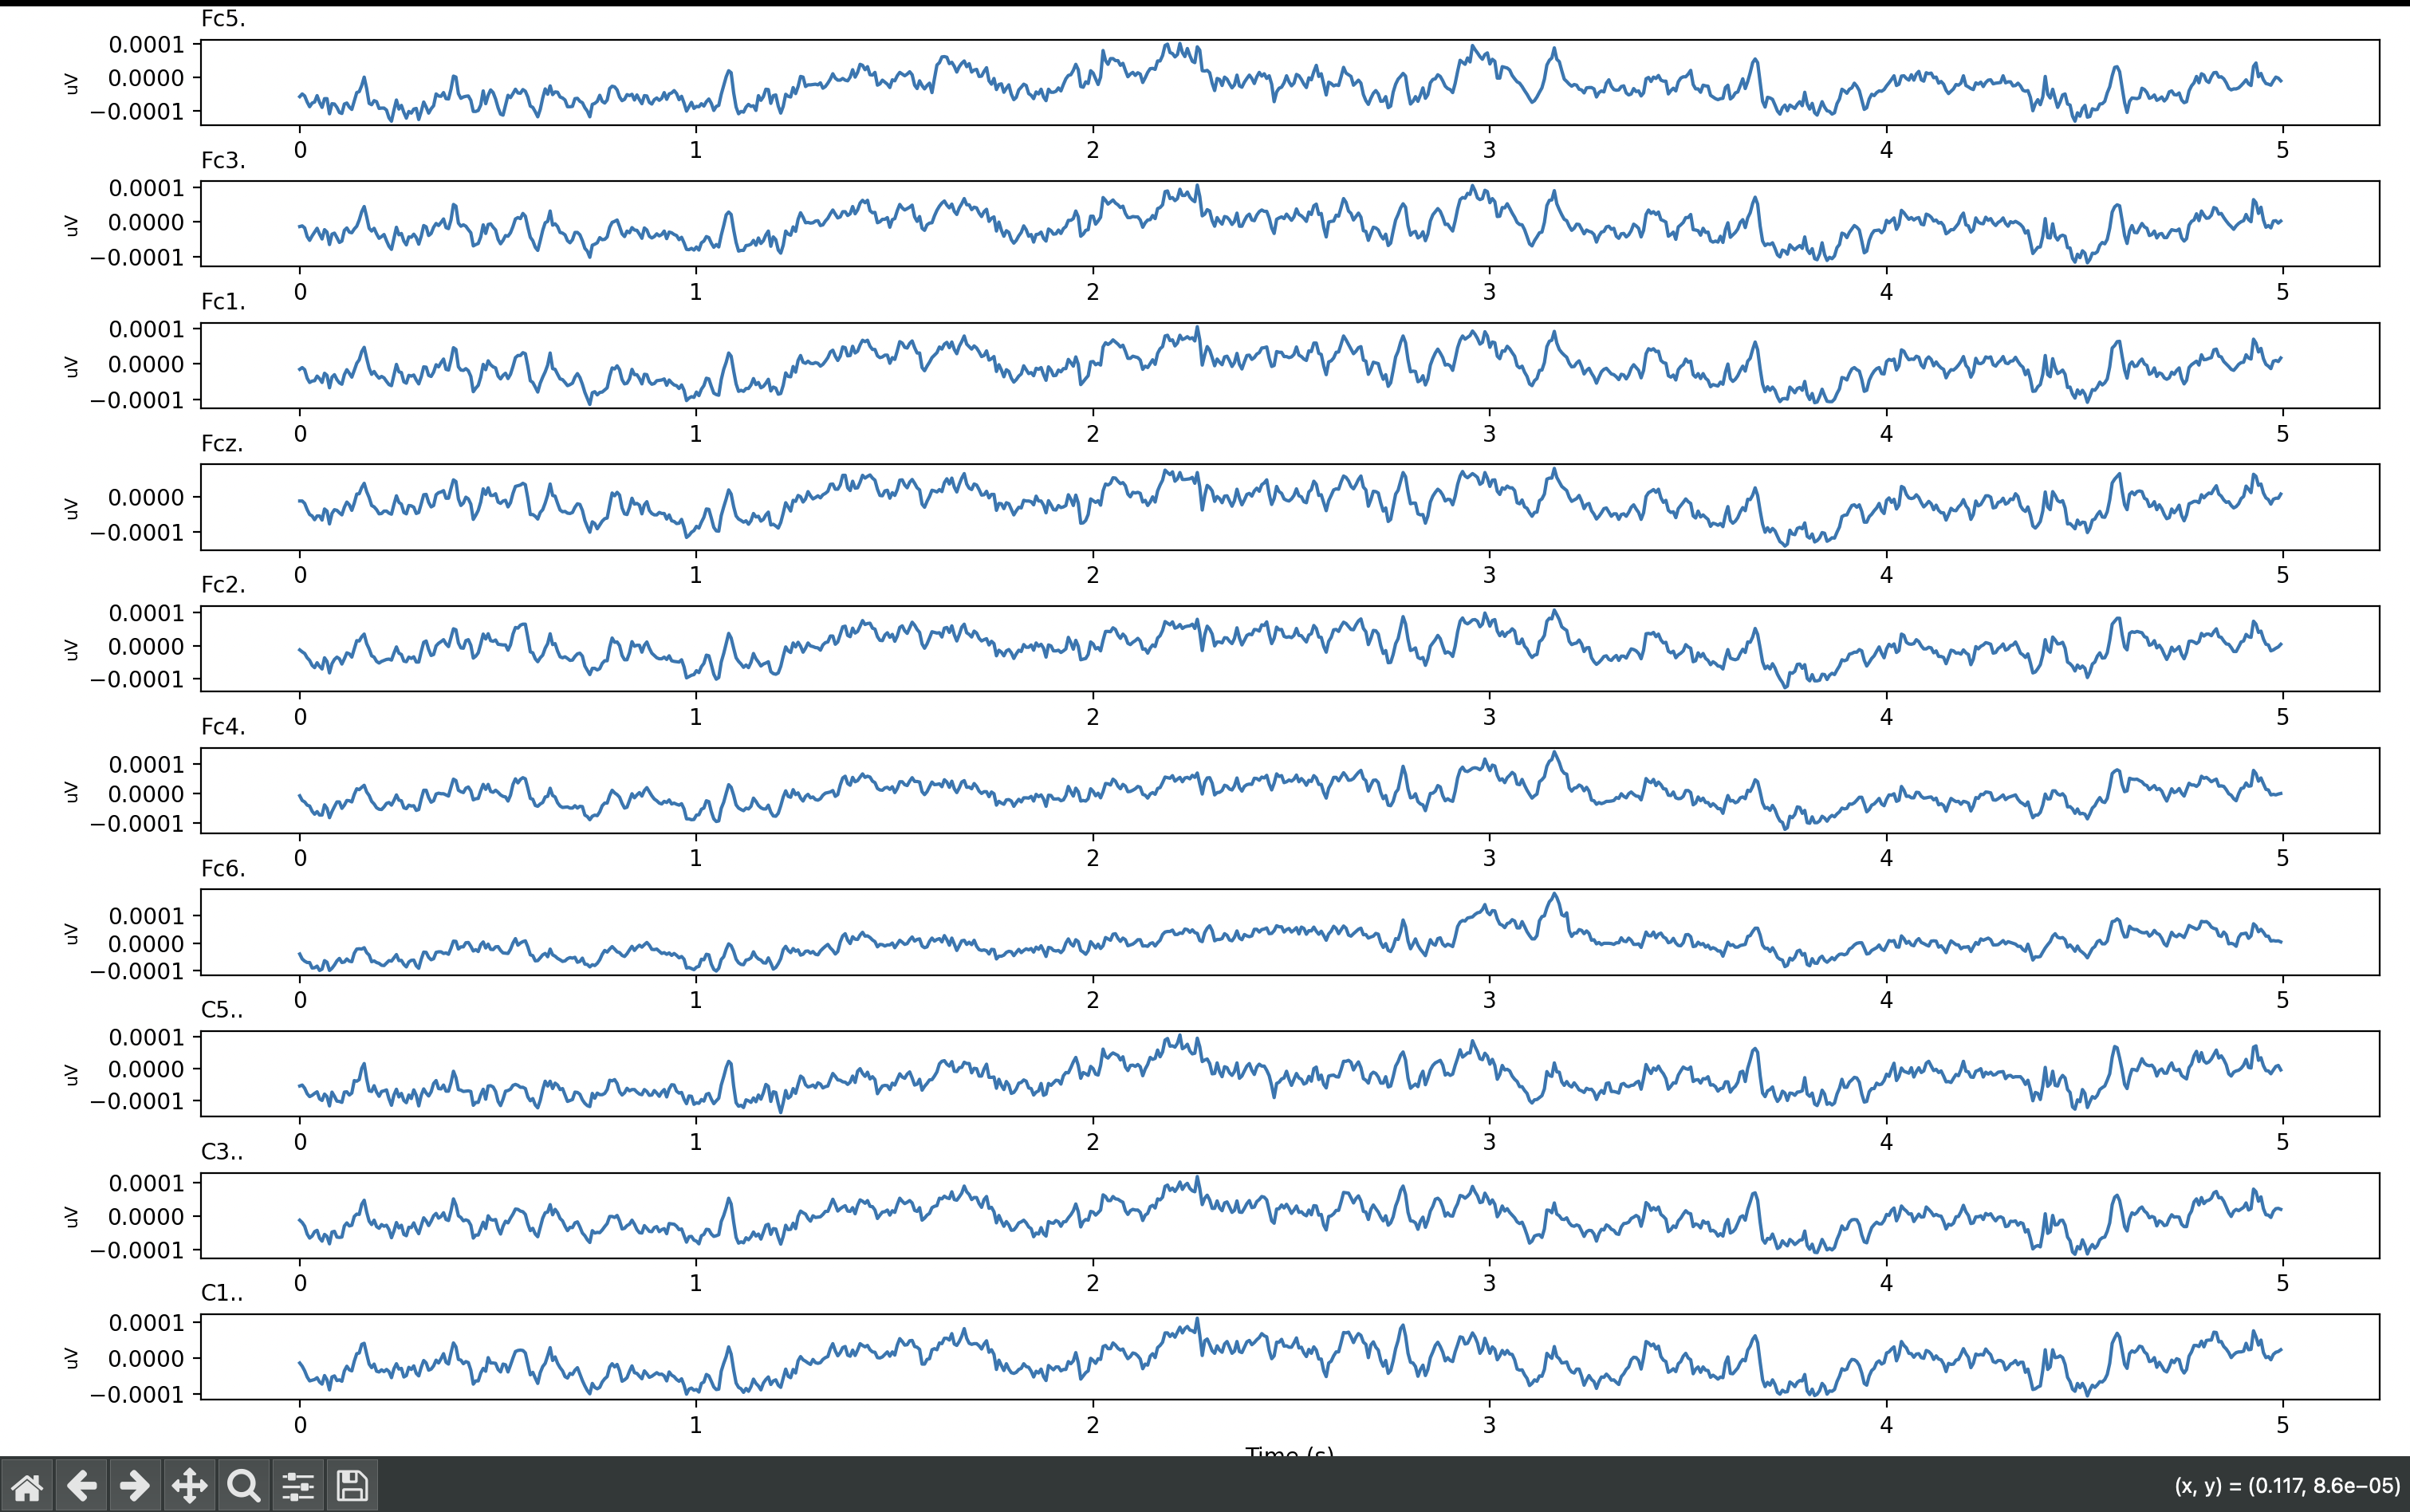
This project extracts data from EEG (Electroencephalography) scans and visualizes the brainwave activity using graphical representations. The goal of the application is to transform raw EEG signal data into clear visual patterns that can help users better understand neural activity over time.
The application:
- Loads EEG scan data
- Extracts signal information from EEG channels
- Processes brainwave recordings
- Displays EEG signals using graphs and plots
The graphs allow users to observe fluctuations in brainwave activity and identify trends or patterns within the data.
For example, EEG signals can be represented mathematically as time-series data:
$$ x(t) = A \sin(2\pi ft + \phi) $$
where:
- ( A ) represents amplitude
- ( f ) represents frequency
- ( t ) represents time
- ( \phi ) represents phase shift
This helped me better understand how brainwave signals can be visualized and analyzed computationally.
How I Built It
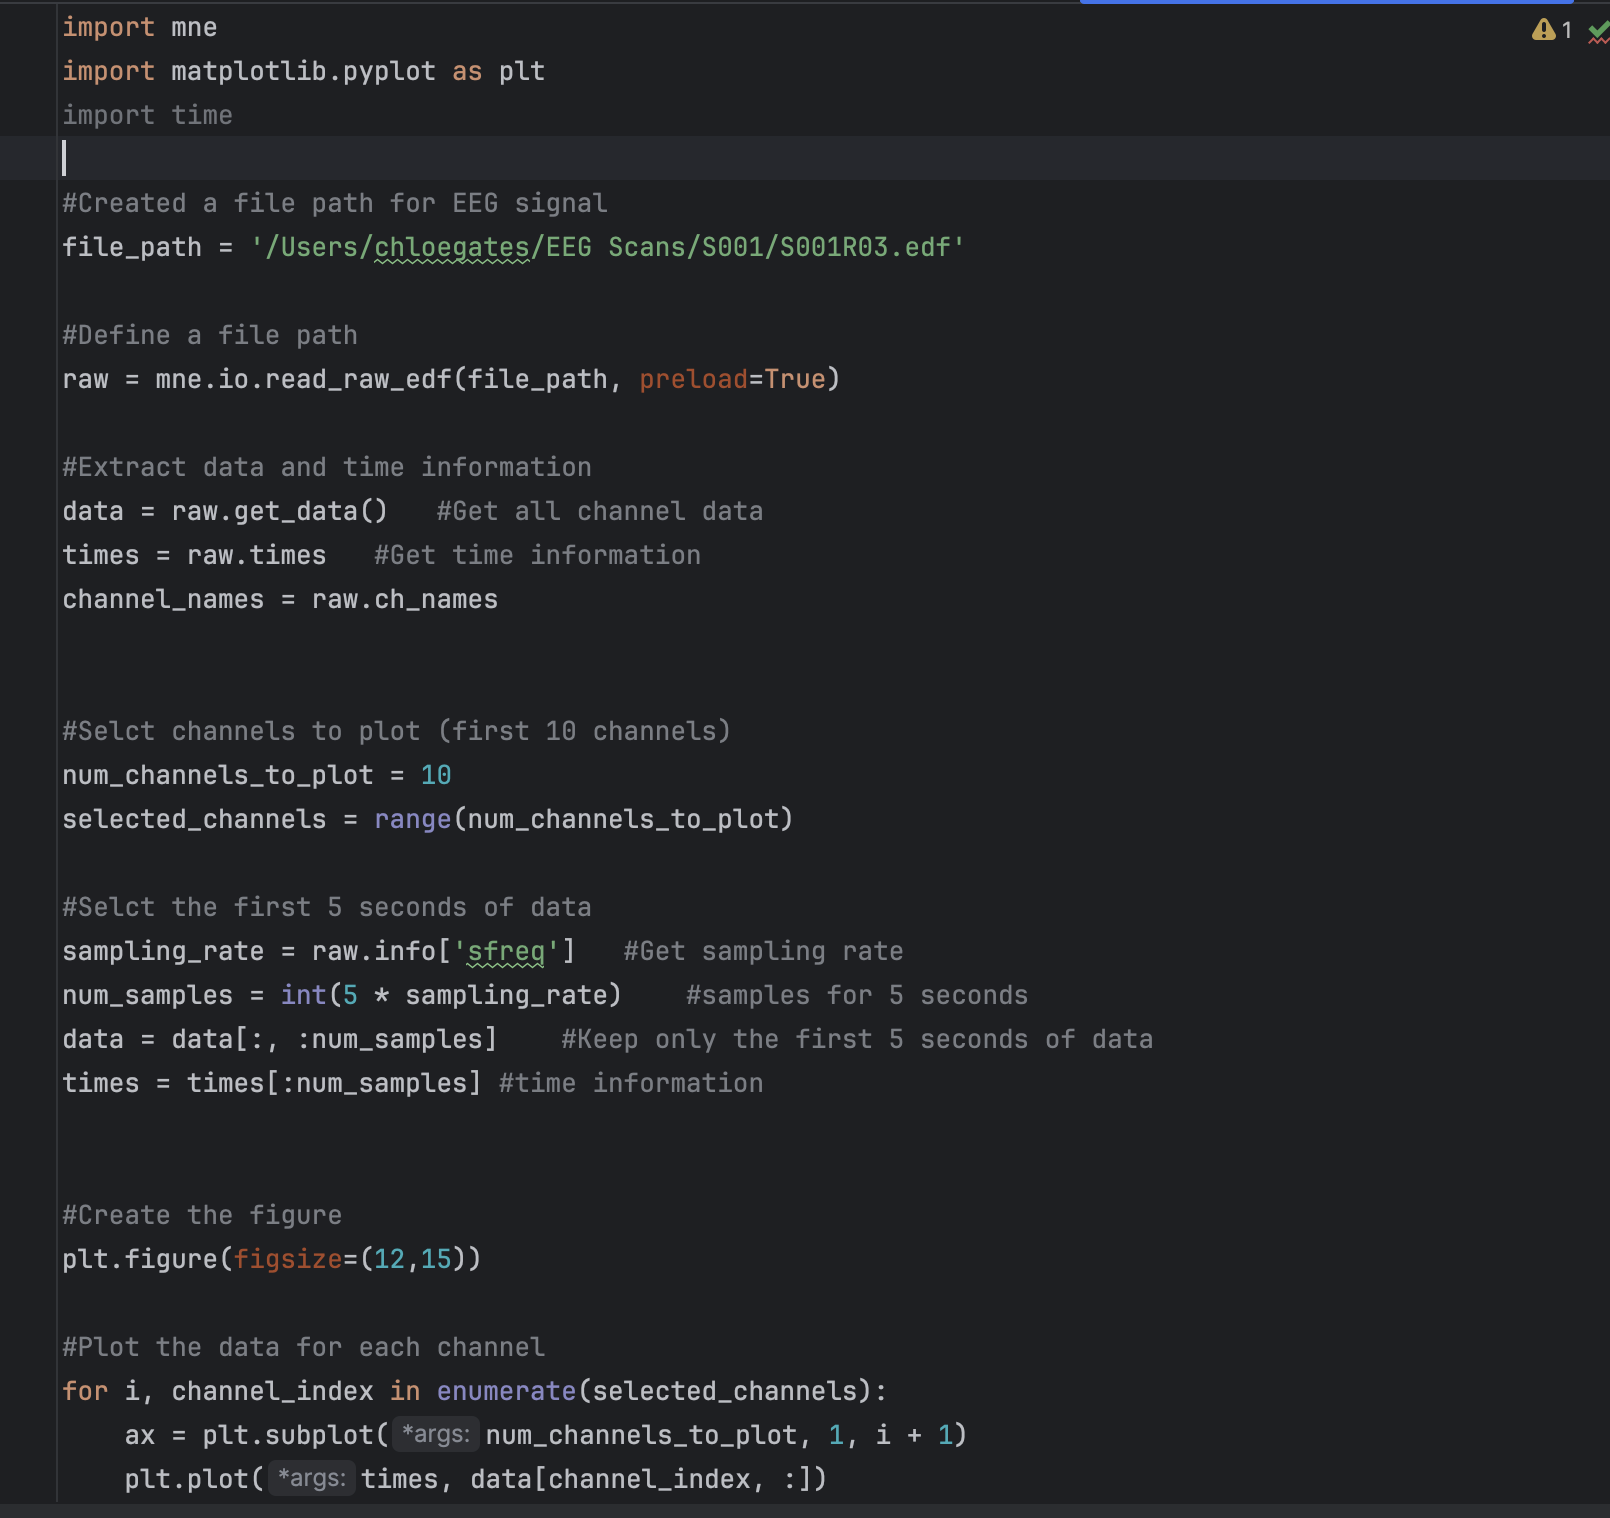
I built this project using Python along with scientific libraries designed for EEG signal processing and visualization.
Some of the main tools and libraries included:
mnefor loading and processing EEG scan datanumpyfor numerical operationsmatplotlibfor graphing and visualization
The workflow included:
- Loading EEG
.edfscan files - Extracting raw EEG signal data
- Processing the EEG channels
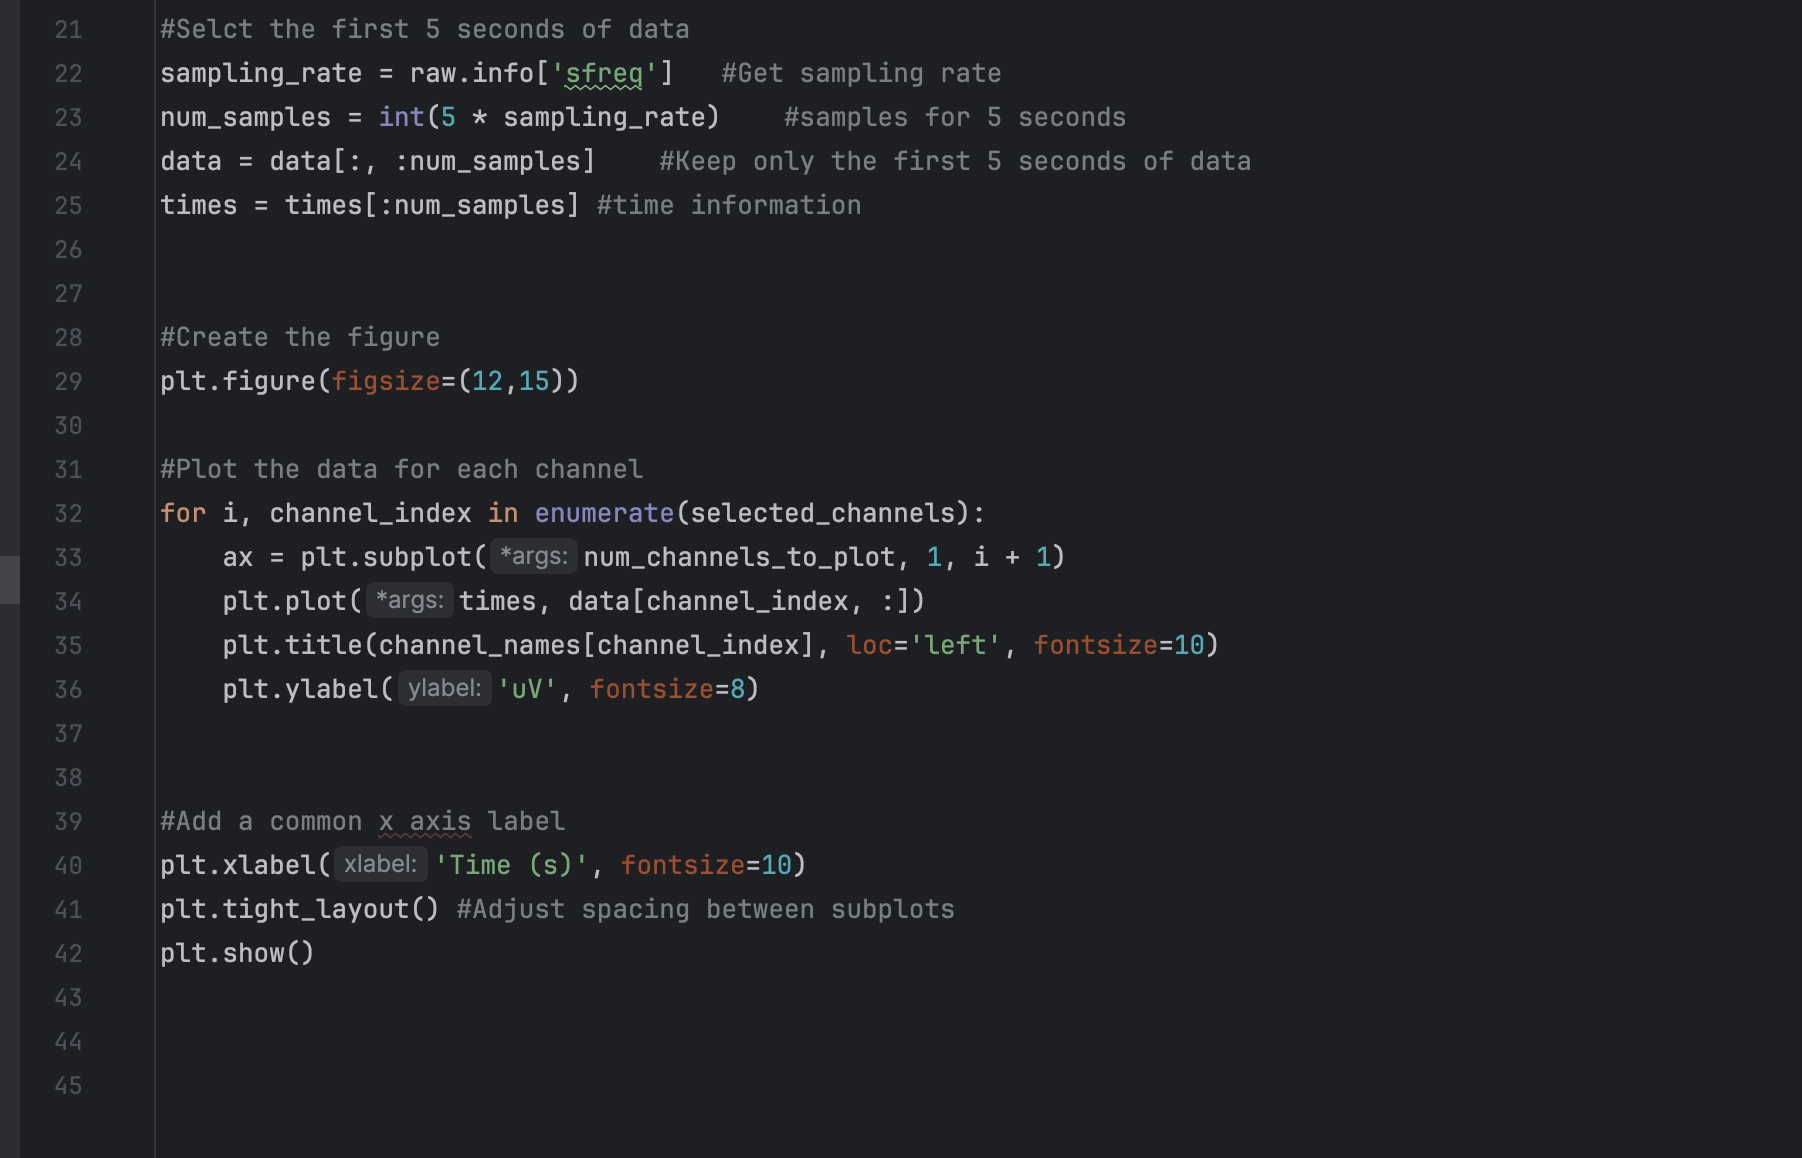
- Plotting the signals on graphs
- Visualizing changes in brainwave activity over time
I learned how to work with real scientific data and how visualization techniques can make large datasets more understandable.
Challenges I Faced
One of the biggest challenges was understanding the structure of EEG data and learning how to properly extract usable information from scan files. EEG recordings contain large amounts of data across multiple channels, which made organizing and visualizing the information more complex than expected.
Another challenge was handling noisy EEG signals and creating graphs that were readable and meaningful. Since I am still learning development, debugging data-processing issues and understanding scientific libraries required a lot of patience and experimentation.
What I Learned
Through this project, I gained experience with:
- EEG signal processing
- Scientific data visualization
- Python programming
- Working with time-series datasets
- Graphing and plotting data
- Debugging and data preprocessing
Most importantly, I learned how visualization can play a major role in understanding complex datasets, especially in fields such as neuroscience and artificial intelligence.
This project strengthened my interest in AI, data science, and biomedical technology while giving me more confidence working with real-world datasets.
Future Improvements
In the future, I would like to improve this project by:
- Adding interactive visualizations
- Creating real-time EEG signal monitoring
- Integrating machine learning for pattern recognition
- Improving graph customization and filtering
- Building a graphical user interface (GUI)
- Supporting multiple EEG datasets
My long-term goal is to continue exploring projects that combine artificial intelligence, neuroscience, and data visualization to create more advanced analytical tools.
Built With
- kaggle
- matplotlib
- mne
- python

Log in or sign up for Devpost to join the conversation.