-

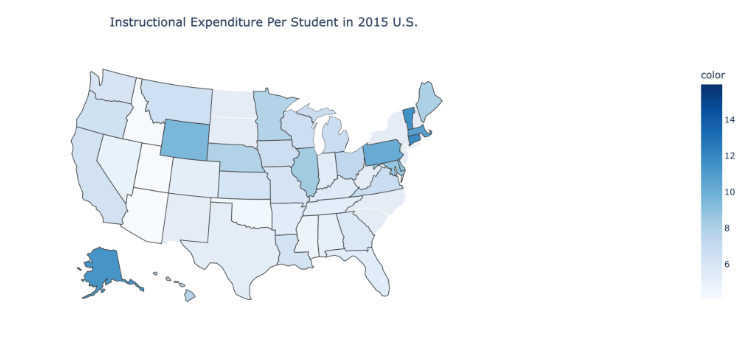
Instructional Expenditure Per Student
-

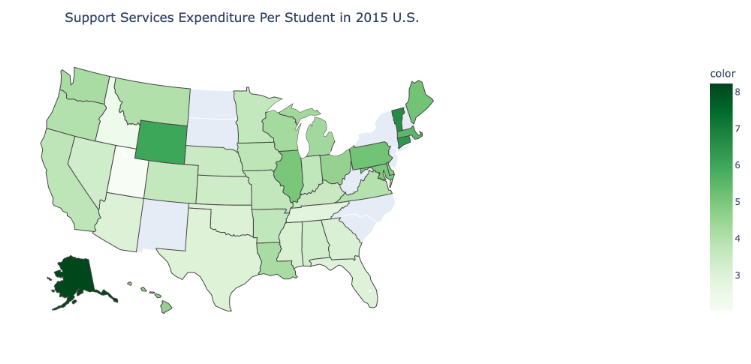
Support Service Expenditure Per Student
Inspiration
Free public school education for grades K-12 has been a benefit of the existing education system that most have us have experienced and benefitted from. What expenditures occur in order to keep state public schools running? How do those expenditures correlate with National Test Scores for select grade levels? We at EduVis were interested in exploring our Unified Education dataset (cited and located in our GitHub) to understand more about providing K-12 education from a state perspective.
What it does
Our visualizations explore education data from 2000-2019. Visualizations include heat maps, correlation matrices, and scatter plots.
How we built it
We built our visualizations with Python, Pandas, Numpy, Matplotlib, and Plotly.
Challenges we ran into
We had difficulty narrowing our scope of focus for education since it's such a broad field to get insights from. We explored census data, Harvard DataVerse and others, but eventually landed on our dataset from Kaggle since it including student performance data and other interesting features like expenditures and enrollment.. Initially, we were interested in doing greater feature engineering, deriving net income and net loss calculations with the given data. However, we realized there were discrepancies in our data (with the 'Total Expenditures' feature). Rather than pivoting to another dataset halfway through the hacking time period, we decided to ground-check the other features and analyze which features we were able to.
Accomplishments that we're proud of
We are proud of how we pivoted and worked with the data that we found. We are impressed with the visualization methods that we tried out and were excited about how clean and understandable our figures are.
What we learned
We learned a lot more about data repositories to find data, the financial aspects to running the public school system including what is contained within instructional expenditures, capital outlay expenditures and more! We also learned about various ways to handle missing data.
What's next for EduVis: Education Visualizations
We're interested in diving in deeper with this data (and aggregating more state-wise education data) through machine learning techniques. Specifically, we are interested in doing Regression Analysis. Additionally, we are interested in obtaining demographic data about students enrolled state-wise, in order to reveal potential inequalities.

Log in or sign up for Devpost to join the conversation.