-
-

Logo
-
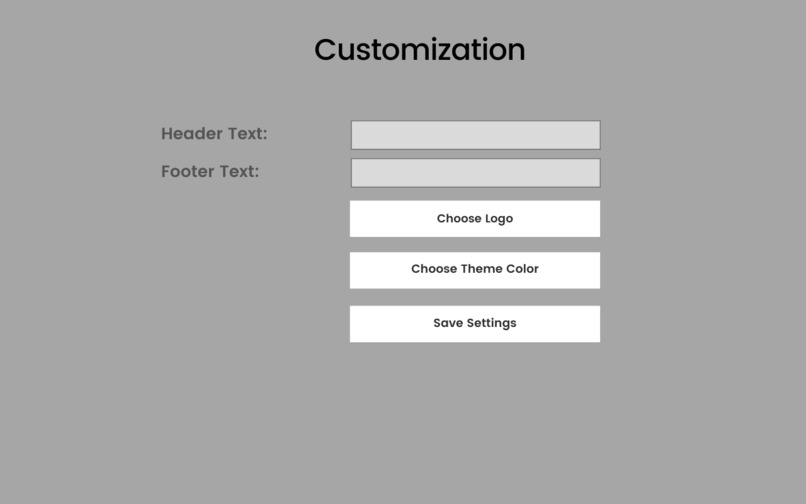
setting view
-

app view
-
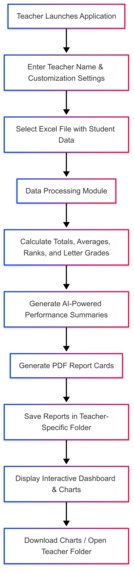
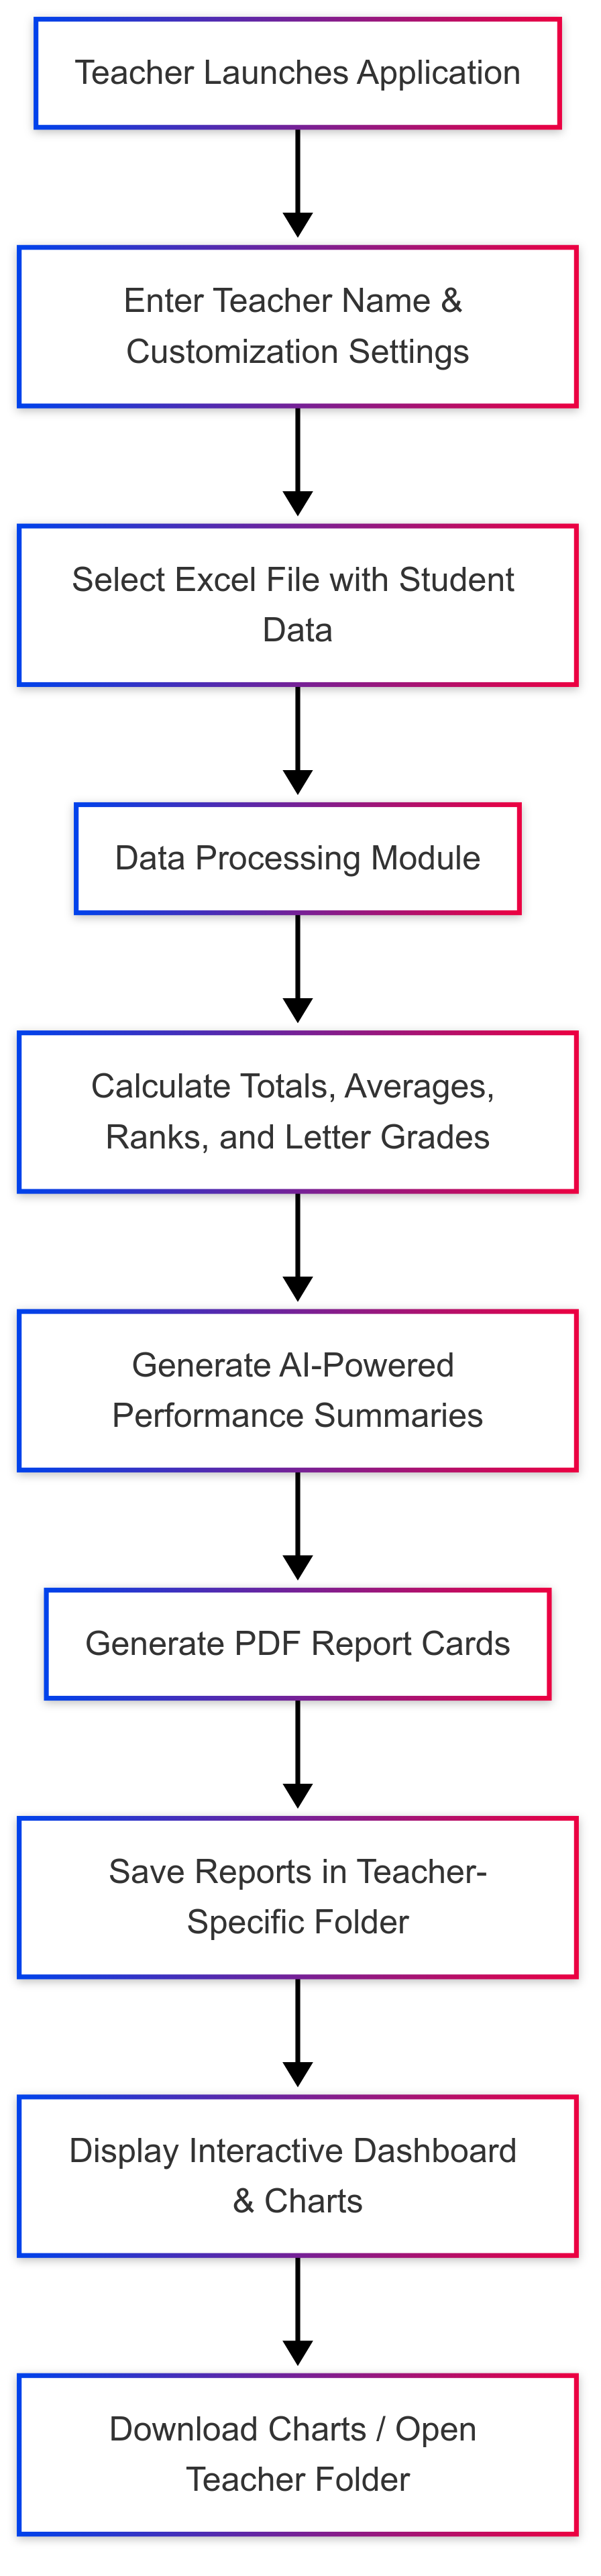
flowchart
-

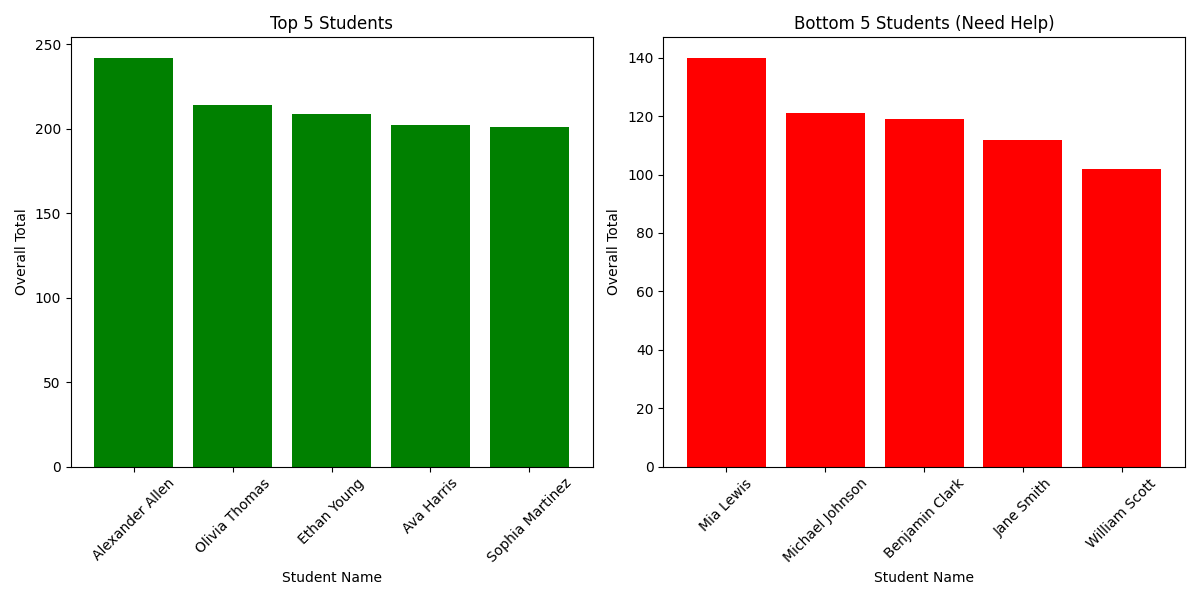
Sample of chart


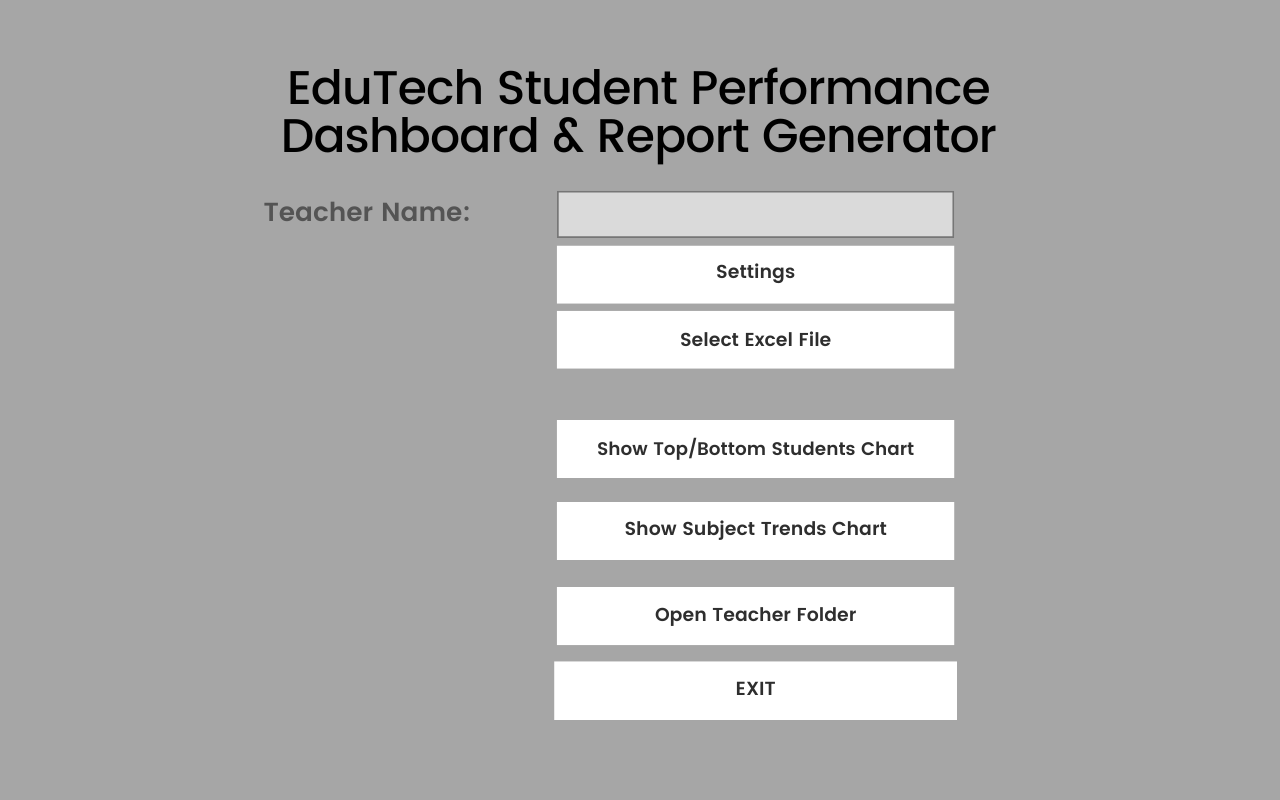
EduTech Student Performance Dashboard & Report Generator
Inspiration
Educators in Nigeria and across Africa face enormous stress when manually processing student performance data. Teachers spend long hours entering scores, calculating totals, averages, and ranks, and then generating official report cards. This repetitive process is not only time-consuming but also highly prone to human error.
Imagine a dedicated teacher, already overburdened with classroom responsibilities, spending late nights correcting mistakes in hundreds of student records. Even a small error can result in incorrect grades or miscommunication with parents. Inspired by this challenge, I set out to build a tool that automates these repetitive tasks, provides AI-powered feedback, and ultimately reduces teacher stress.
What It Does
- Automated Calculations:
Processes raw student data (FA1, FA2, Exam scores) to compute subject totals, overall averages, ranks, and letter grades. - AI-Powered Feedback:
Utilizes the Groq API to generate concise, personalized performance summaries for each student. - PDF Report Generation:
Creates individual, professional PDF report cards stored in teacher-specific folders. - Interactive Dashboard:
Offers visual insights through charts showing overall grade distribution, top performers, and areas where students need additional help. - Local File Management & Customization:
Teachers can upload Excel files, and the system automatically organizes data into folders based on the teacher’s name. Customization options include setting custom header/footer text, choosing a logo, and selecting a theme color.
How I Built It
- Ideation & Planning (Day 1 - Day 15):
- Identified key challenges in manual data processing and report generation.
- Outlined the core features required to address these challenges.
- Development & Coding (Day 16 - Day 40):
- Used Pandas to process Excel files and calculate totals, averages, and ranks.
- Integrated the Groq API to produce AI-powered performance summaries.
- Built a PDF report generation module with FPDF, incorporating customizable settings.
- Developed an interactive dashboard using Tkinter for the GUI and Matplotlib for visualizations.
- Refinement & Finalization (Day 50):
- Tested extensively to ensure accuracy and a smooth user experience.
- Enhanced the user interface and error handling to reduce teacher stress.
- Finalized documentation and prepared the project for submission.
Challenges We Ran Into
- Integration Complexity:
Combining data processing, AI feedback, PDF generation, and interactive visualizations into one application was multifaceted and required careful coordination. - AI Tuning:
Iteratively adjusting the Groq API prompts to generate concise, useful feedback was a significant challenge. - Teacher Stress & Human Error:
The manual process is not only tedious but also highly prone to mistakes, leading to increased stress. This underscored the need for robust automation and error handling. - Solo Development:
Managing all aspects of the project—from coding to UI/UX design—alone required strong time management and problem-solving skills under tight deadlines.
Accomplishments That I'm Proud Of
- Seamless Automation:
Successfully automated the calculation of student scores, rankings, and the generation of detailed PDF report cards. - Effective AI Integration:
Achieved a balance with the Groq API to produce concise and actionable performance summaries. - User-Friendly Interface:
Developed an intuitive, customizable GUI that makes the tool accessible and easy to use for educators. - Robust File Management:
Implemented a system that creates teacher-specific folders, ensuring organized storage and easy retrieval of reports.
What I Learned
- Technology Integration:
I learned how to effectively combine Python libraries (Tkinter, Pandas, FPDF, Matplotlib) with an external AI API to create a unified solution. - User-Centered Design:
Designing with the end-user in mind reinforced the importance of creating tools that are both functional and intuitive. - Problem-Solving Under Pressure:
Overcoming the challenges of solo development and tight deadlines taught me valuable lessons in perseverance and prioritization. - Data Visualization:
I gained deeper insights into transforming raw data into clear, actionable visualizations that aid in decision-making.
What's Next for EduTech Student Performance Dashboard & Report Generator
- Advanced Analytics:
Incorporate more detailed performance trends and predictive insights to further assist teachers in identifying areas for improvement. - Cloud Integration:
Develop a web-based version for multi-user access and remote data storage. - Mobile Application:
Extend the solution to mobile platforms for on-the-go access by educators. - Automated Notifications:
Implement features such as automated email notifications to send report cards to parents and administrators. - Enhanced Customization:
Add more personalization options for report layouts and branding to meet the diverse needs of educational institutions.


Log in or sign up for Devpost to join the conversation.