-

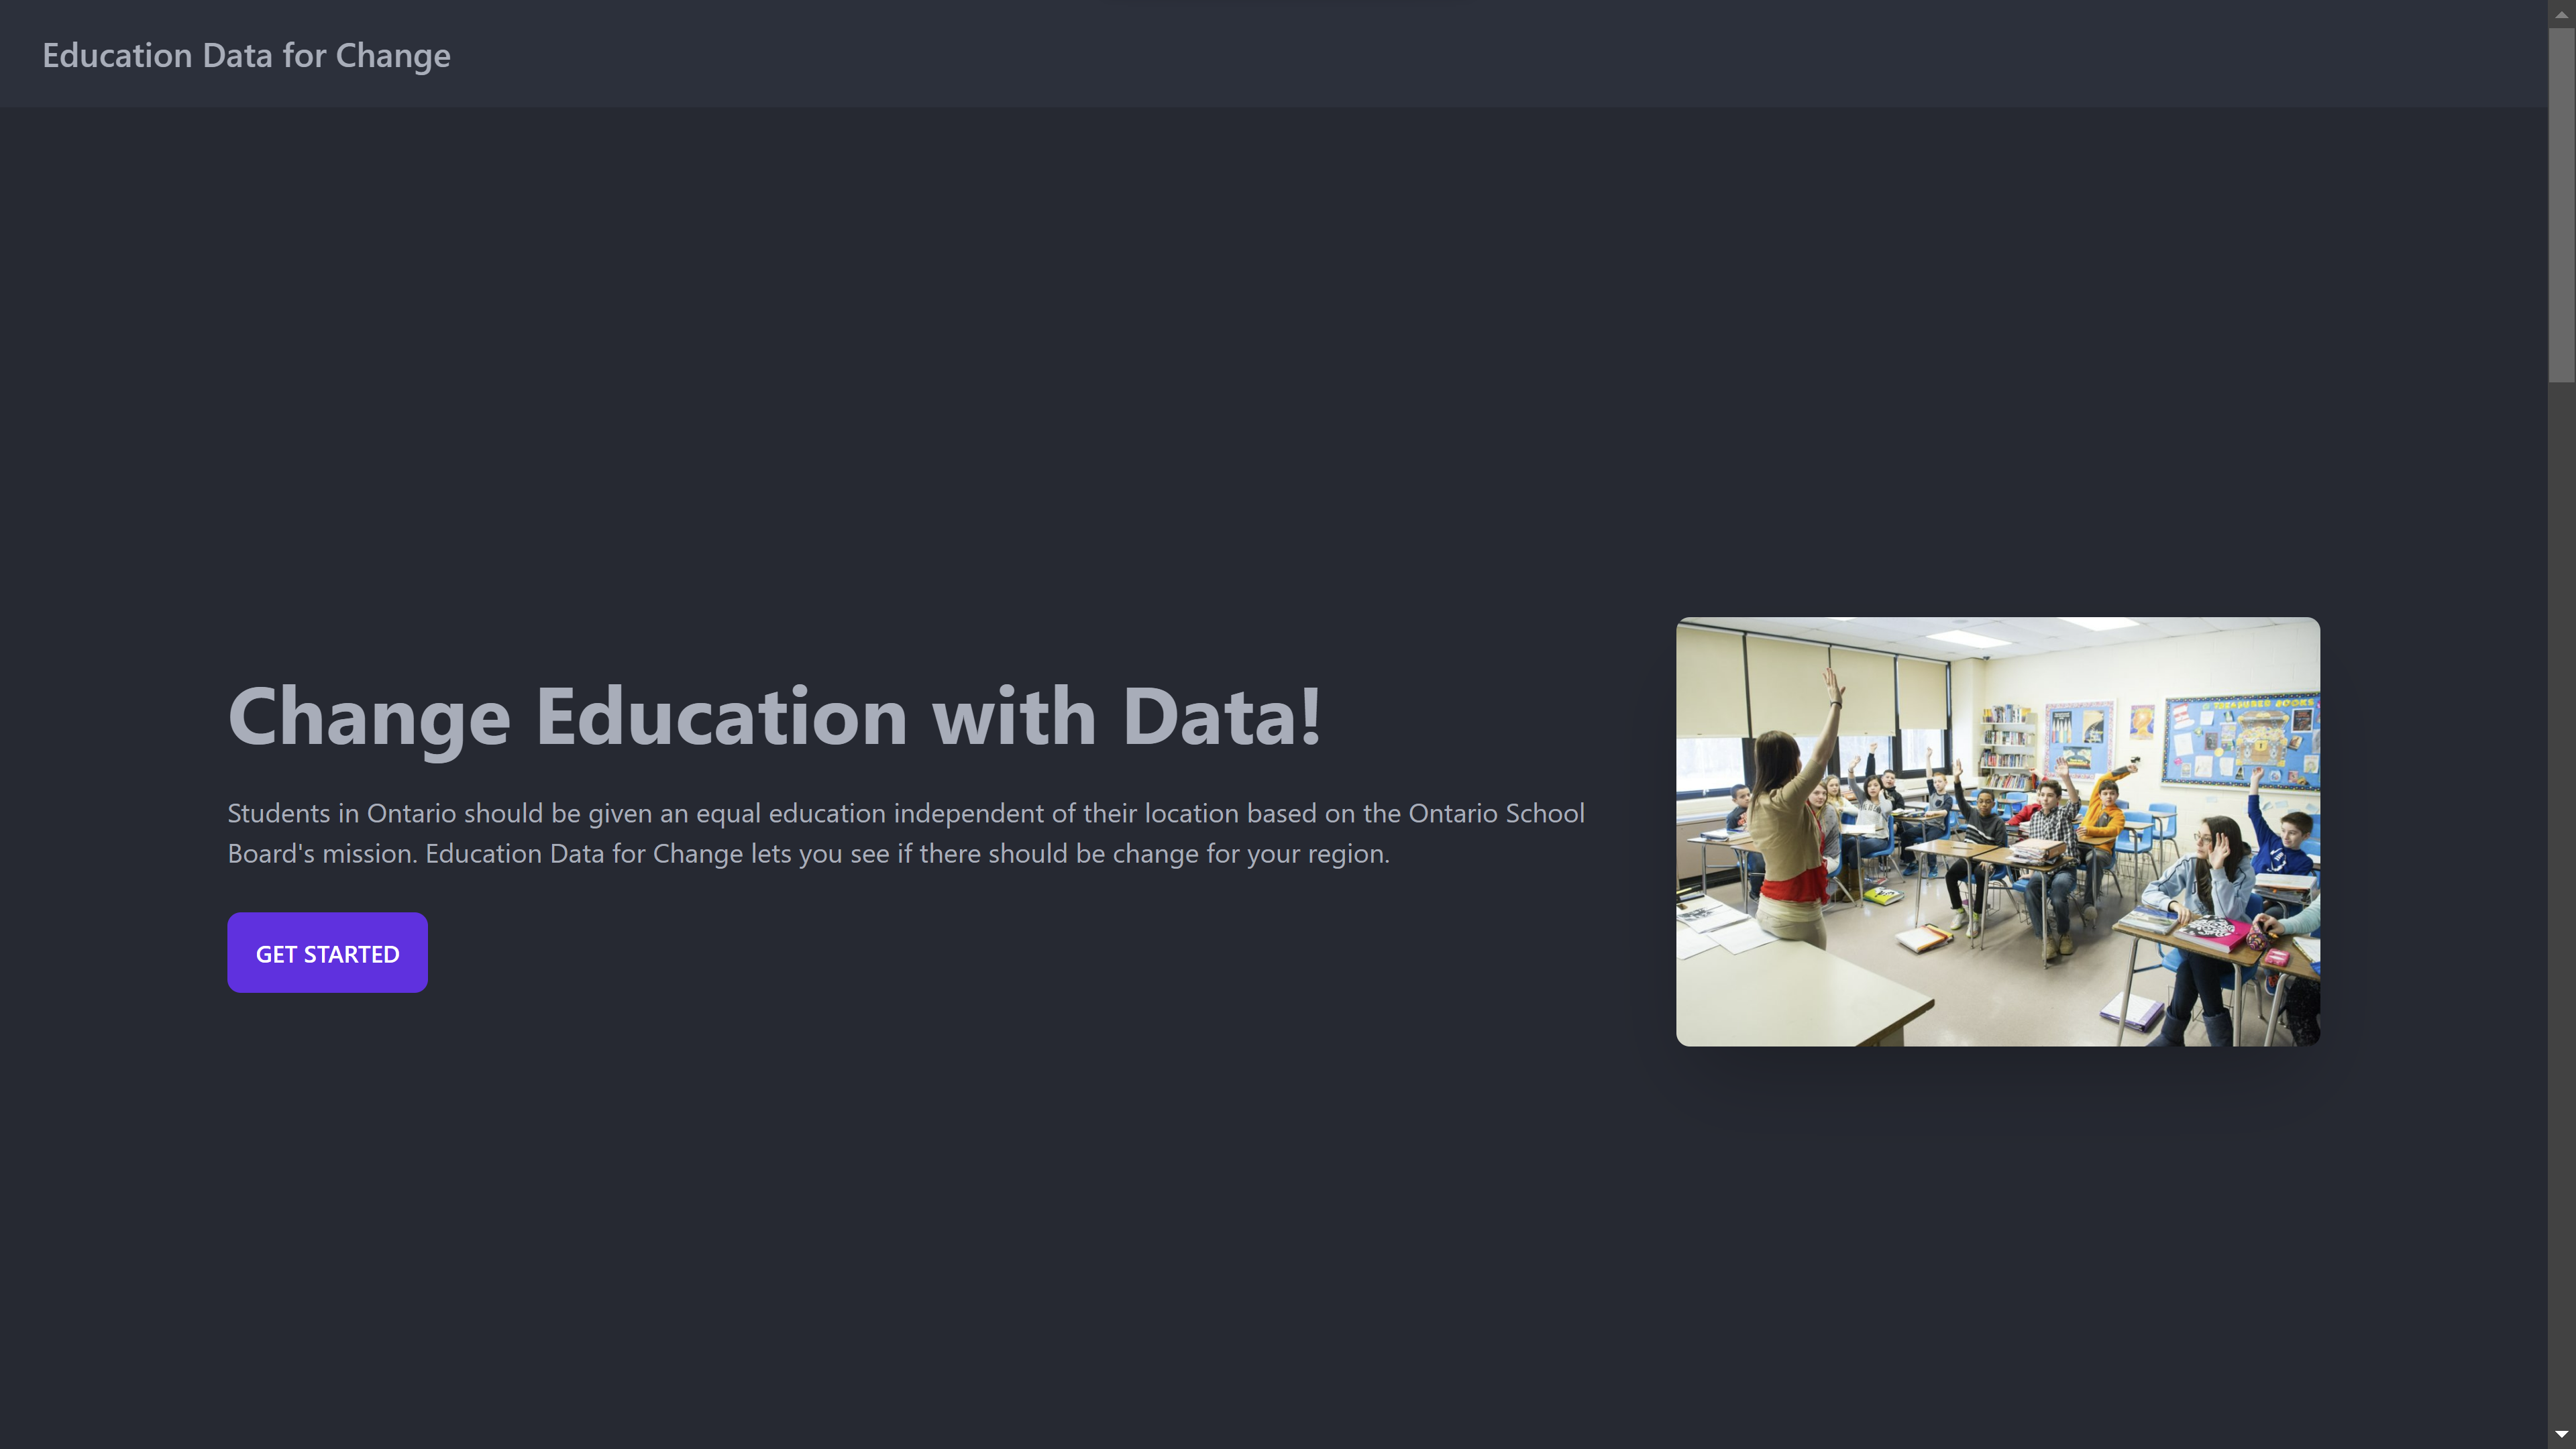
"Education Data for Change"
-
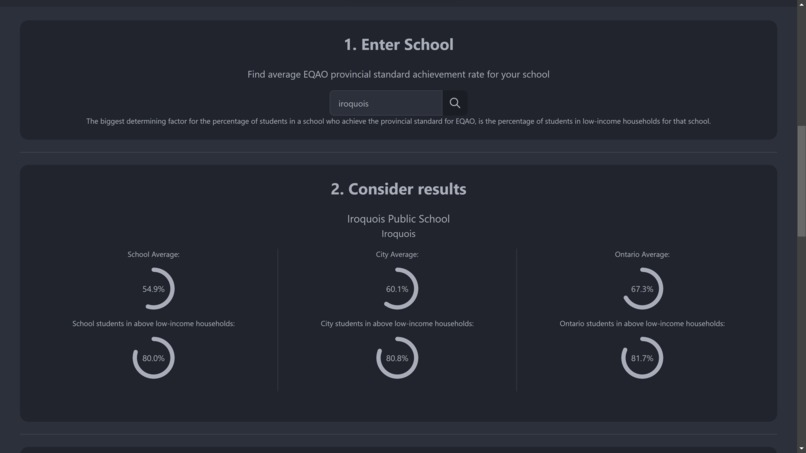
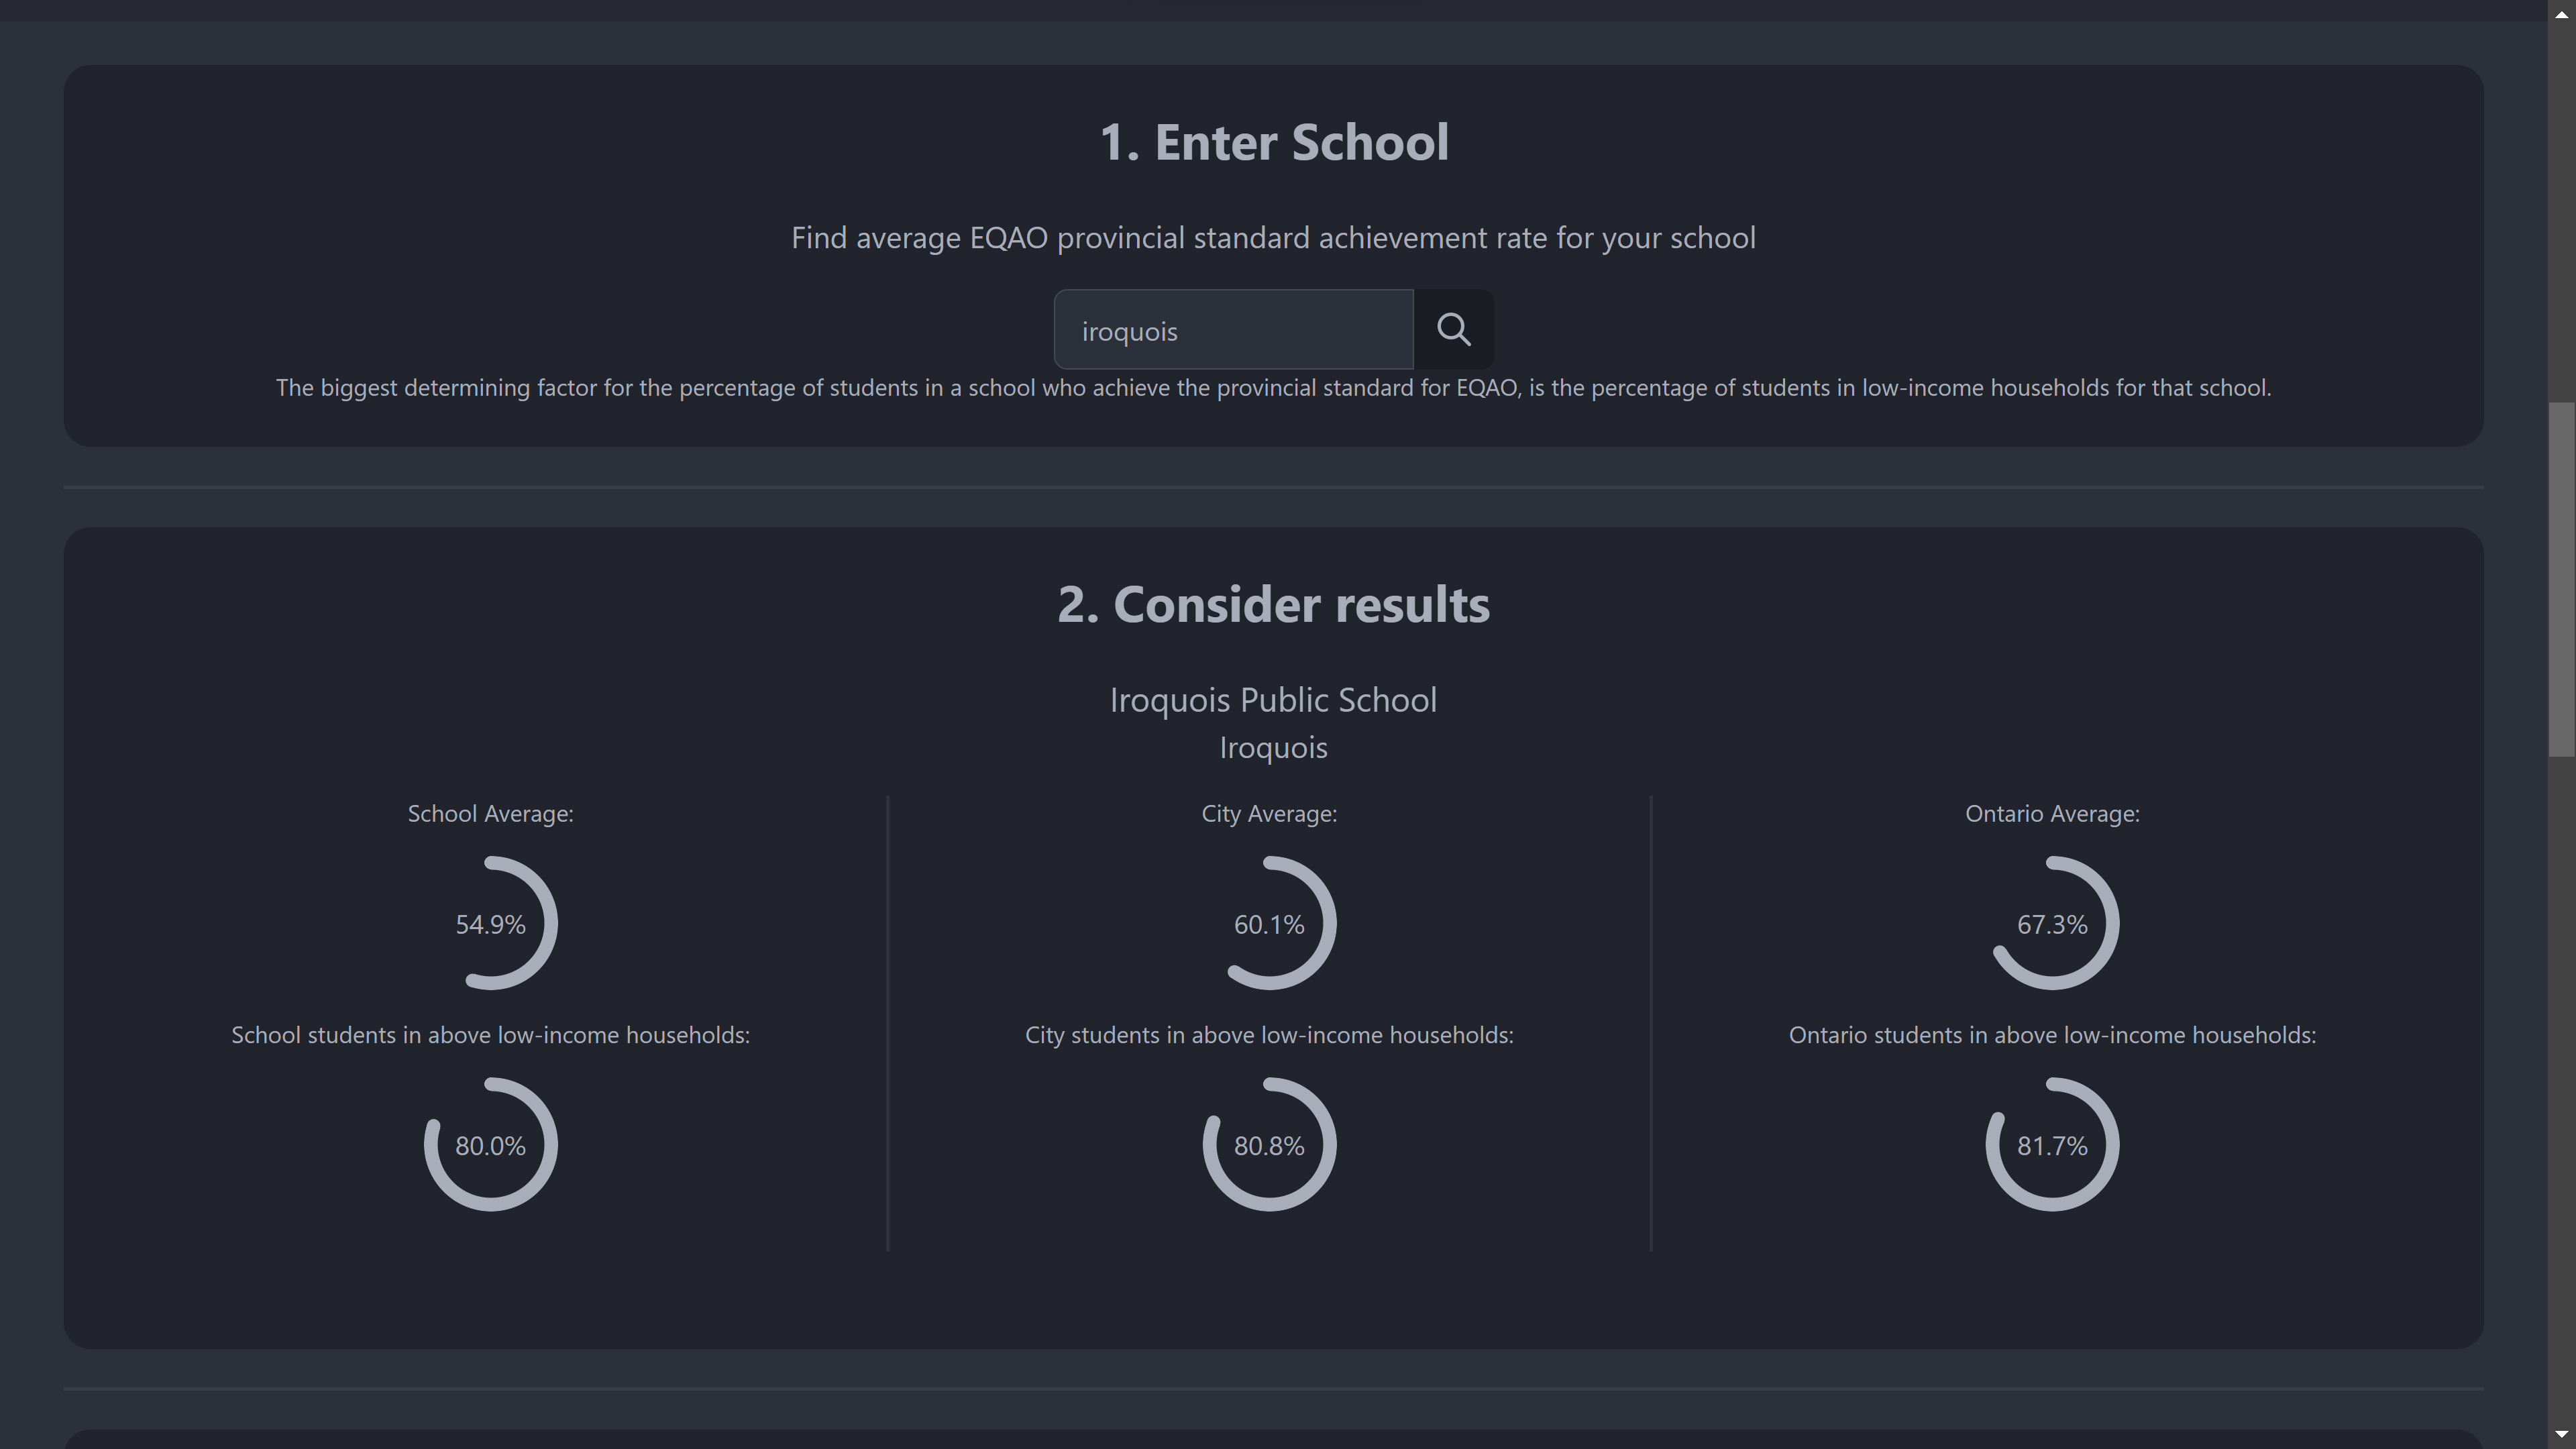
Search for a school!
-
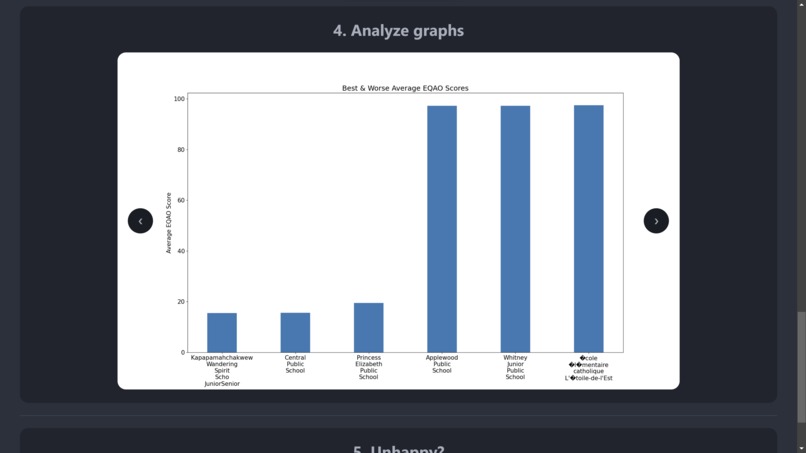
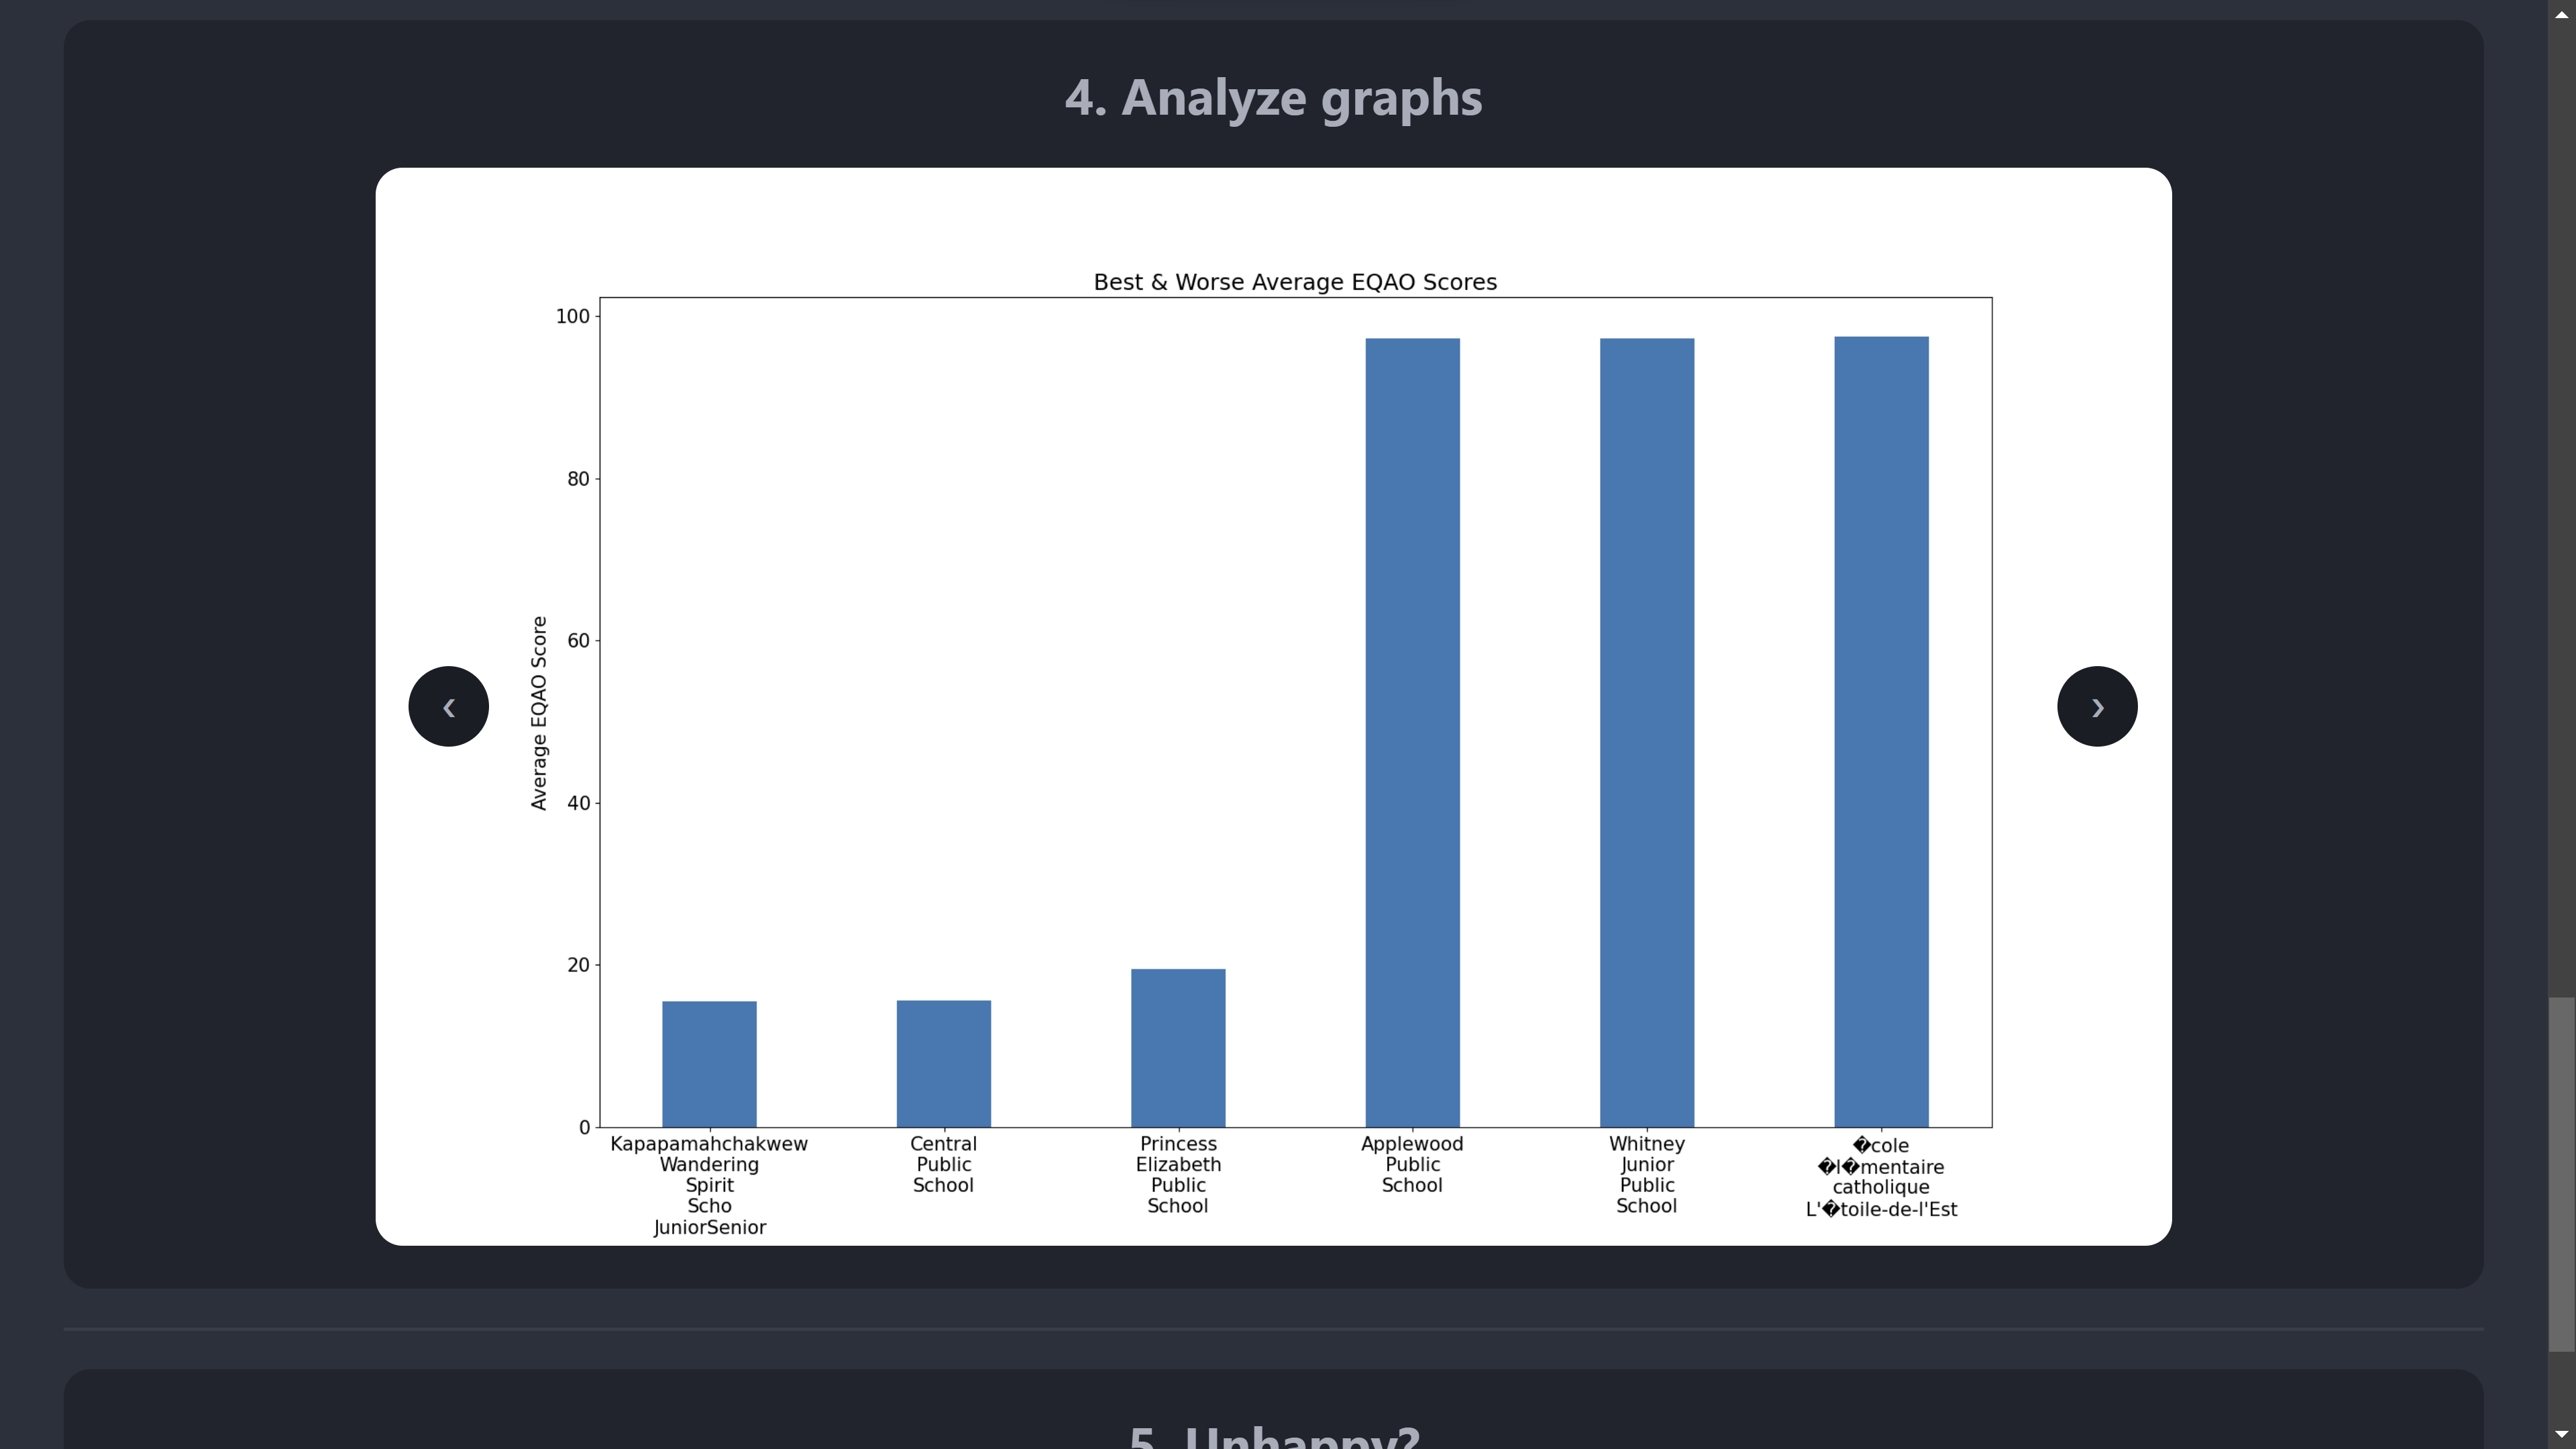
Featuring insightful graphs.
Thank you for checking out our project! You can access the website at https://owengretzinger.github.io/education-data-for-change!
Inspiration
Our insipiration was the "Google Developer Student Club Challenge" where we wanted to tackle the 4th goal: quality education. We then decided we could also compete for the "Best Education Hack" since they were similar. Since we had to use at least one Google tool, we decided to create a web application hosted through Firebase. We would use datasets we found on Ontario's provincial website on Ontario schools' metrics to show which areas in Ontario should be supported more for the benefit of students.
What it does
The app allows users to enter a schools' name and see how well its students are doing. Then, the user is presented with graphs on the school's performance and a map showing nearby schools. This allows users to gather insights on which schools and regions have better educational opportunities than others, in order to make informed decisions on how best to help our schooling systems.
How we built it
We have the main page, index.html, which is styled using daisyUI. It queries into a .csv file we made using Python, and we have a JavaScript file that updates the DOM to bring the page to life. Additionally, SQL was used to query MongoDB in order to gather data for the graphs.
Challenges we ran into
First, we started with Firebase, but switched due to having difficulties in importing the dataset into Firebase's database system and reaching a paywall when trying to send requests to a different database system not hosted on Firebase. So, we spent a lot of time trying out different database hosts and web stacks. We tried MERN and T3, but eventually decided on analyzing the data through Python and importing that into the web page.
Also, we wanted to incorporate a map into the final design, but there weren't many free options. And, if there were, there would be paywalls. One option was to use GeoJSONs or TopoJSONs with react-simple-maps, but the only one available of Ontario was almost 300 MB, which would be impractical.
Accomplishments that we're proud of
We are proud of how much we learned in this Hackathon regarding web development. From just learning about pure HTML, CSS, and JS prior, to learning tech stacks like MERN and T3, it was a very different experience. It was also the first time writing with React.JS and Node.JS.
What's next for Education Data for Change
The next steps for our project would be:
- Finish integrating a map to the site;
- Build the site using the T3 stack; and
- Properly have SQL queries from the user to a database server


Log in or sign up for Devpost to join the conversation.