-
-

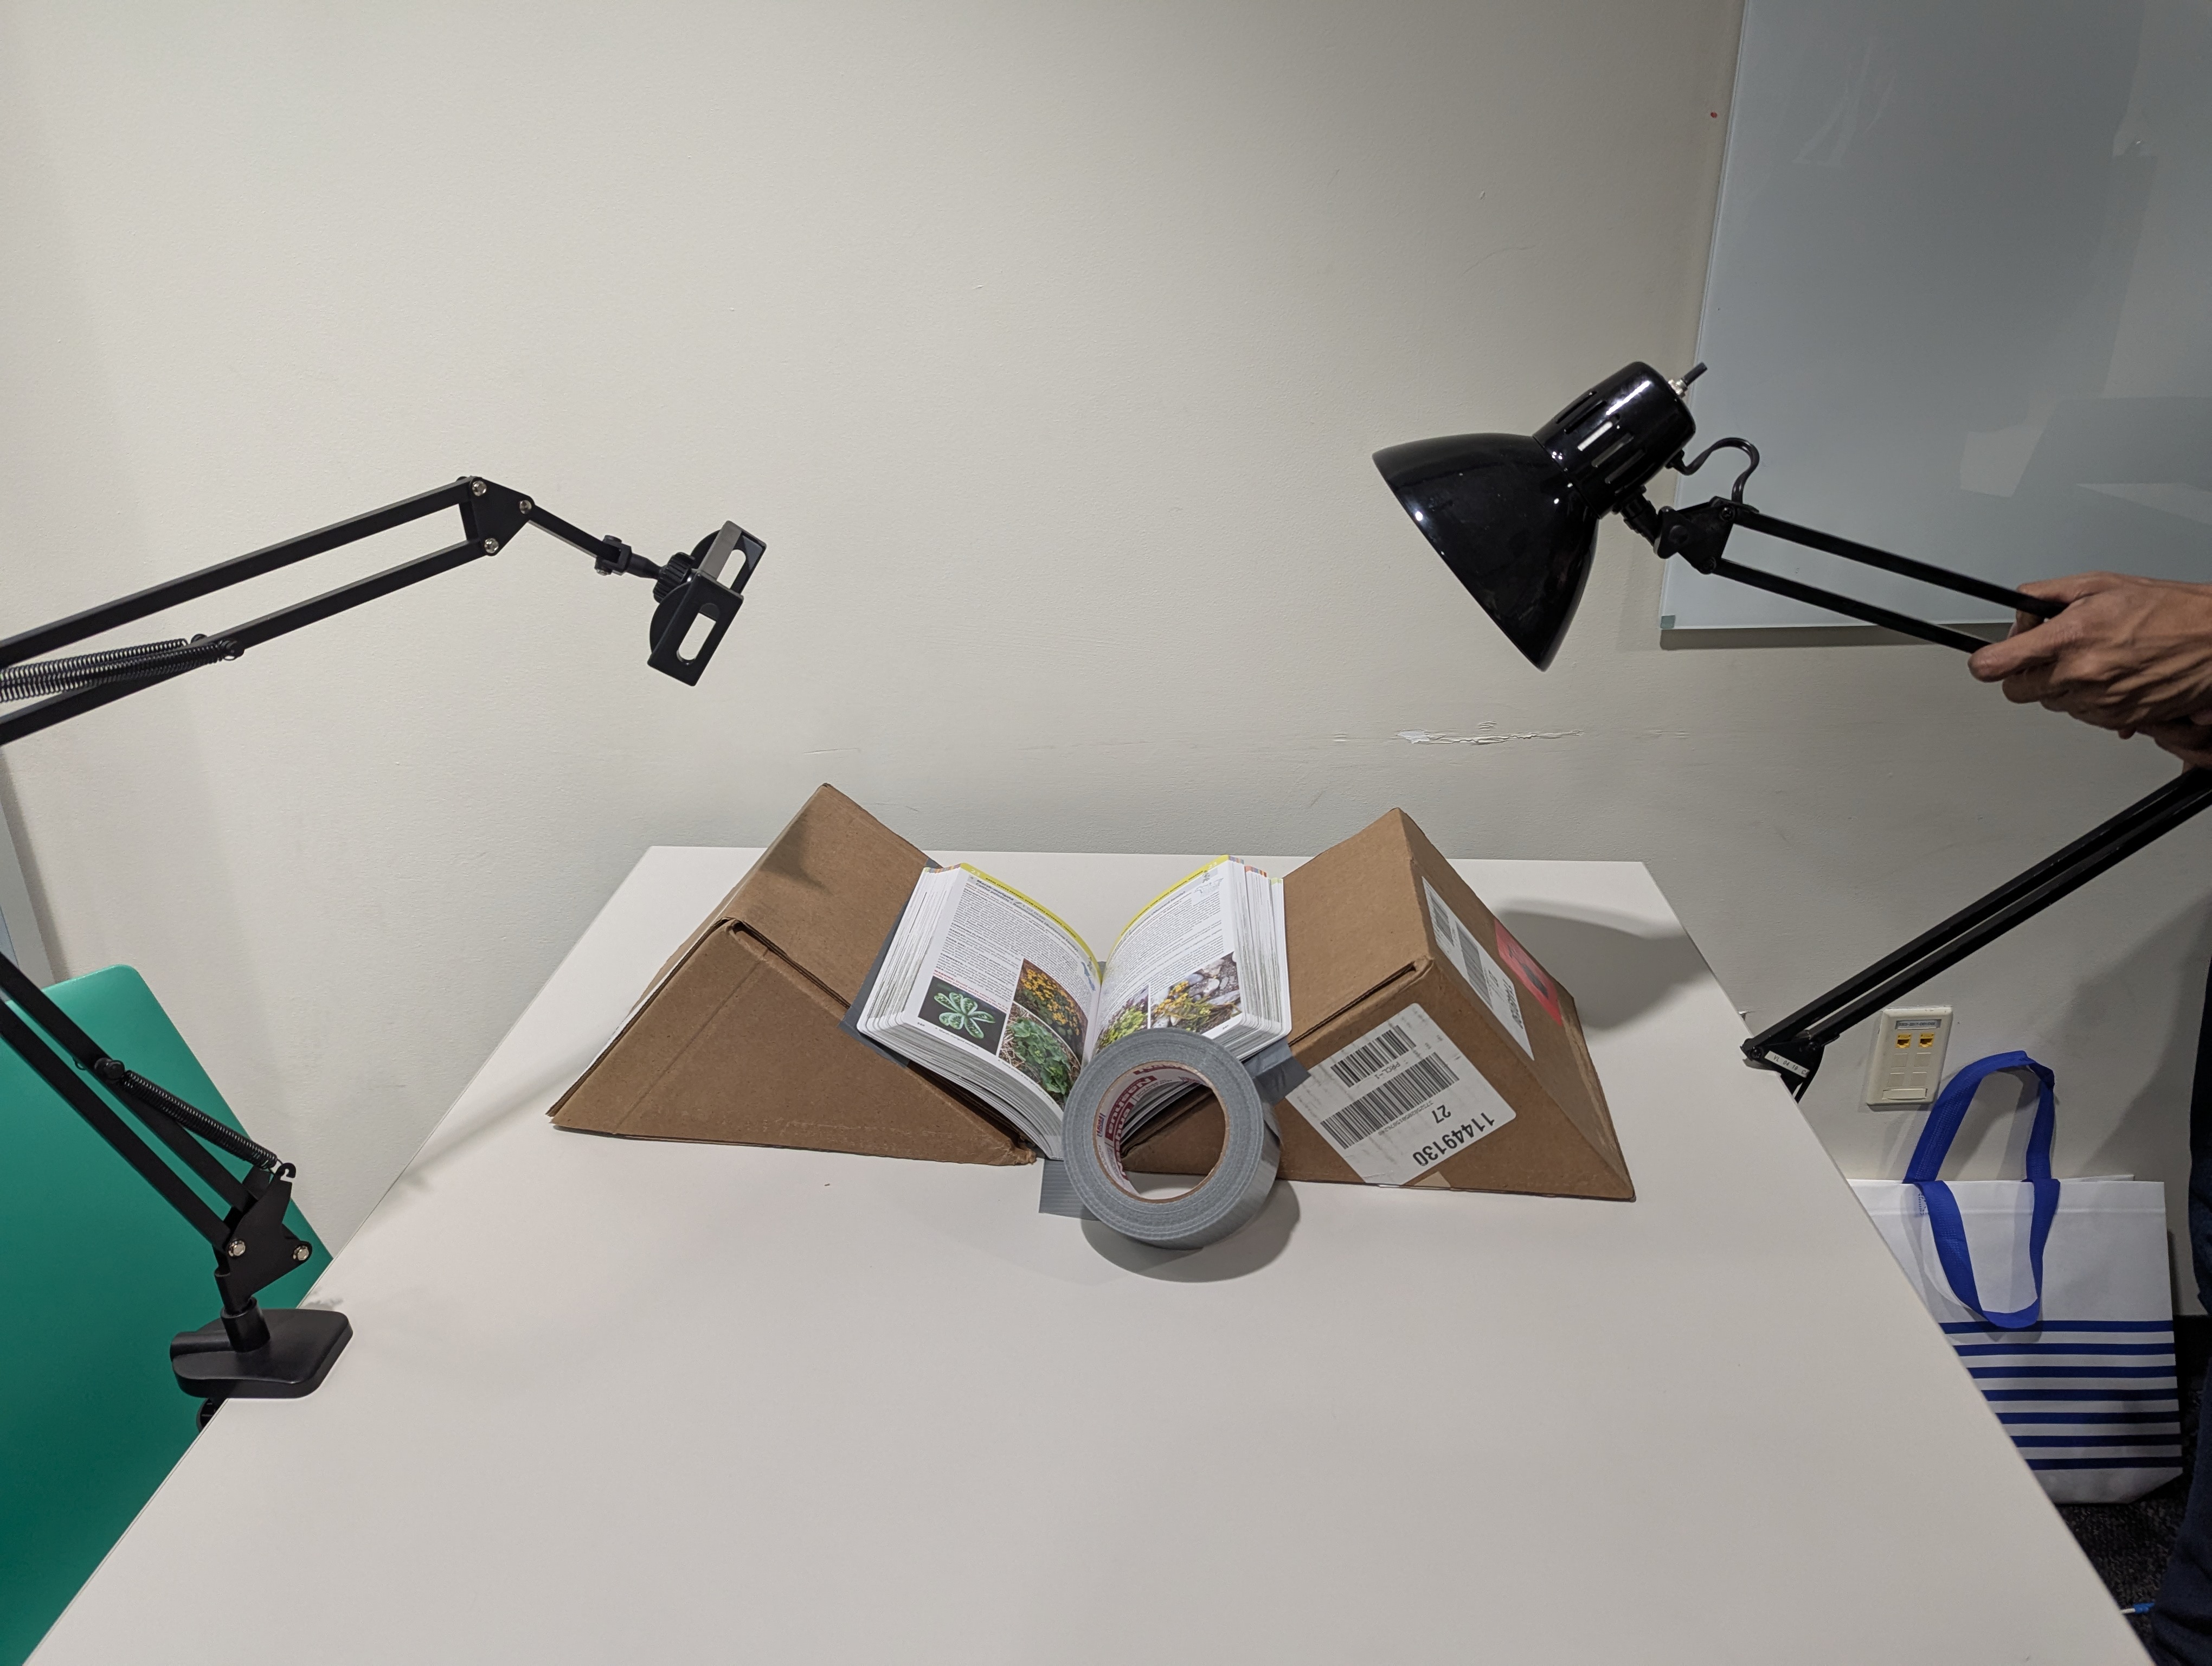
DIY Bookscanner - Scanned nearly 600 pages!
-
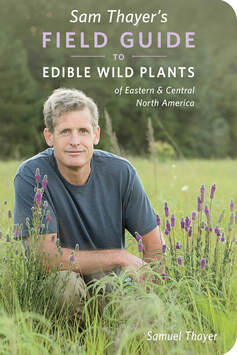
Field Guide that was Scraped for Edible Species/Edible Parts
-
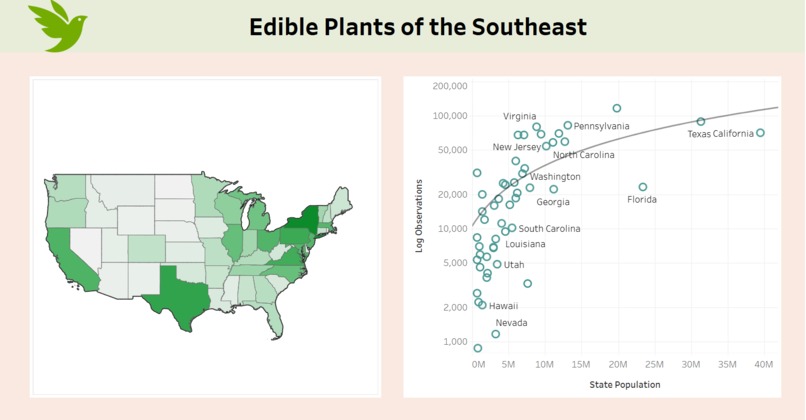
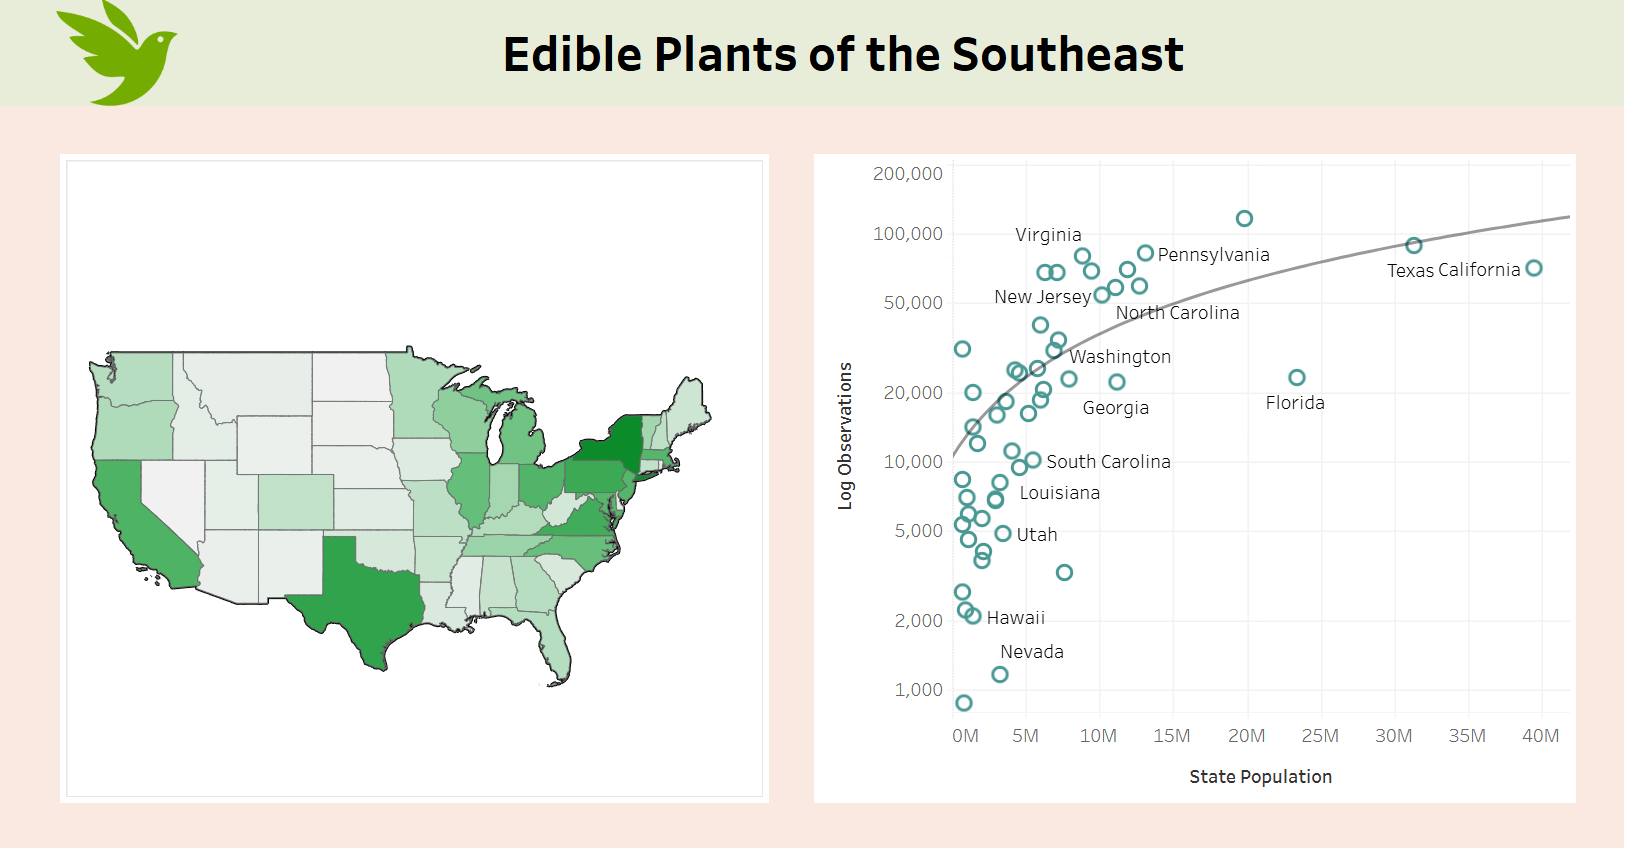
Quick Dashboard showing Observations & Population relationship

Inspiration
Foraging is an enjoyable hobby that focuses attention to small details. In some cases a minute difference of presence or absence of near-microscopic hairs on a stem can mean life or death (poison hemlock and queen anne's lace). Once you learn to identify a specific plant, or mushroom. You start to see them every-where and begin to notice the often overlooked differences. Small details suddenly become magnified. We like to think this attention to the small things carry over in other aspects of life. This is simply an exploratory big-data project revolving around edible plants in hopes of making foraging more accessible.
What it does
A near 18-million row dataset consisting of edible plant observations. Each row consists of an human-observation of a species, a link to i'ts specific photo, its GPS coordinates, and information about what parts are edible, and what time of year the plant can be harvested. This dataset is to be further enriched via reverse-geocoding to assign a precise county/state with each observation. This reveals interesting relationships about the exponential growth of observations and population, and potential opportunity for Impoverished communities or food desert classified communities, and could potentially provide resources to subsidize snacks or meals via foraging.
The end product is to be an interactive Dashboard of the edible species of the USA.
How we built it
Recently a new foraging field guide by forager legend Sam Thayer was released. This physical book contains over 600 edible plant species. This physical book was digitally scanned by my scrappy DIY book scanner (see picture), and post processed with assistance of AWS OCR technology, and further cleaned tricky visual artifacts with the help of LLM's. This cleaned data was then sent off to GBIF API , a ecological database housing research-grade observations of birds,fish,fossils,plants,etc... Further enrichment was done in PostgresSQL/PostGIS by reverse geocoding (KNN algorithms) into USA census tracts to obtain county and state classifications for each observation. The resulting dataset is topping just over 18 million rows with over 600 unique edible plant species in all 50 states. Yes
Further census data on SNAP benefits and poverty rates were appended.
Technology Involved
AWS - EC2, RDS (Postgres), S3 PostGIS, shp2pgsq DBT - Data Build Tool Python - pandas, boto3 Census.gov & Food Access Research Atlas ScanTailor (Raw book images pre-processing)
Challenges we ran into
Manually scanned 575 pages from field guide! This really hurts the hands, but was relatively quick - clocking in around 2 hours. These scanned pages are imperfect and had quite a bit of pre/post processing to format Species/Edible parts - even before handing it off to LLM's. Cloud platforms were new to me, I had extreme trouble uploading CSV's into cloud PostgresSQL tables. (Tried both AWS and Google Cloud) LLM's helped out on non-script suitable text-cleaning!
Accomplishments that we're proud of
Quality and scale of the data. Learning AWS quickly
What we learned
Cloud platforms are sometimes very fast, other times very slow due to all the permission/policies/services required & lack of clear documentation.
What's next for Edible Plants of the Southeast
Investigating Seasonal availability of each species. We hypothesize that fall is the time of most food availability - due to nut bearing keystone species such as Oaks, Hickories, etc... We are curious what foraging activities communities would be interested in participating in - even if for just 1 day a month.
Built With
- amazon-web-services
- data-build-tool
- dbt
- gbif
- gis
- inaturalist
- mistral-7b
- ocr-web-service
- postgis
- postgresql
- python

Log in or sign up for Devpost to join the conversation.