Inspiration
Inspired by the difficulty and repetitive nature of hardware debug, I wanted a way to turn “try random things until it works” into a structured loop with evidence. Hardware issues are often timing-sensitive, hard to reproduce, and expensive to diagnose when your only feedback is vague logs. EdgeCase is our attempt to make debugging feel more like running experiments: capture ground truth, propose the next best test, and converge on a fix.
To make that loop fast enough to be practical, we run multiple specialized agents locally on an NVIDIA DGX Spark, so planning, critique, and next-step generation can happen in parallel without waiting on cloud services.
What it does
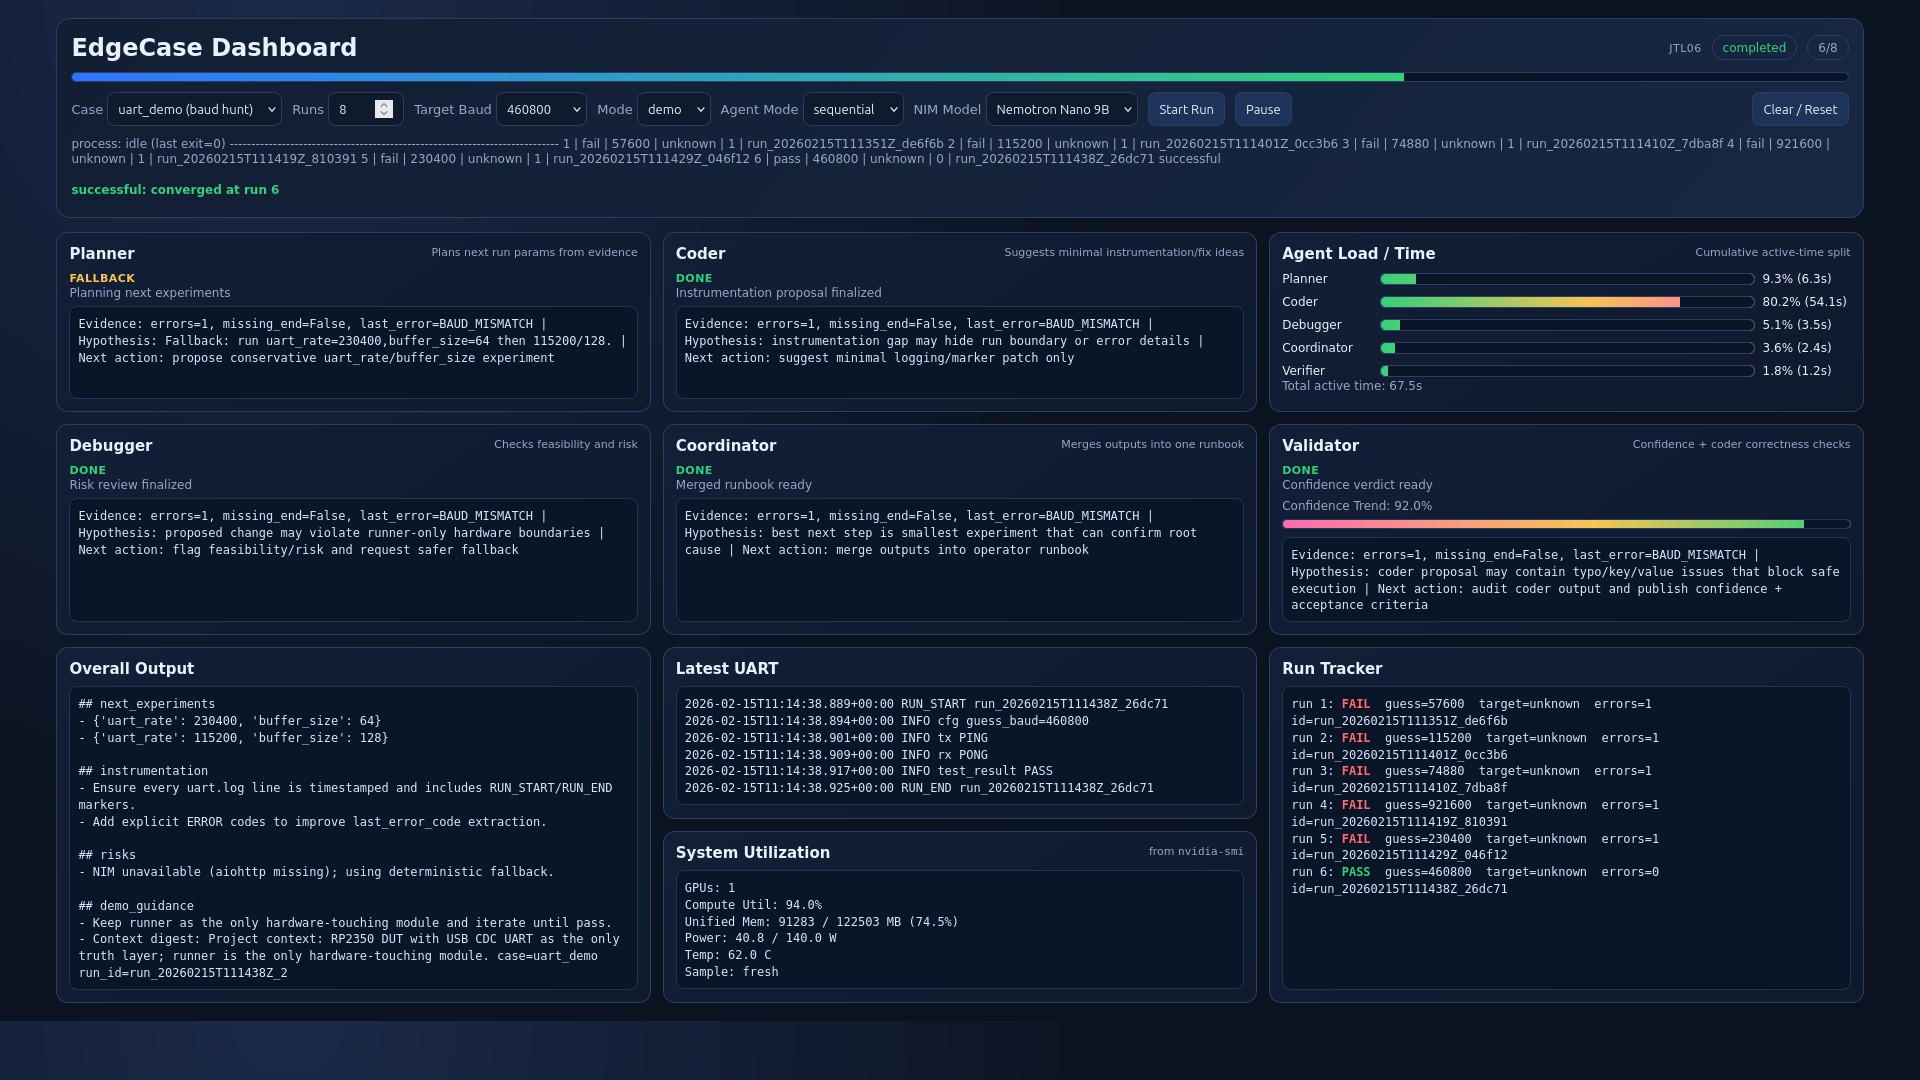
EdgeCase turns hardware debugging into a closed-loop experiment using NVIDIA NIM and Nemotron foundational models running locally on a DGX Spark. Multiple agents:
- build and flash RP2350 firmware,
- capture UART output and logic-analyzer traces (the “truth layer”),
- extract metrics (drops, timing gaps, framing errors, missing markers),
- propose the next experiments (parameter sweeps, decode settings, instrumentation tweaks),
- and iterate until the fix is validated by evidence.
For the demo, EdgeCase can solve a real-world bring-up problem interactively: the user picks a nonstandard UART baud rate (e.g., 76200), and the agents automatically test decode settings until the UART stream decodes correctly and passes validation checks.
How we built it
- Compute + models (all local): NVIDIA DGX Spark running Ubuntu 24.04, hosting a single local NIM endpoint for Nemotron Nano 9B v2 (OpenAI-compatible API). All agent calls go to the same local endpoint.
- Hardware-in-the-loop runner: a Runner service that is the only component allowed to touch hardware:
- runs
maketo build firmware, - flashes the RP2350 (UF2 / picotool / OpenOCD auto-detect),
- captures USB CDC logs,
- triggers Saleae Logic 2 automation to capture and export traces + UART decode.
- runs
- Multi-agent orchestration (local fan-out/converge): four agents (planner, coder, critic, summarizer) run concurrently on the DGX Spark for fast iteration, then converge into a single actionable run plan.
- Evidence bundles: every run produces a reproducible artifact bundle (logs, traces, metrics, and a triage note) so debugging decisions are always backed by data.
Challenges we ran into
- Flashing reliability: making firmware flashing deterministic across different boot states and toolchains (mass-storage UF2 vs picotool vs OpenOCD).
- Truth vs telemetry: USB CDC logs can hide physical-layer issues; the logic analyzer is the ground truth, but automating capture and exports robustly takes care.
- Reproducibility: turning a flaky symptom into a repeatable experiment required better instrumentation (markers like
RUN_START/ERROR/RUN_ENDand GPIO triggers). - Agent safety: ensuring agents propose changes without directly touching hardware or running arbitrary shell commands outside the Runner boundary.
Accomplishments that we're proud of
- A working closed-loop workflow where “debug” becomes a sequence of experiments with saved evidence, not guesswork.
- A multi-agent system running locally that proposes targeted next runs and converges quickly, rather than brute-forcing everything.
- A demo-friendly interactive scenario (UART baud discovery) that feels like real hardware bring-up and has an obvious visual win when decoding locks in.
- A clean boundary design: hardware access is isolated to a single Runner, making the system safer and more reliable.
What we learned
- Hardware debugging gets dramatically easier when you treat the logic analyzer as the source of truth and structure everything around measurable signals.
- The biggest productivity boost isn’t one perfect AI answer, it’s a loop: hypothesis → experiment → evidence → next experiment.
- Good instrumentation beats clever reasoning. Simple markers, triggers, and checksums make automation possible.
- Concurrency and specialization help: planner/coder/critic roles catch different failure modes and reduce blind spots.
What's next for EdgeCase
- Expand beyond UART into SPI/I2C protocol debugging (including automated decoder selection and timing-violation detection).
- Add a lightweight UI dashboard to browse runs, compare traces, and visualize clusters of failures over time.
- Add bisect mode across firmware changes to automatically localize regressions.
- Support more hardware targets and capture backends (sigrok, other logic analyzers) while keeping the same evidence-bundle format.
- Turn the demo problems into a library of reproducible debug challenges (baud/framing/inversion/drops/timing races).
Built With
- c/c++
- dgx
- nemotron
- openocd
- python

Log in or sign up for Devpost to join the conversation.