-
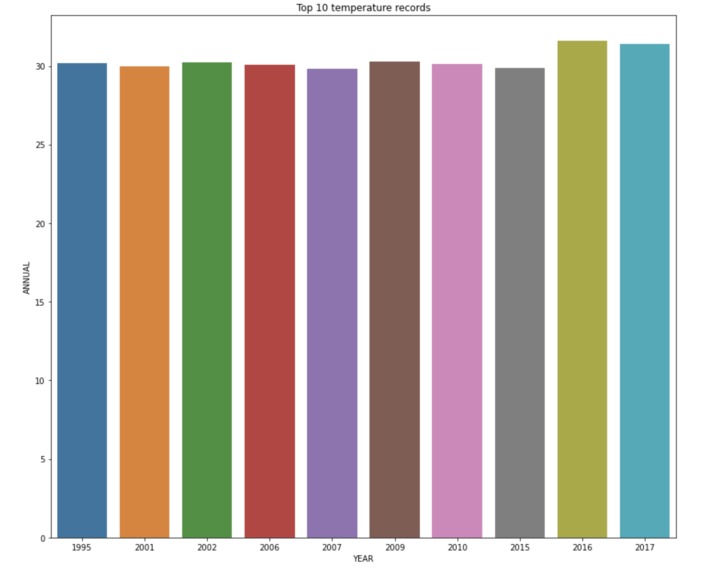
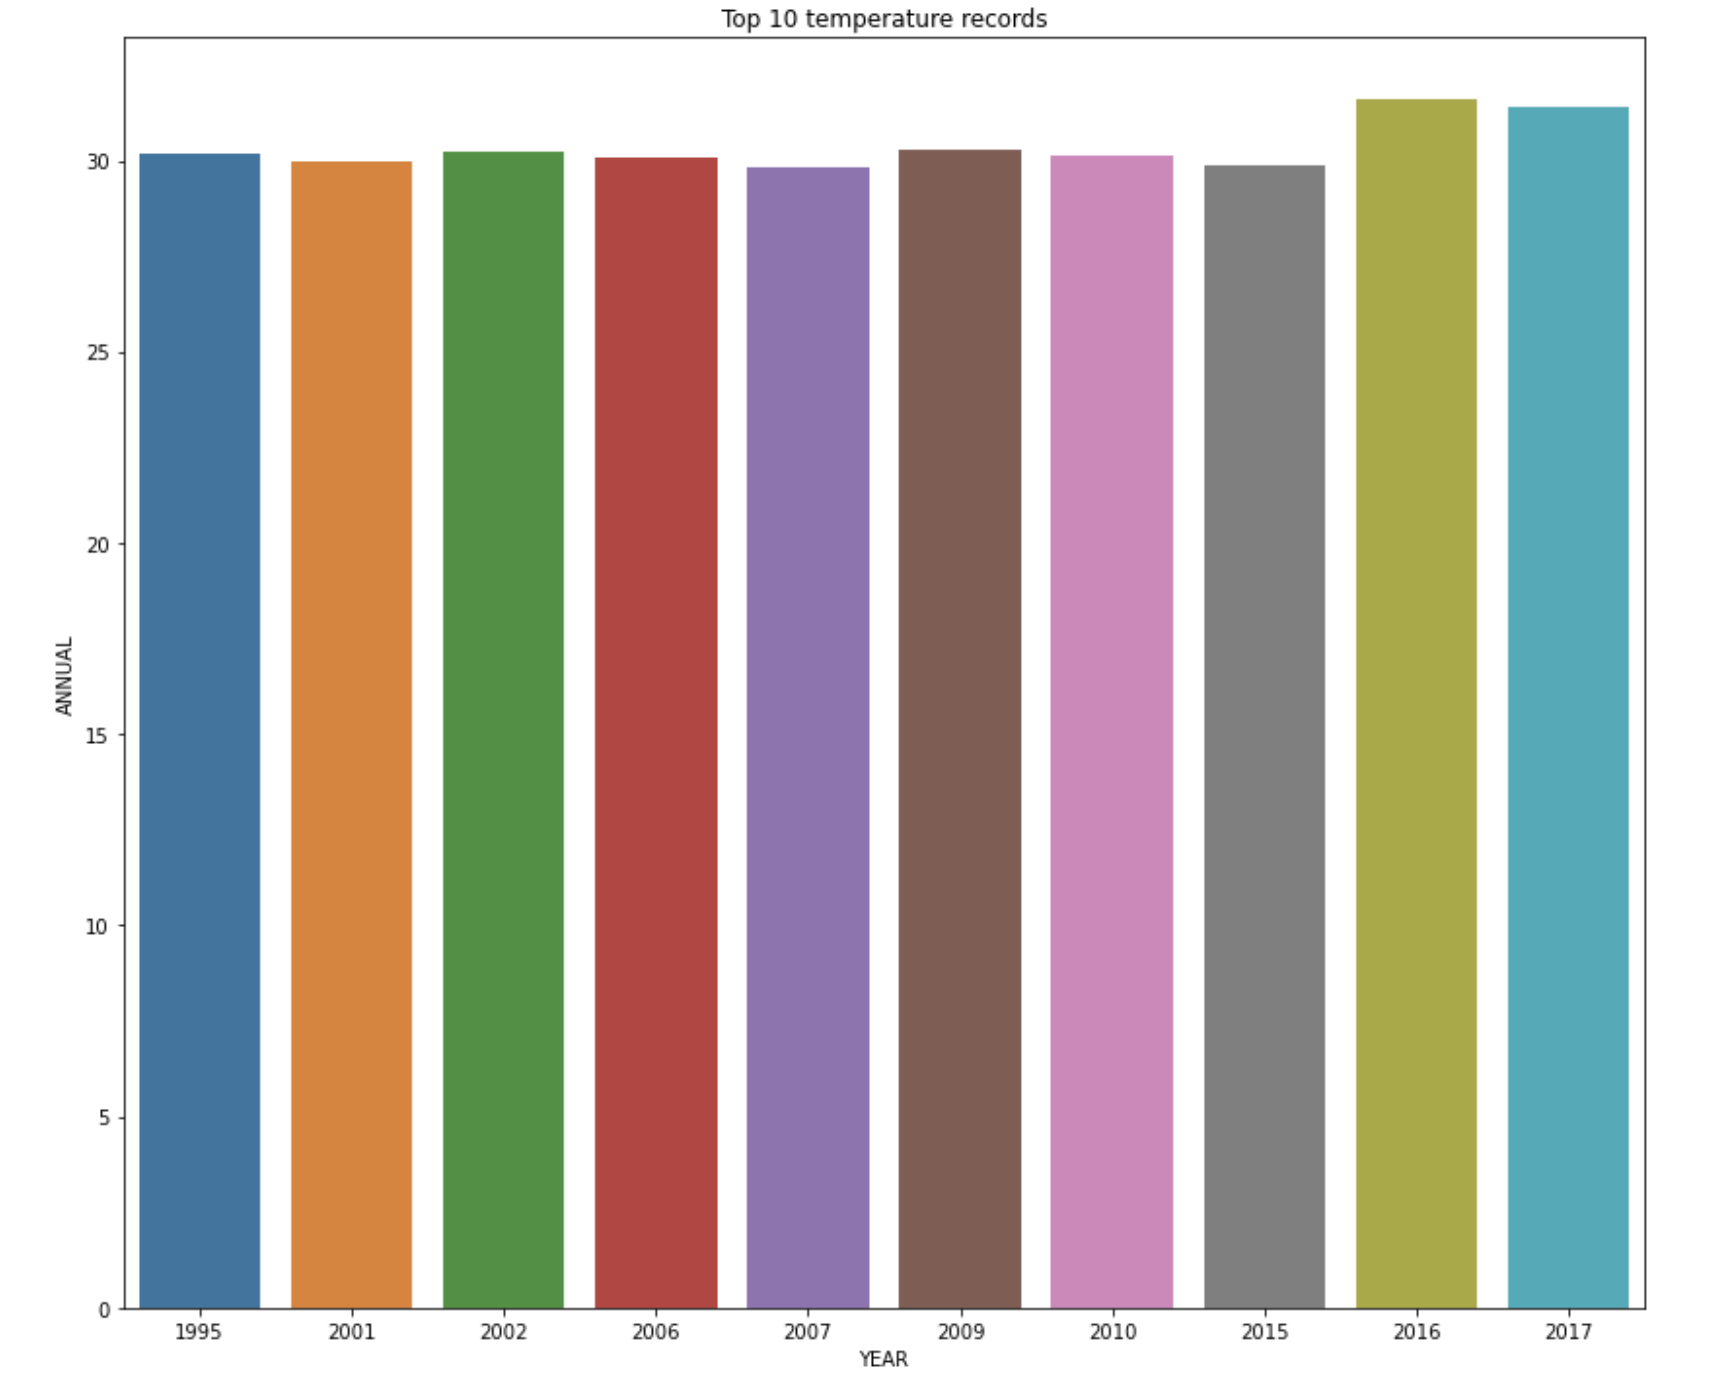
Top 10 temperature records of India
Inspiration
To find insights from historical temperature data of India.
What it does
The dataset contains temperature of India from 1901 - 2017 The main findings of this visualization are
- Identify which year has the highest record
- Identify the highest temeperature which has recorded
- Identify which month recorded that score
How we built it
The EDA process was built by using. the following tools It is built using 1.Python 2.Pandas 3.Matplotlib 4.Seaborn
Accomplishments that we're proud of
It was interesting to find deeper insights while digging deep into the data.
What's next for EDA of temperature of India
Next to find statewise data to find which state contributed that highest temperature.

Log in or sign up for Devpost to join the conversation.