-
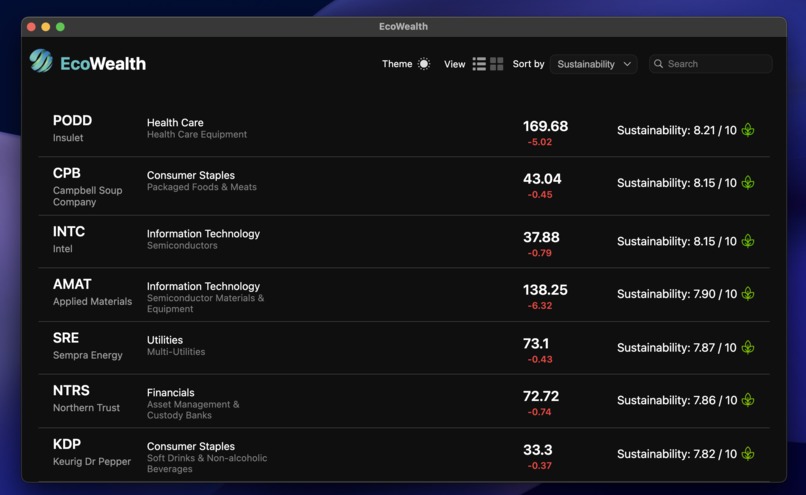
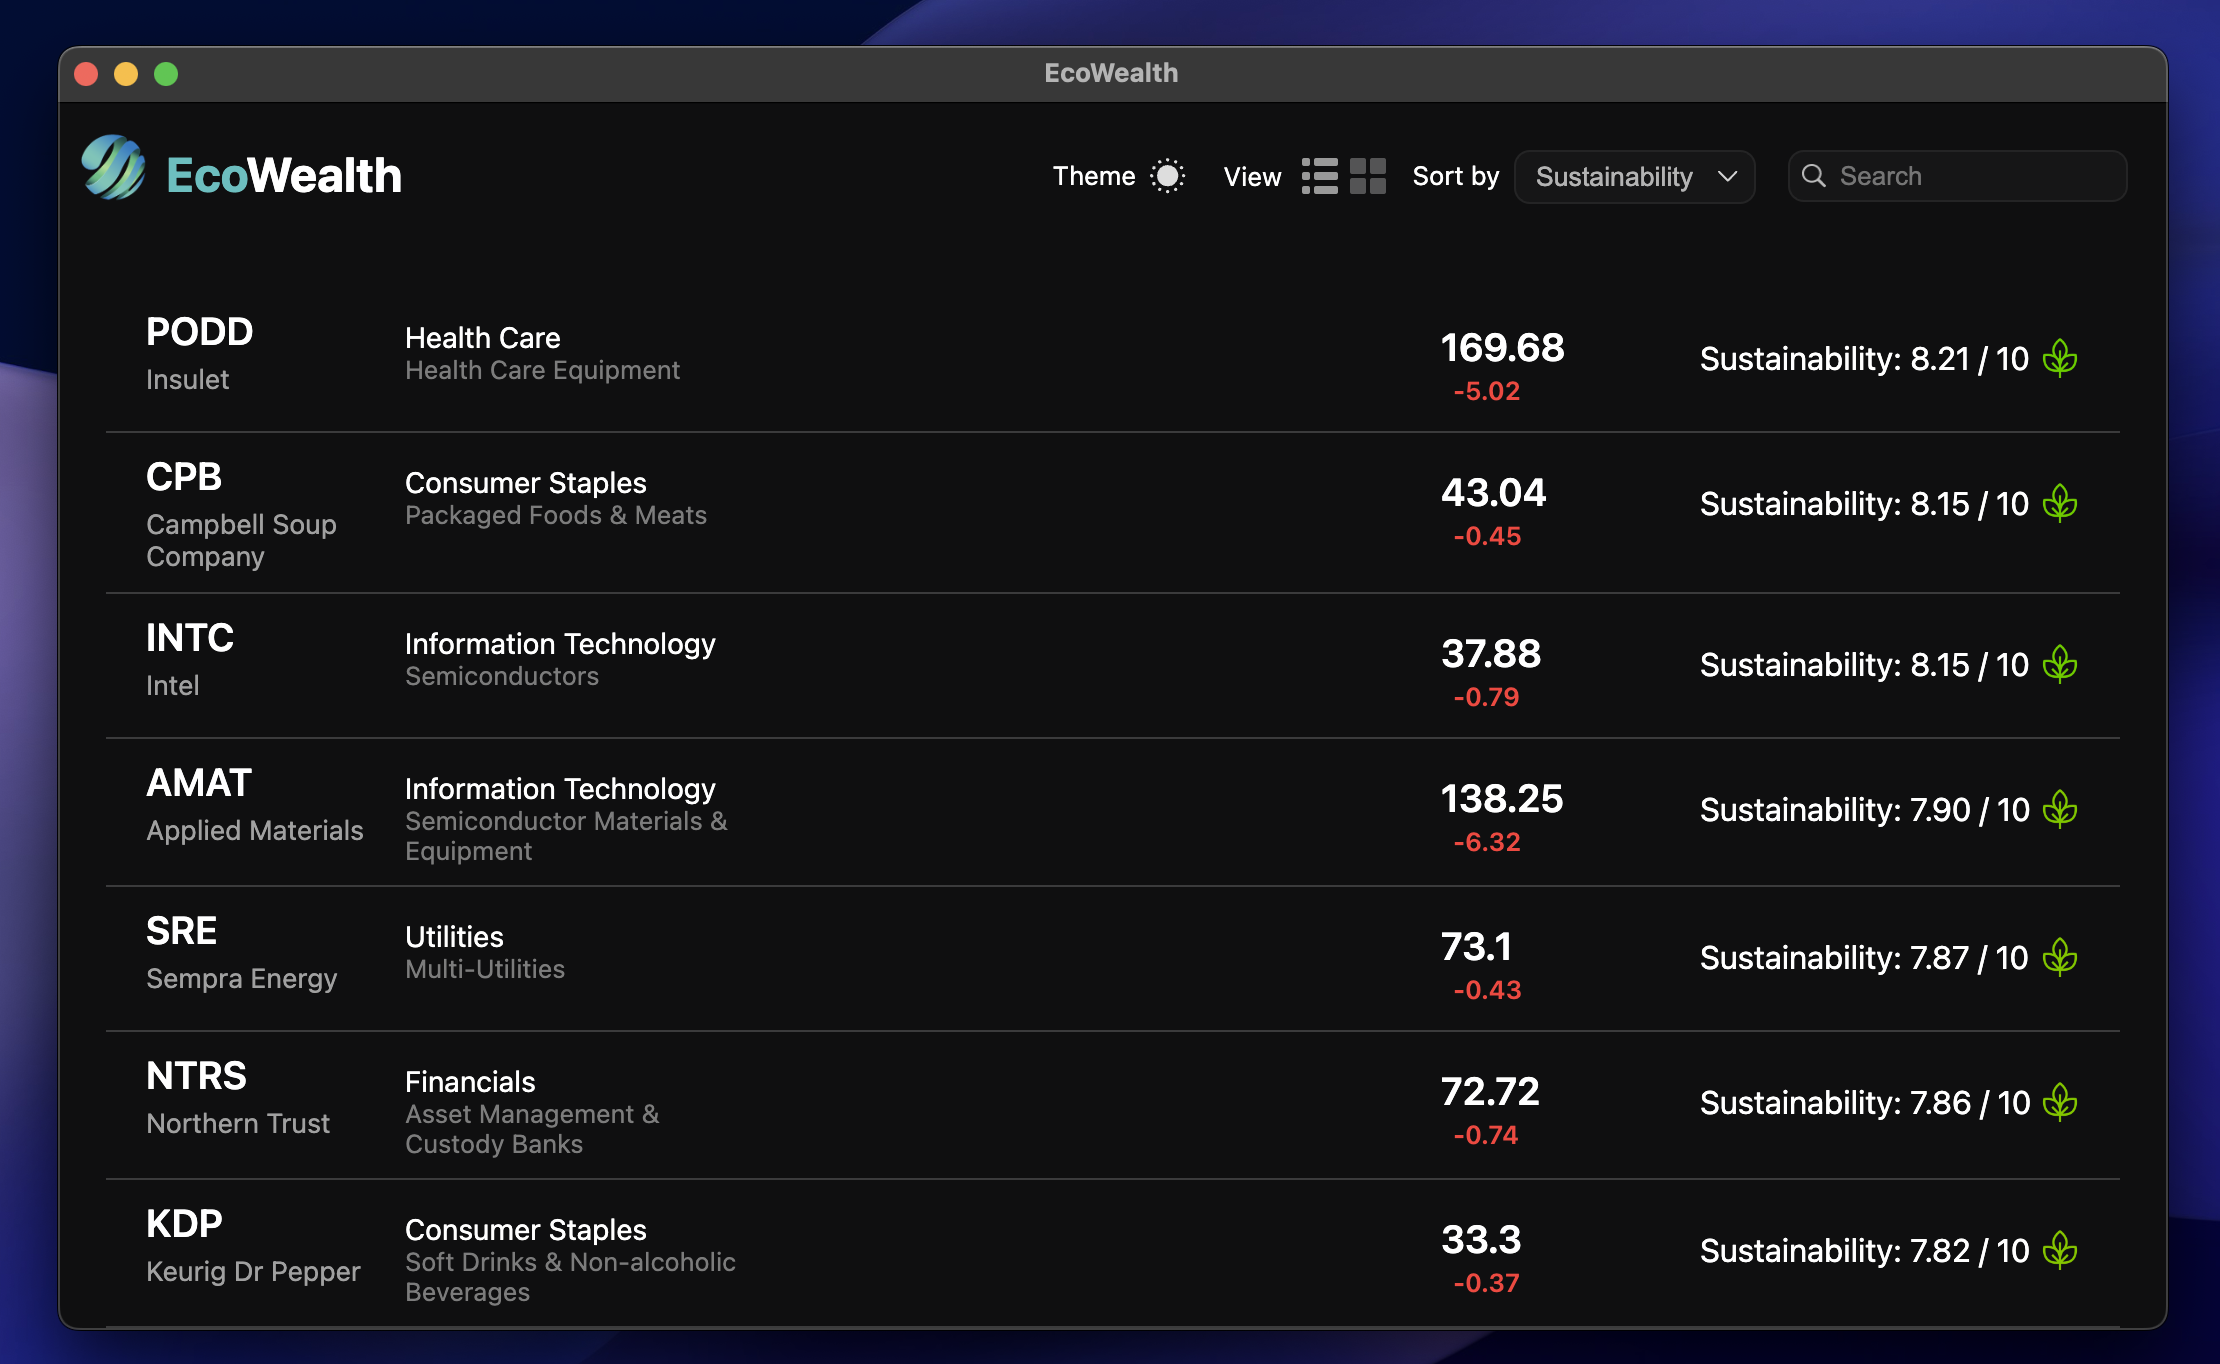
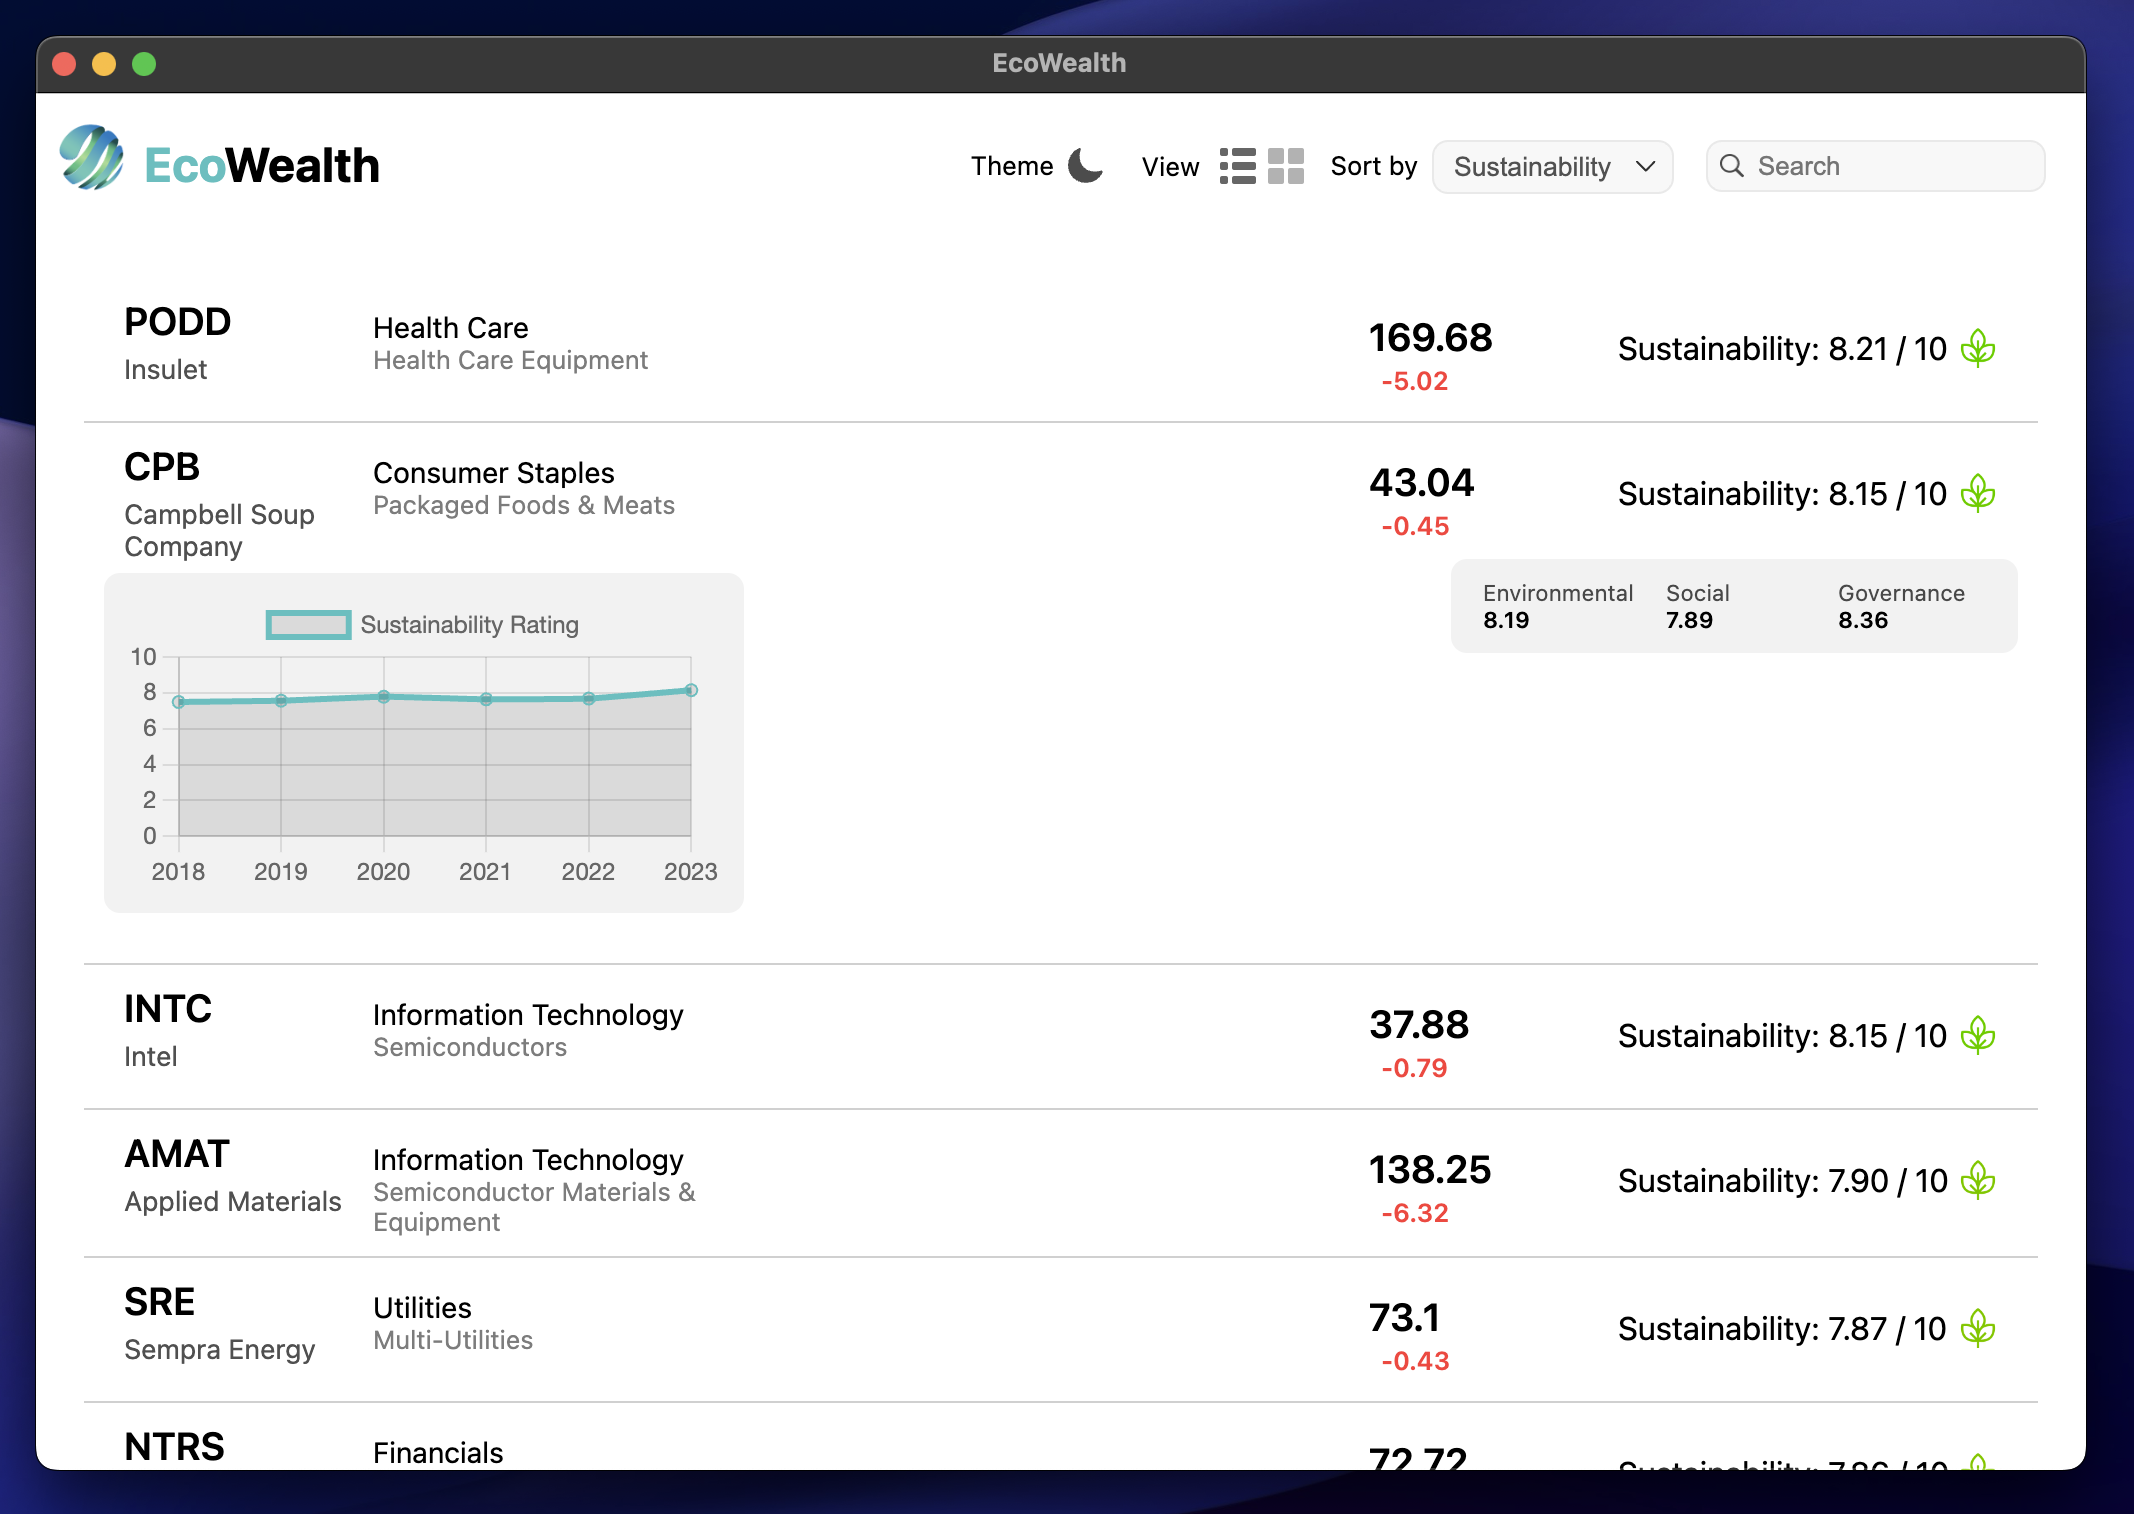
View all S&P500 stock data in real-time with our own sustainability rating for each stock
-
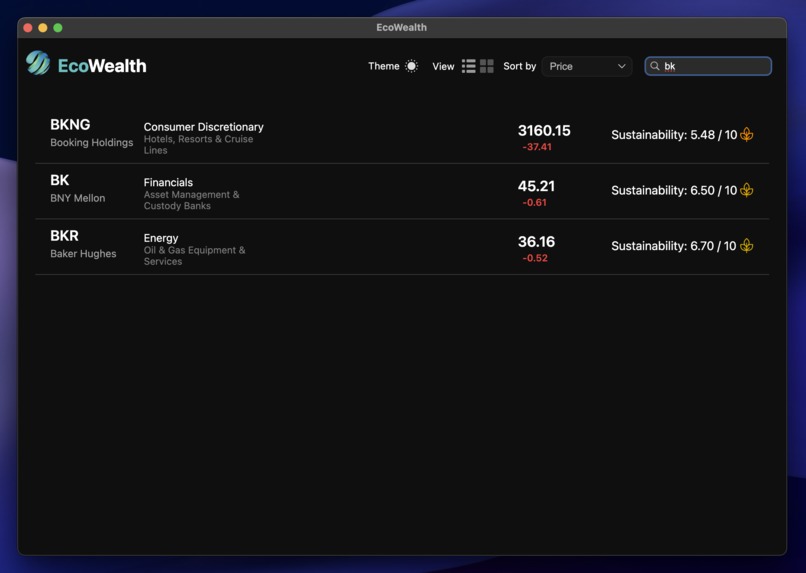
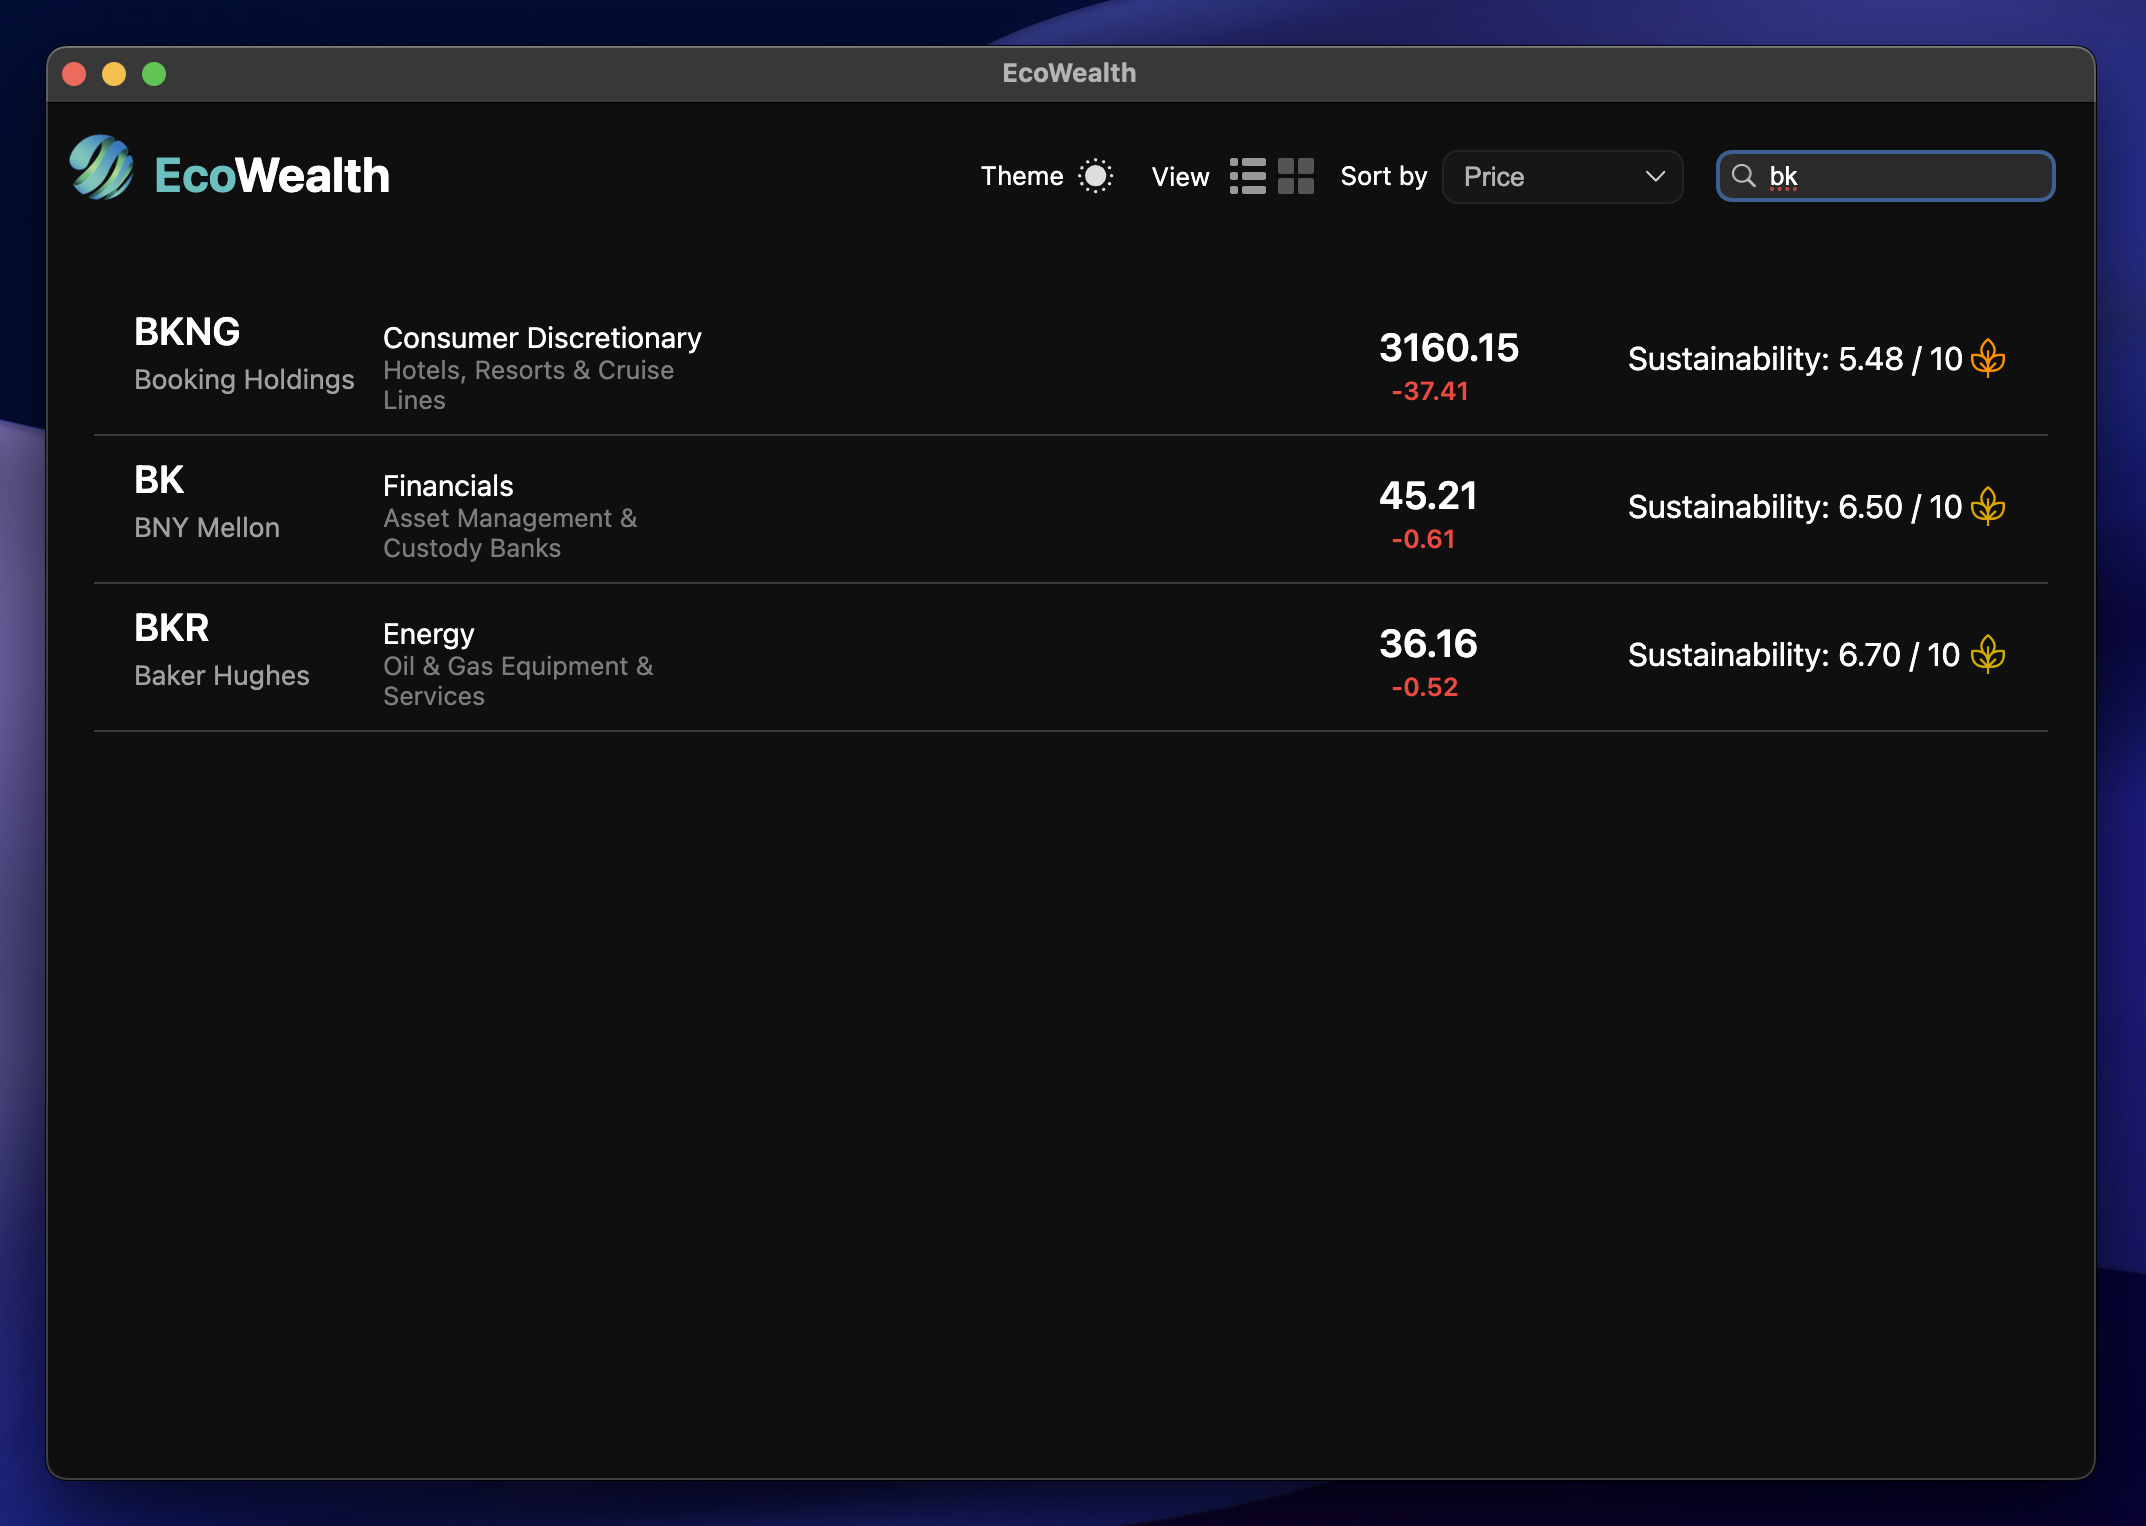
Filter through all the different S&P500 companies to view their sustainability and stock
-
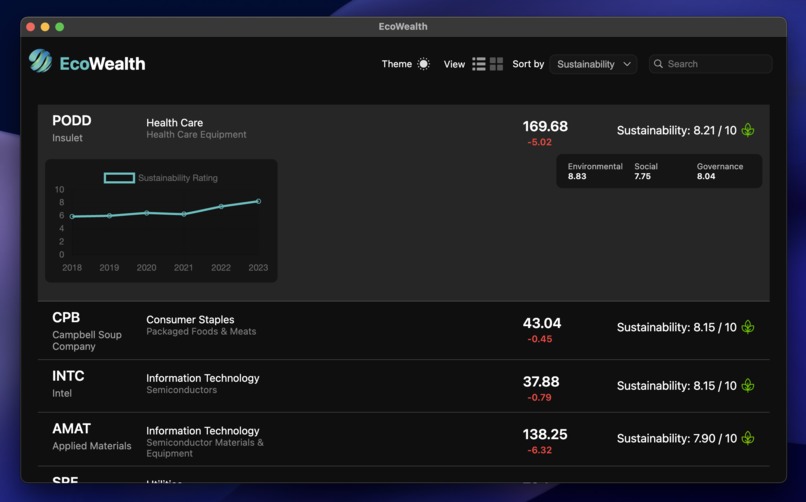
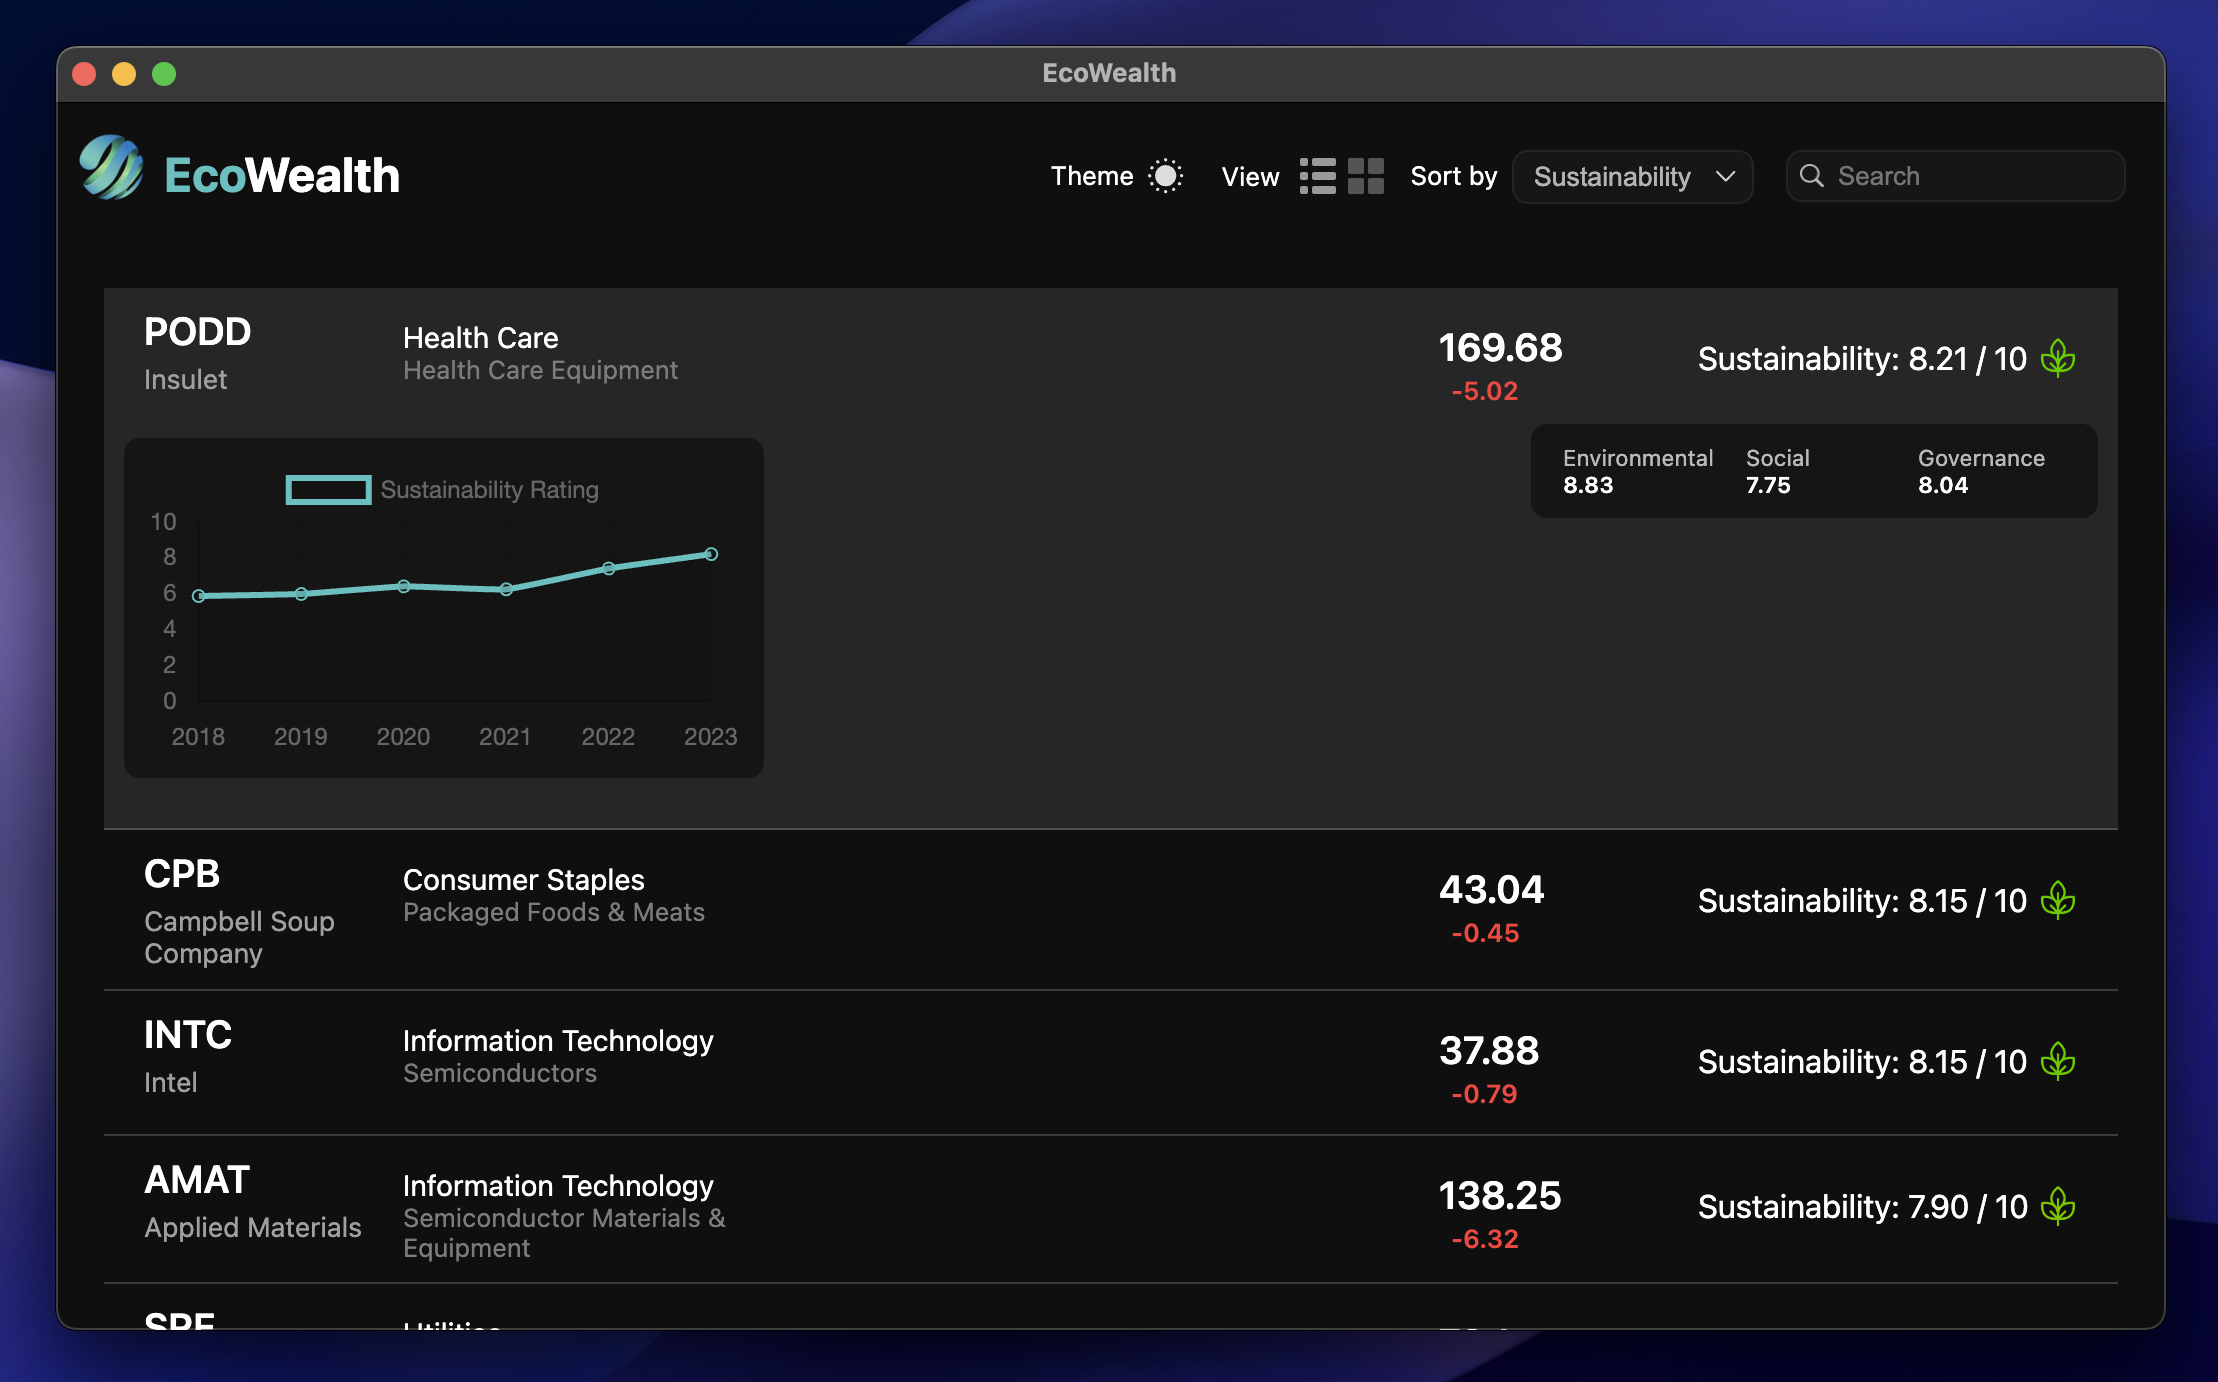
Expand a stock to see history and more detailed data about its sustainability
-
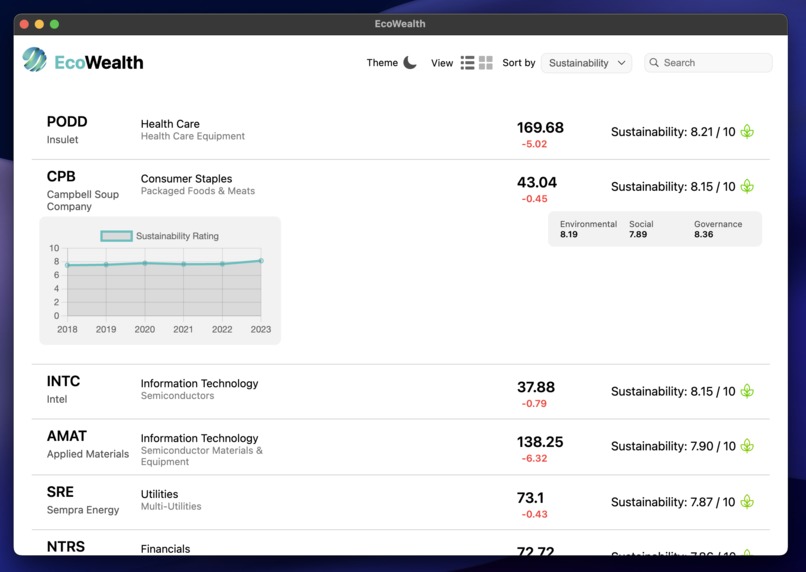
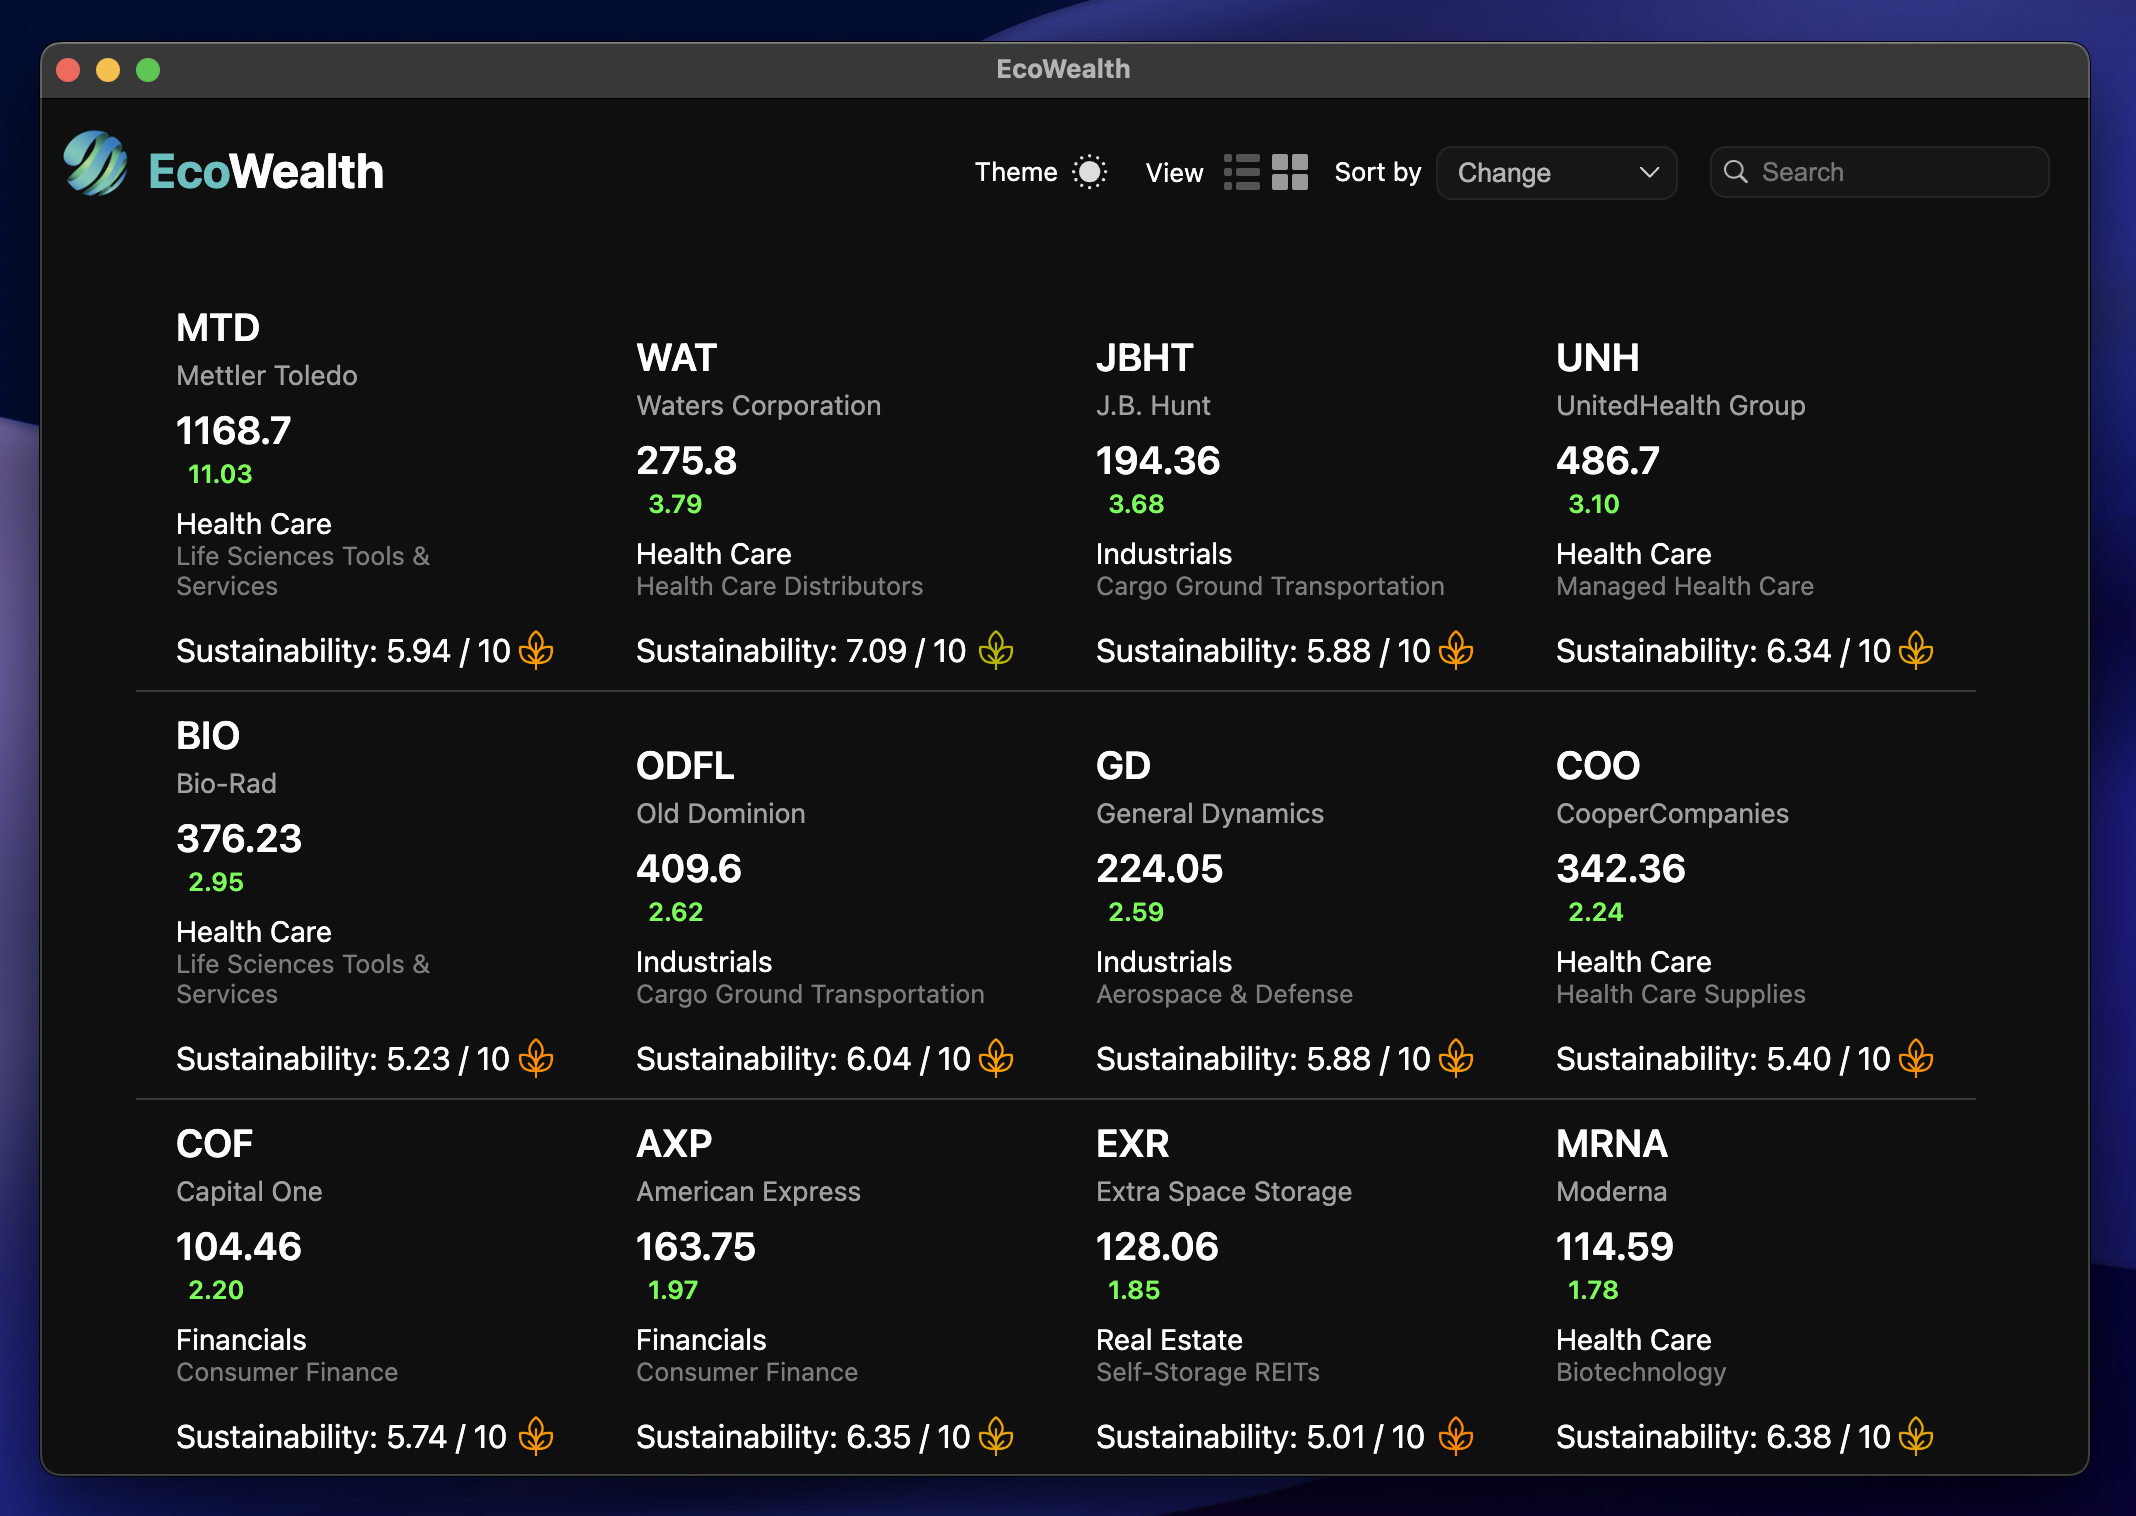
Also comes in light-theme for anyone who wants a brighter look
-
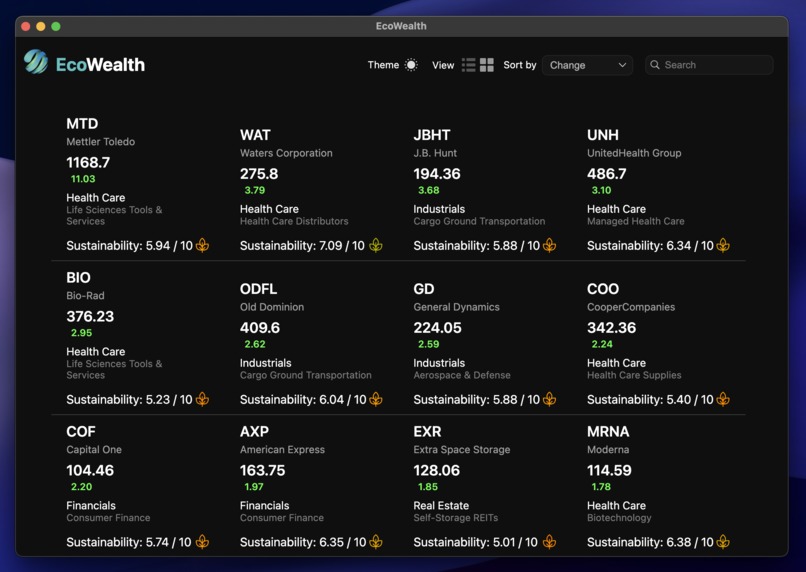
See even more stocks at once with the more compact grid-view
Inspiration
We drew inspiration from already existing platforms and metrics related to the S&P500. Examples of said platforms include the Apple Stocks app, Robinhood, TradingView, YahooFinance, etc. The metrics we focused on were the ESG score (Environmental, social, and governance) and using the individual subsets of the overall ESG score. In doing so we had flexibility to draw upon data points from different sources and come to our own weighted average.
What it does
The platform enables users with the ability to view which companies are most sustainable via a sustainability score in comparison to others. The user may filter or search for a specific stock of interest if need be. Once a user is ready to dive deeper into a stock, they may expand the stock card UI and view the information section, where they are presented with the stock price graph and a sustainability graph. They may also dive deeper into how we have rated said stock with the ESG metric and how other companies have benchmarked the stock, providing deeper insight. They will also have the option to view the top articles, empowering the user to explore the news of the stock, as an extra resource to decide whether or not the stock is a good choice for them.
How we built it
We built this platform using HTML, CSS, node.js, Javascript, along with a couple APIs such as FinancialModelPrep API and Yahoo Finance API. Calling said APIs allowed us to easily access the stock data and charts, to be able to calculate our own averages and display the necessary information for the user. The approach was to have a seamless, optimal, and empowering experience where users have a new and unique lens to look into when viewing a stock.
Challenges we ran into
Quantifying non-numerical data. With the limited amount of time, going through 500 of the top companies financial reports and news would have been ineffective.
Accomplishments that we're proud of
We are proud to have been able to complete as much as we could while have a fairly clean front-end design with the short amount of time we had on hand. Being able to retrieve data from the APIs and understanding them is something to be proud of as well.
What we learned
We learned that through effective and organized teamwork, a lot of great things can be accomplished. Despite the short window of time, being able to time manage and not serve ourselves with too big of a task, was something we learned fairly quickly.
What's next for EcoWealth
Hopefully we imagine to implement more features to EcoWealth to continue the seamless experience, looking to personalize the experience for various users, allowing them the ability to have top stock picks. Ideally, we would also like to display more useful data and metrics that would drive decisions for investment teams and individuals, at any level.
Our First Hackathon submission & Schonfeld submission
Built With
- chartjs
- css
- electron
- html
- javascript
- node.js
- yahoo-finance


Log in or sign up for Devpost to join the conversation.