-
-

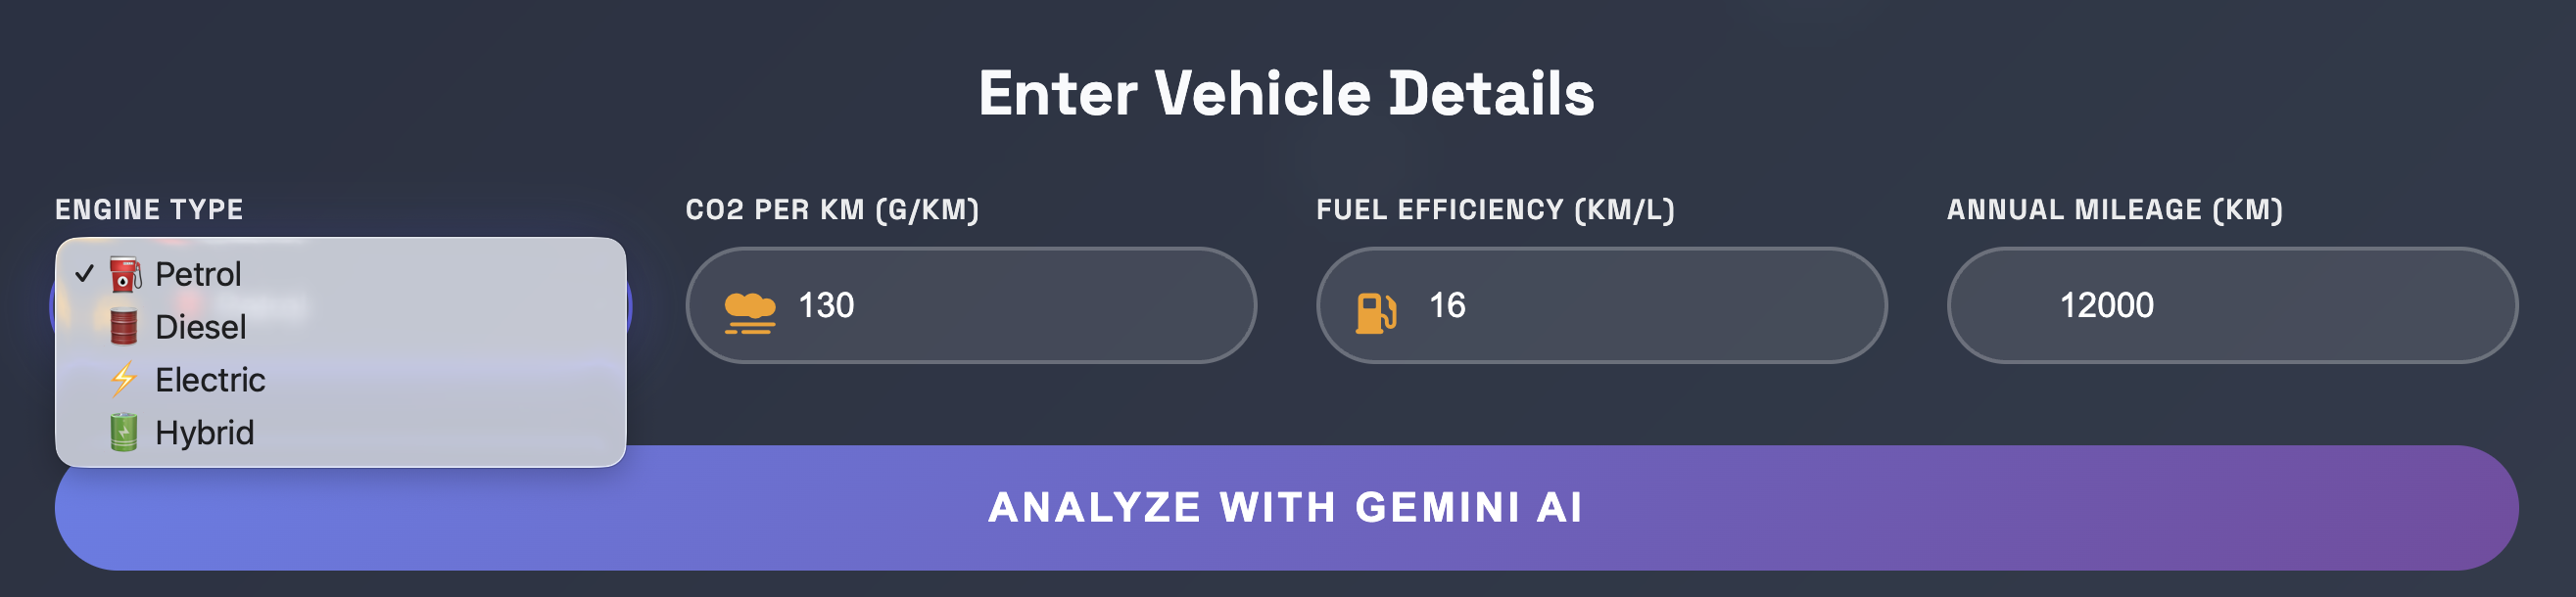
This is how an user input's the vehicle's informations to analyze
-
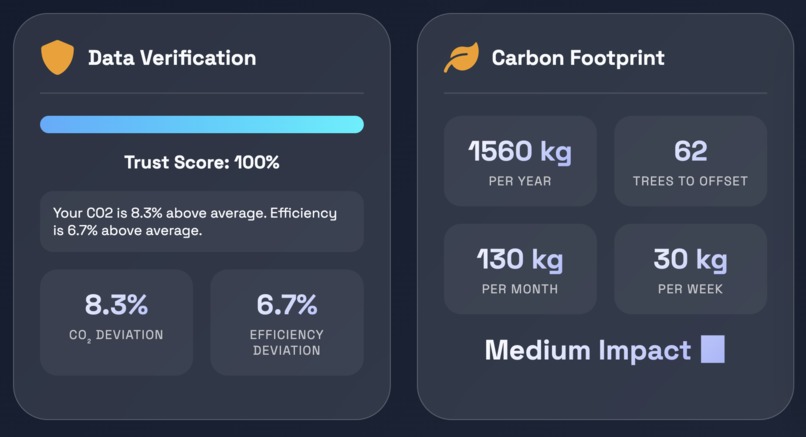
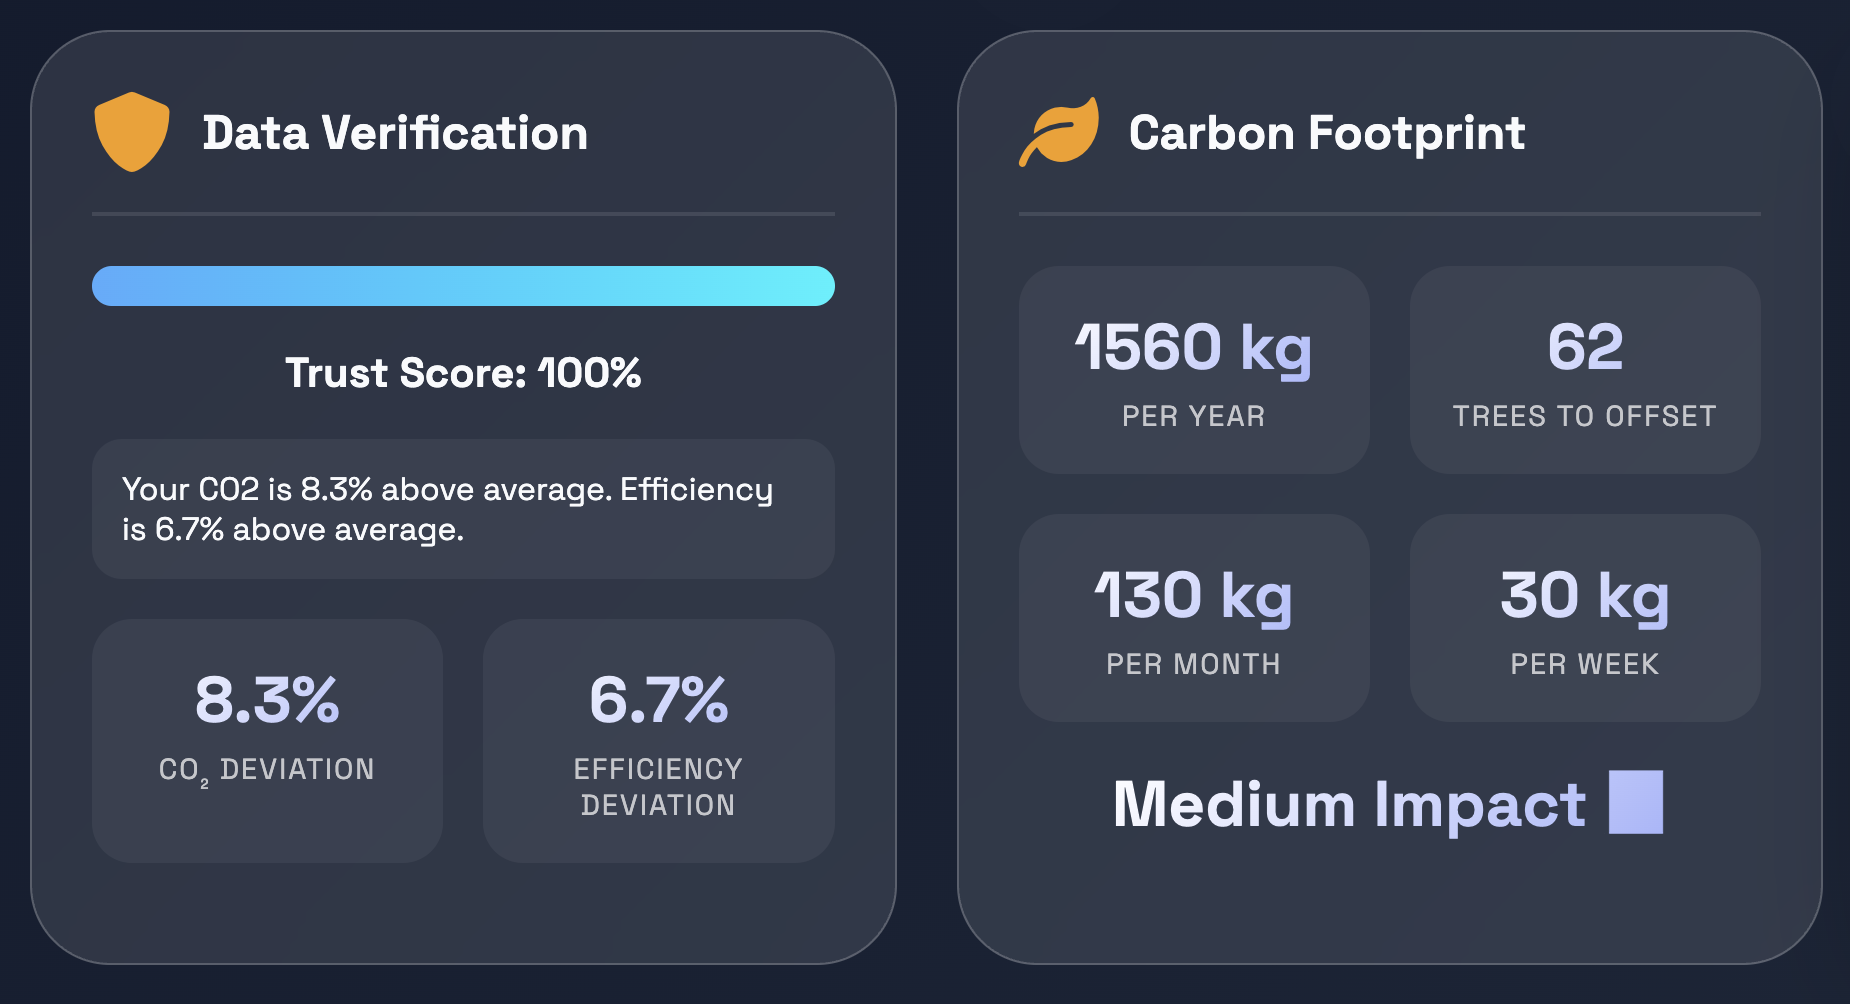
This is how Gemini AI is used to give the solution
Inspiration
The gap between fuel cost discussions (which every Indian family has) and carbon emissions (which nobody discusses). We realized: if people could SEE their environmental impact in ₹ they save/spend, they'd actually care and act.
What it does
Verifies vehicle data with Trust Score (0-100%) Calculates carbon footprint + trees needed Shows fuel costs in ₹ (annual/monthly/weekly/per km) Simulates 5 "what-if" scenarios Provides Gemini AI insights in English/Hindi Visualizes with interactive 3D charts
How we built it
Frontend: HTML/CSS/JS + Plotly.js + Glass morphism UI Backend: Python Flask REST API AI: Google Gemini 2.0 Flash (new genai package) Charts: Plotly for interactive visualizations Languages: Full bilingual support (English/Hindi)
Challenges we ran into
Gemini API Deprecation: Had to migrate from google.generativeai to new google.genai package mid-development Bilingual Implementation: Making Hindi translations fit UI without breaking design Real-time Chart Updates: Ensuring Plotly renders correctly with dynamic data Indian Number Format: Implementing lakhs/crores formatting properly
Accomplishments that we're proud of:
First digital twin with Gemini AI integration at VIT Full bilingual support with real-time switching Trust Score algorithm that actually catches anomalies 5 scenario simulations with accurate ₹ savings Glass morphism UI that looks professional Working with 2026 Indian fuel prices (₹105/litre)
What we learned
Google's new genai package is faster than the old one Indians respond 10x better to ₹ savings than CO2 numbers Real-time language switching requires careful state management Plotly + Flask is a powerful combo for hackathons Always test with real user data (not just ideal scenarios)
What's next for EcoTwin AI
Mobile App: React Native version for on-the-go access Fleet Management: Dashboard for companies with multiple vehicles Government Integration: API for RTO to verify claims

Log in or sign up for Devpost to join the conversation.