-
-
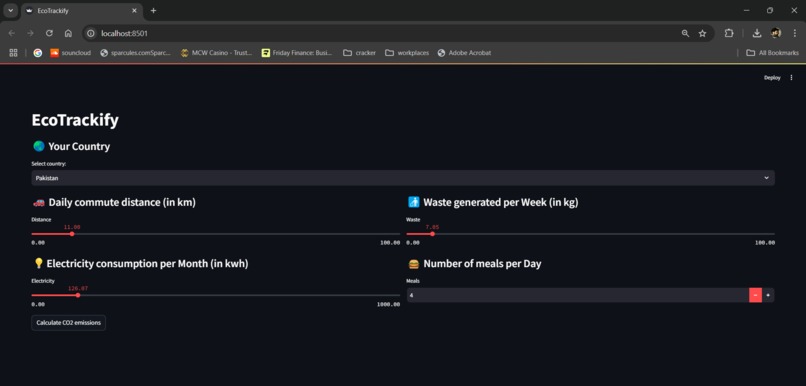
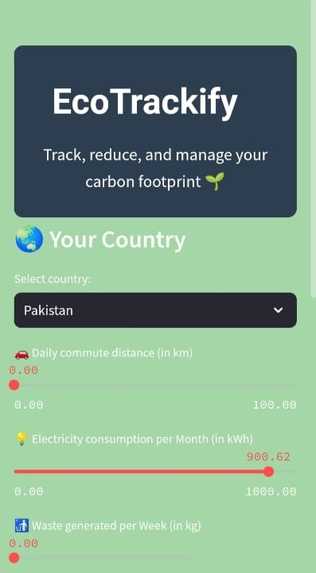
Home Page
-
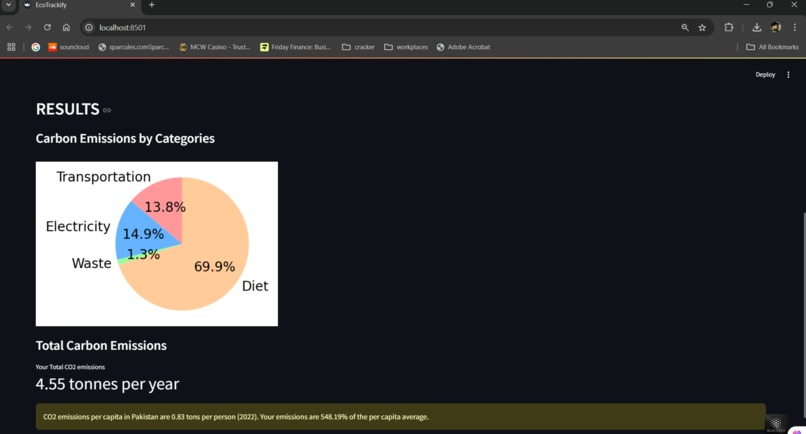
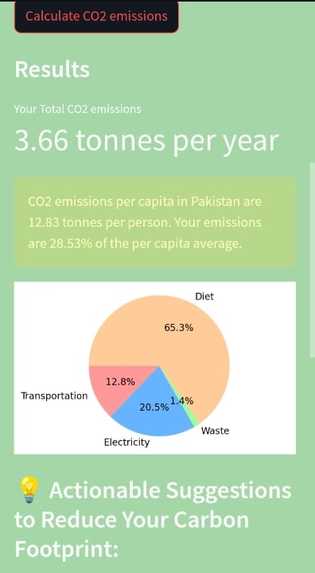
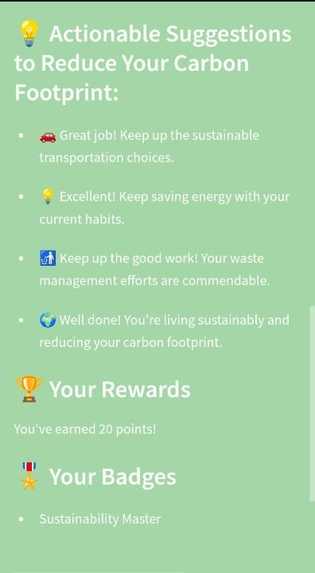
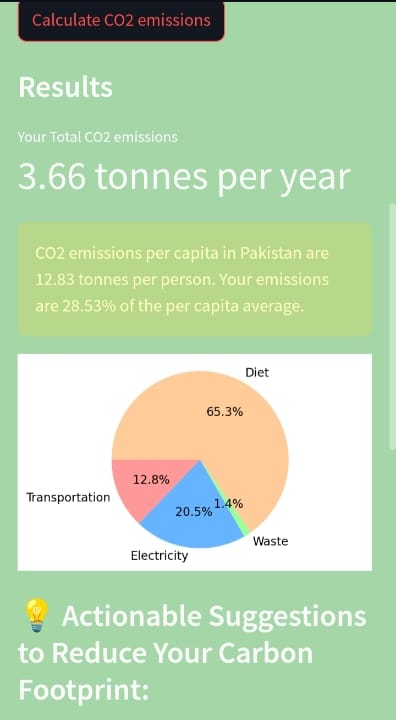
Result Section
-
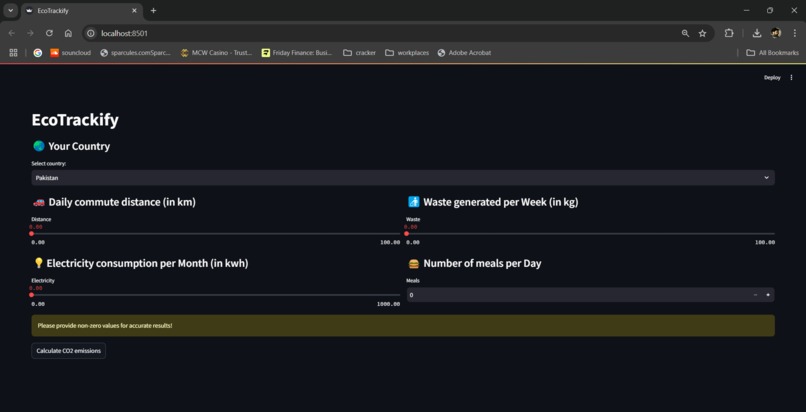
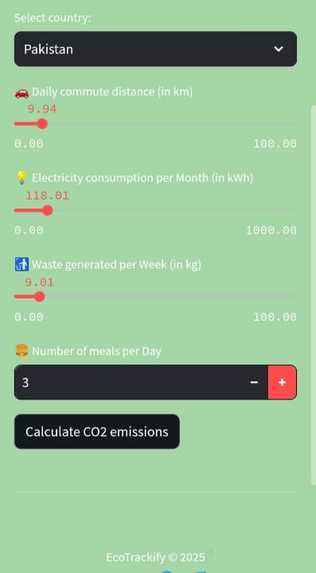
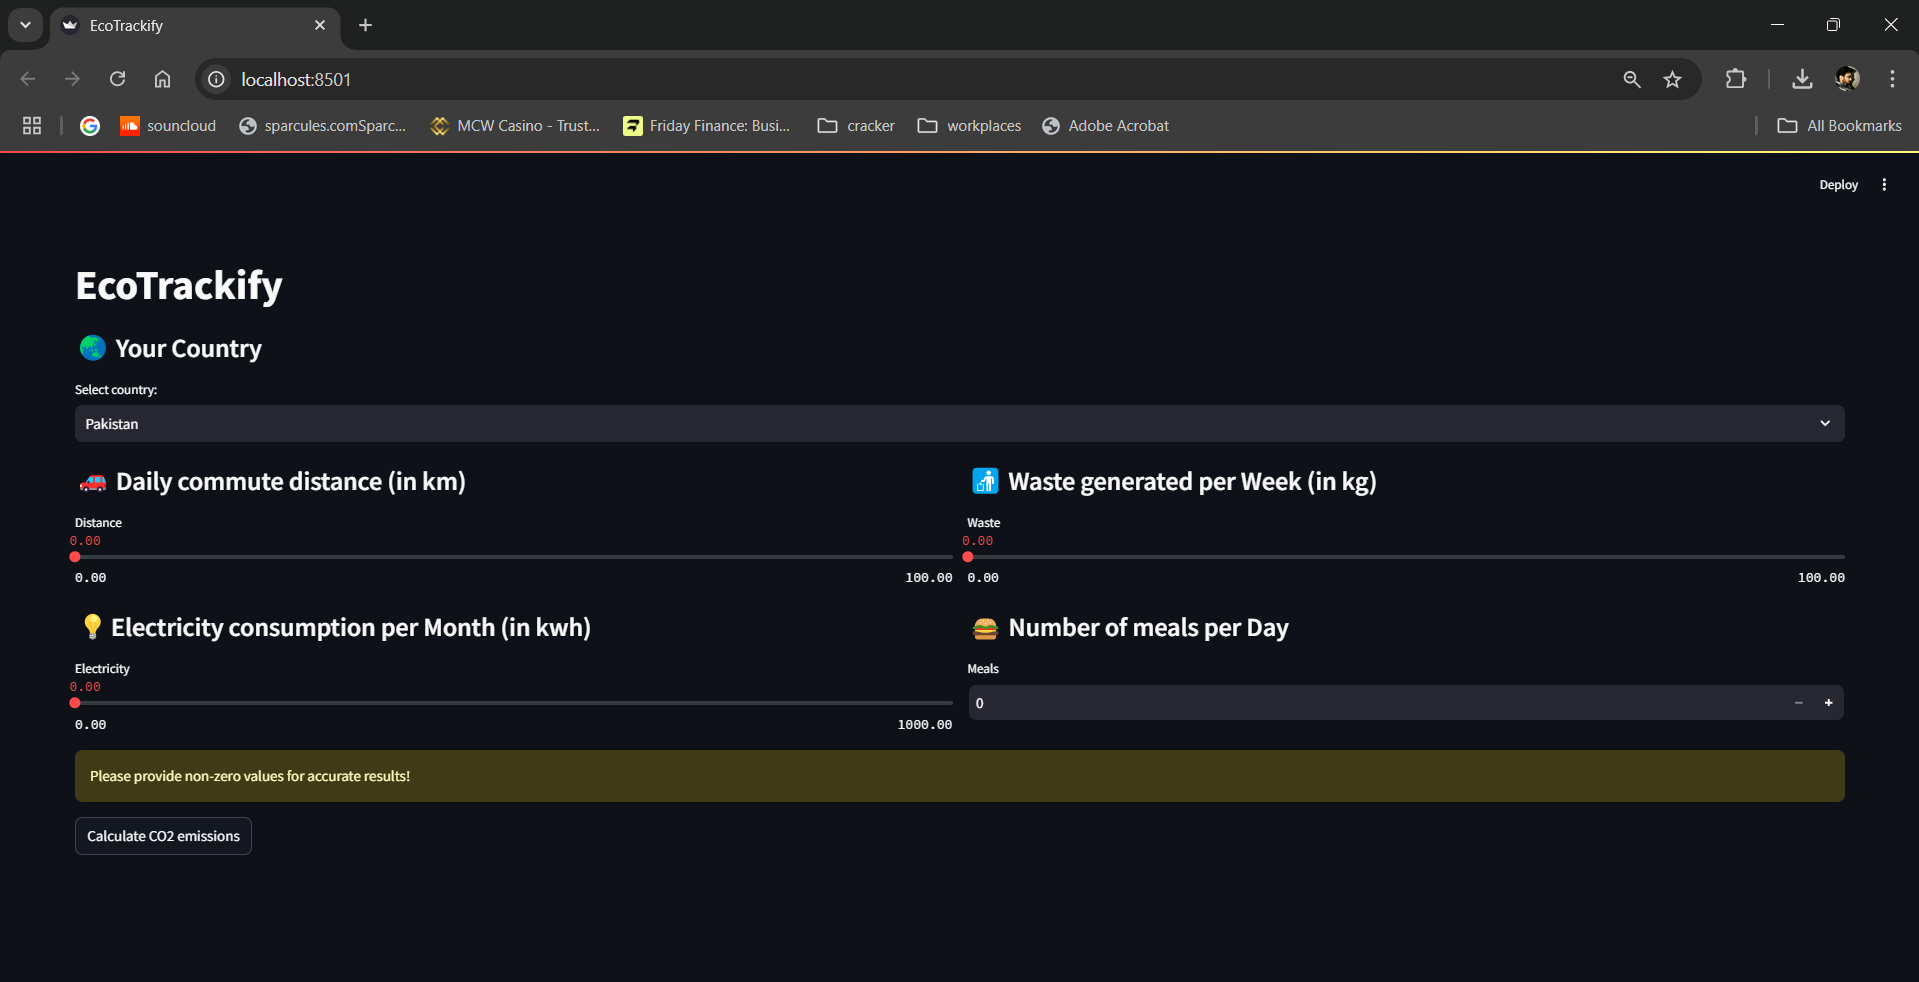
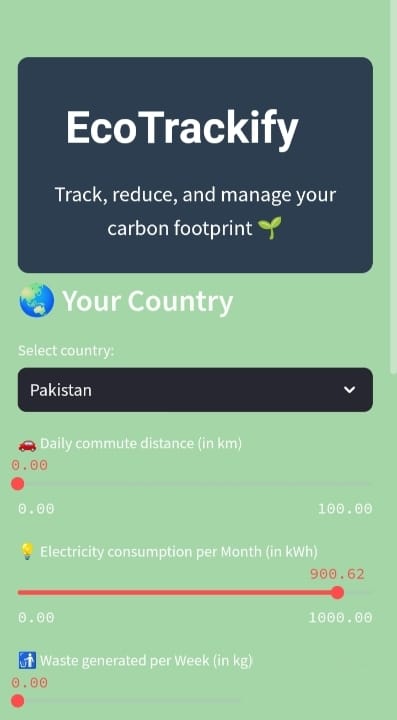
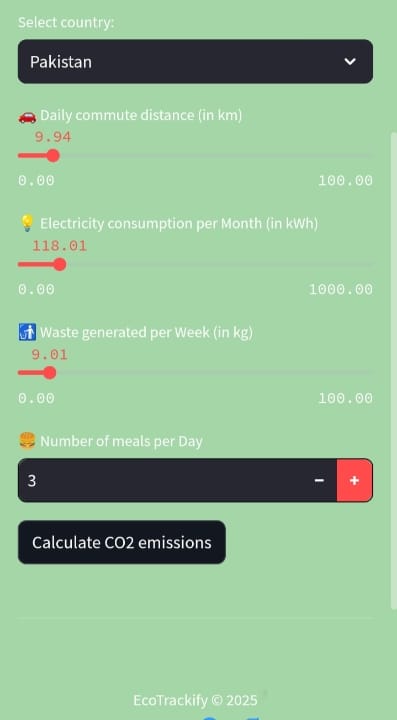
Input Section
-
-
-
-


What Inspired Me
The increasing impact of climate change and the urgent need for sustainable practices inspired me to create EcoTrackify. I wanted to build a tool that bridges the gap between awareness and action, allowing individuals to see how their daily habits contribute to carbon emissions. The goal was to inspire change through data-driven insights.
Concerning the project.
EcoTrackify is a personal carbon tracker that helps users measure and decrease their carbon footprint. The initiative focuses on major sources of emissions, including garbage, power, transportation, and food. EcoTrackify helps individuals develop sustainable lives by offering visual insights and practical solutions.
How we built it
Research and Data Collection I looked at emission characteristics specific to Pakistan, such as transportation, power, gastronomy, and waste metrics.
Development The project was built using Python and Streamlit for the frontend. The important features are:
Sliders and input forms to capture user data Backend computations to translate user input into annual carbon emissions. A pie chart visualization created with Matplotlib to display a clear breakdown of emissions by category. Metrics and notifications to compare user emissions with national averages. Design The UI was designed to be simple and user-friendly, encouraging individuals to interact and discover their influence.
Challenges we ran into
1- Data Availability: Determining accurate, region-specific emission variables proved challenging and required further inquiry. 2- User Engagement: Developing an intuitive interface that makes tracking carbon emissions exciting was a challenging task. 3- Virtualization: Iteration was required to develop effective and appealing representations that accurately reflected complex facts. 4- Validation: Ensuring that the app's outputs are accurate and consistent necessitated rigorous testing and tuning.
Accomplishments that we're proud of
1- Empowering people with data-driven insights: Successfully created an accessible application that allows users to monitor and understand their carbon footprint, fostering awareness and real change.
2- A smooth user experience: Using Streamlit, we designed a simple and user-friendly interface that allows users to enter data and view results.
3- Effective Data Visualization: Dynamic pie charts and metrics were used to present sophisticated data in an accessible and visually appealing manner.
4- Localized Emission Factors: The program now adds Pakistan-specific emission factors, which ensures accuracy and relevance for local users.
5- Educational Impact: Users had a clear image of their environmental impact by comparing their emissions to national guidelines.
6- Adaptability to expansion: The program was created in a modular structure, making it simple to add other nations, emission factors, or features in the future.
What we learned
i- Carbon emission factors and regional variations. ii- Streamlit is a for creating interactive applications. iii- Effective data visualization techniques for presenting concepts succinctly. iv- Challenges of behavioral change in
What's next for EcoTrackify
1- Increase country support. Add emission factors for additional countries to make the software accessible to a global audience and attract a diverse user base.
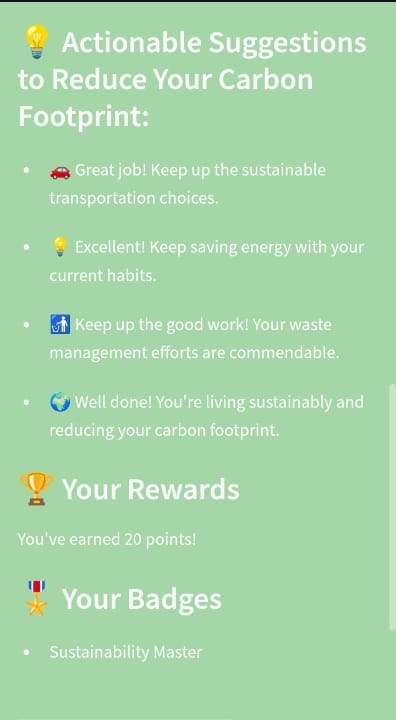
2- Personal suggestions. Introduce actionable insights and suggestions based on unique user data, allowing them to make more educated decisions to reduce their carbon footprint.
3- Carbon Offset Integration: Users may donate directly to environmental causes through the app thanks to its integration with carbon offset schemes.
4- Gamification Features: Gamification is using badges, challenges, and prizes to promote sustainable habits in a fun and engaging way.
5- Mobile App Development: Create mobile apps for iOS and Android to make EcoTrackify more portable and user-friendly.
Built With
- matplotlib
- python
- streamlit
- streamlitcloud


Log in or sign up for Devpost to join the conversation.