-
-
Landing Page
-

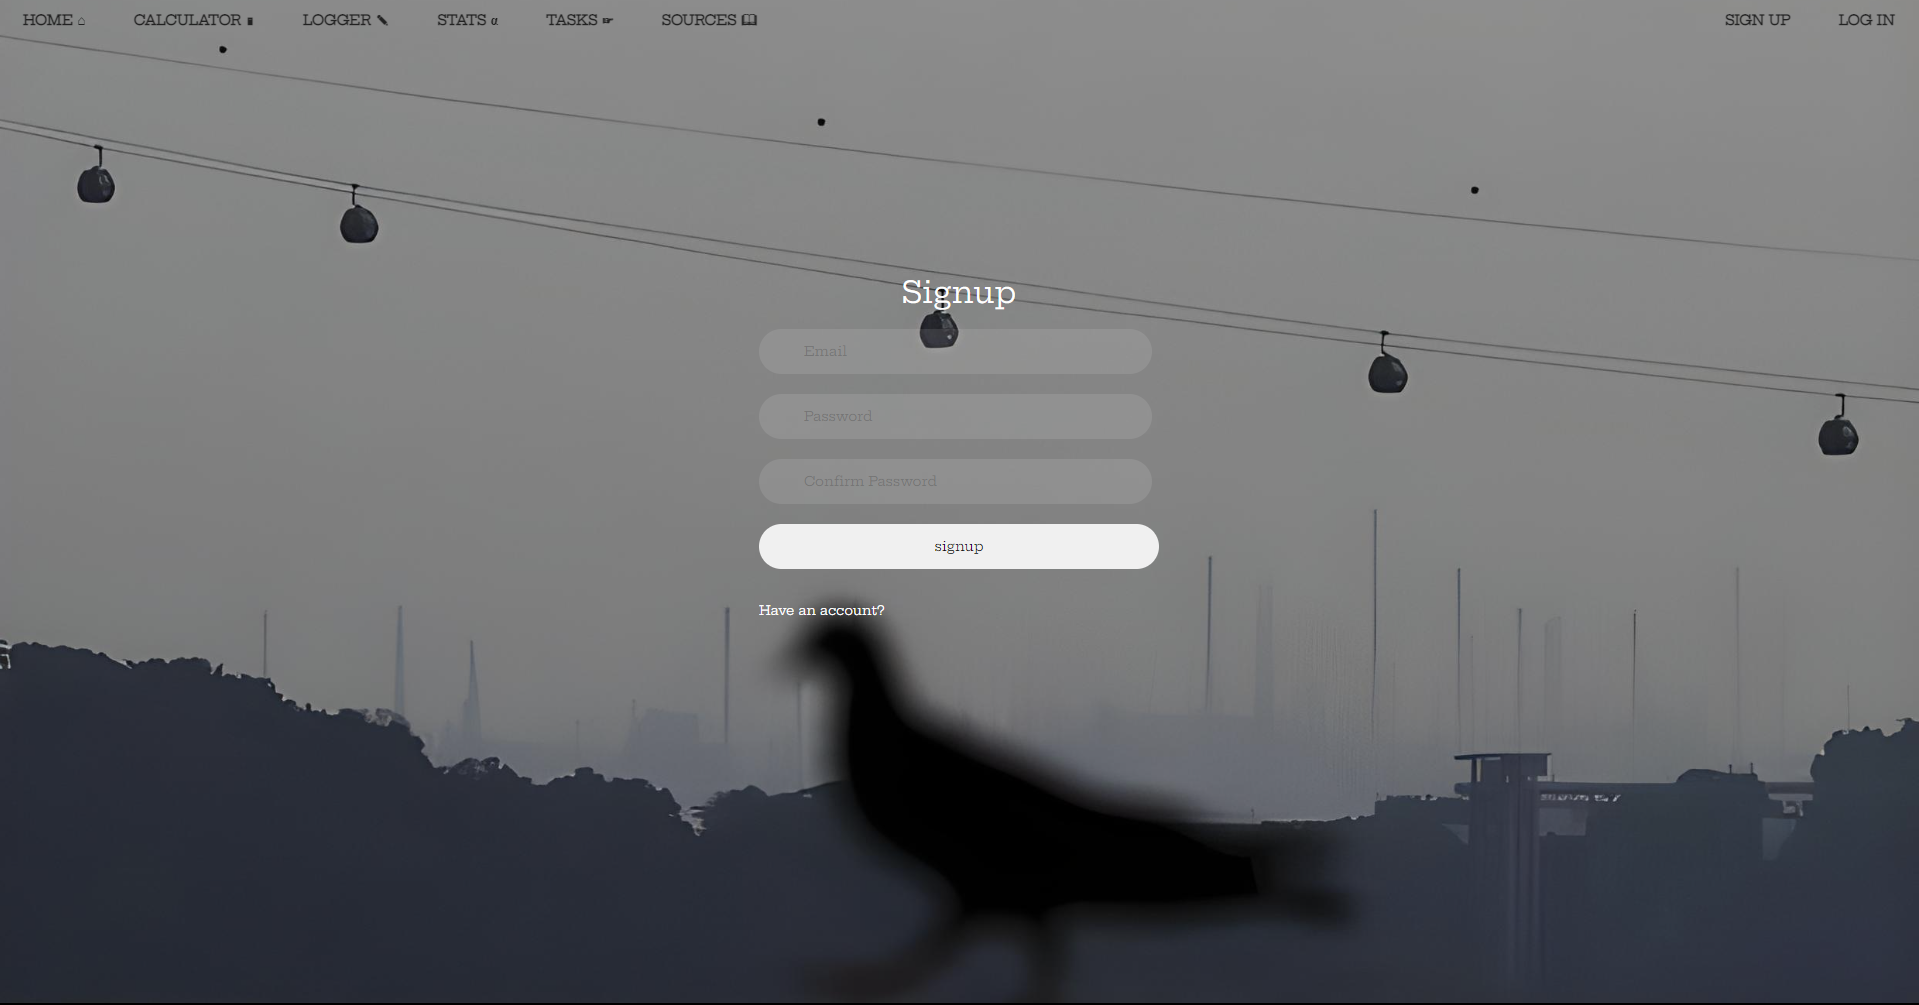
Signup
-
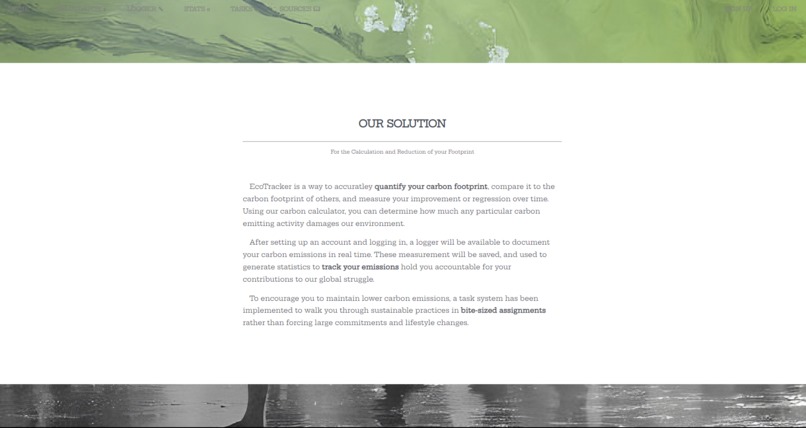
Our Solution
-
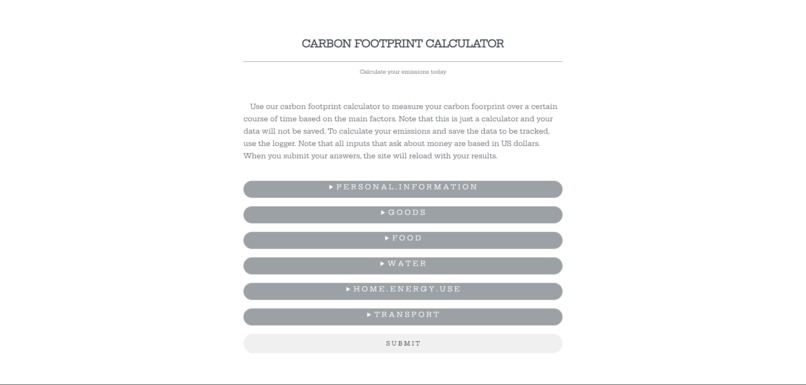
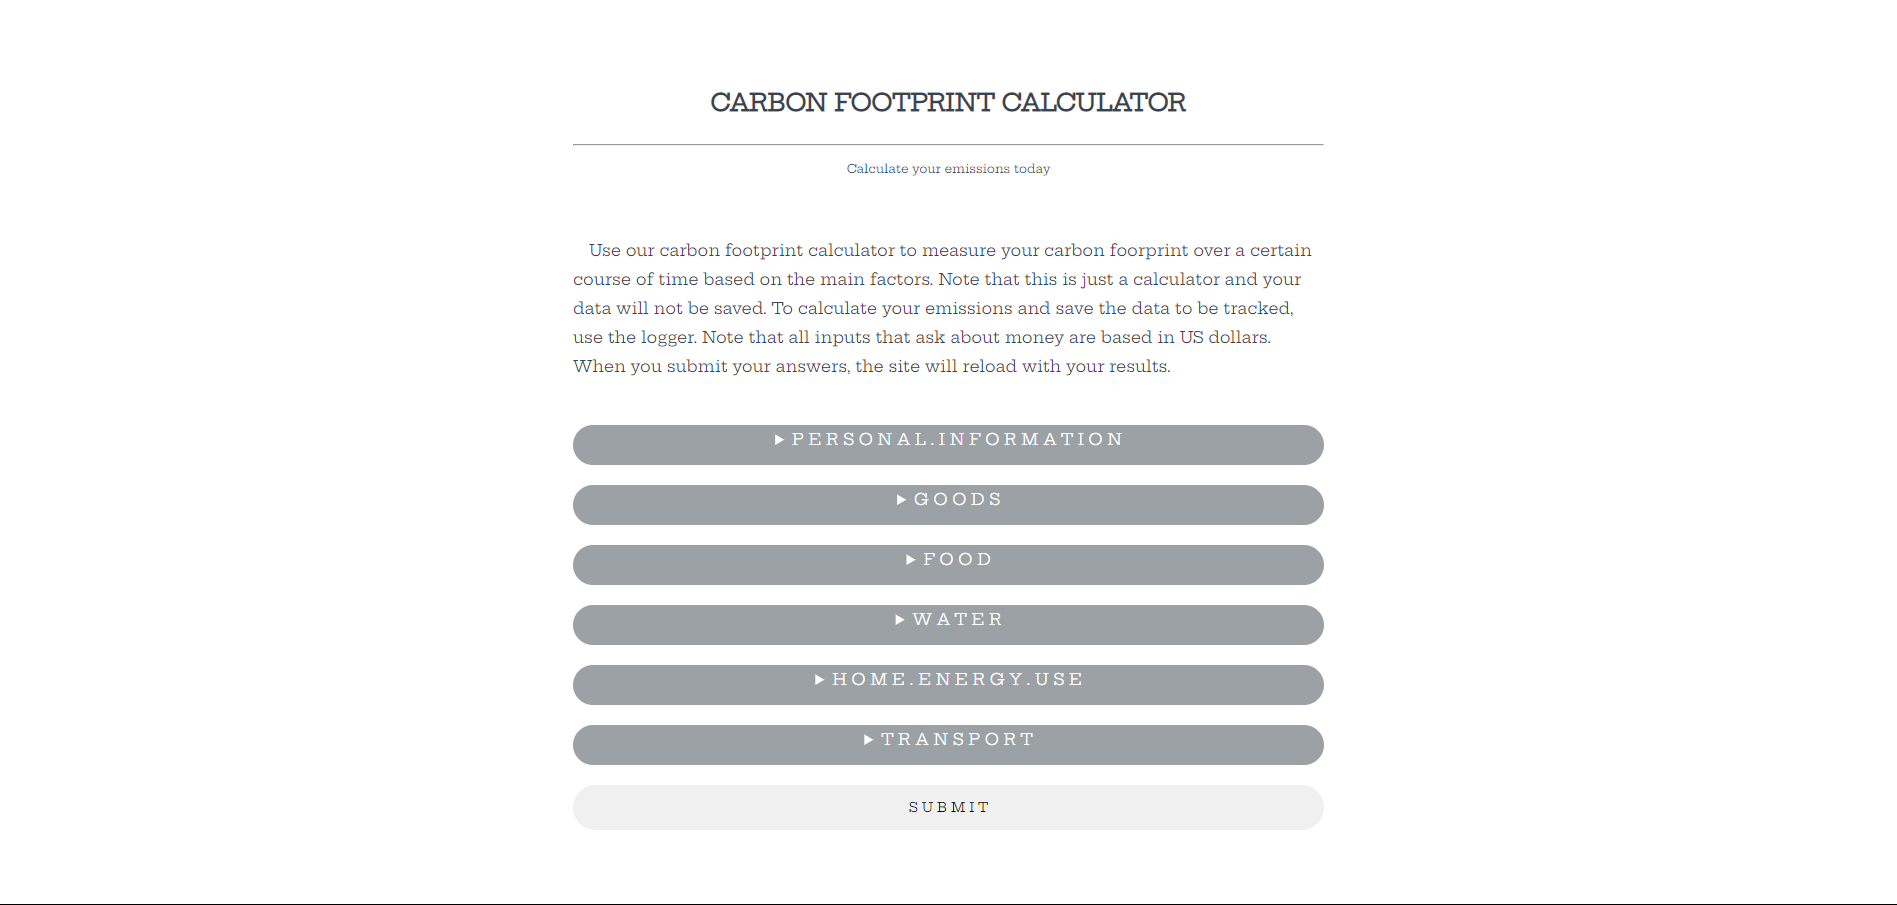
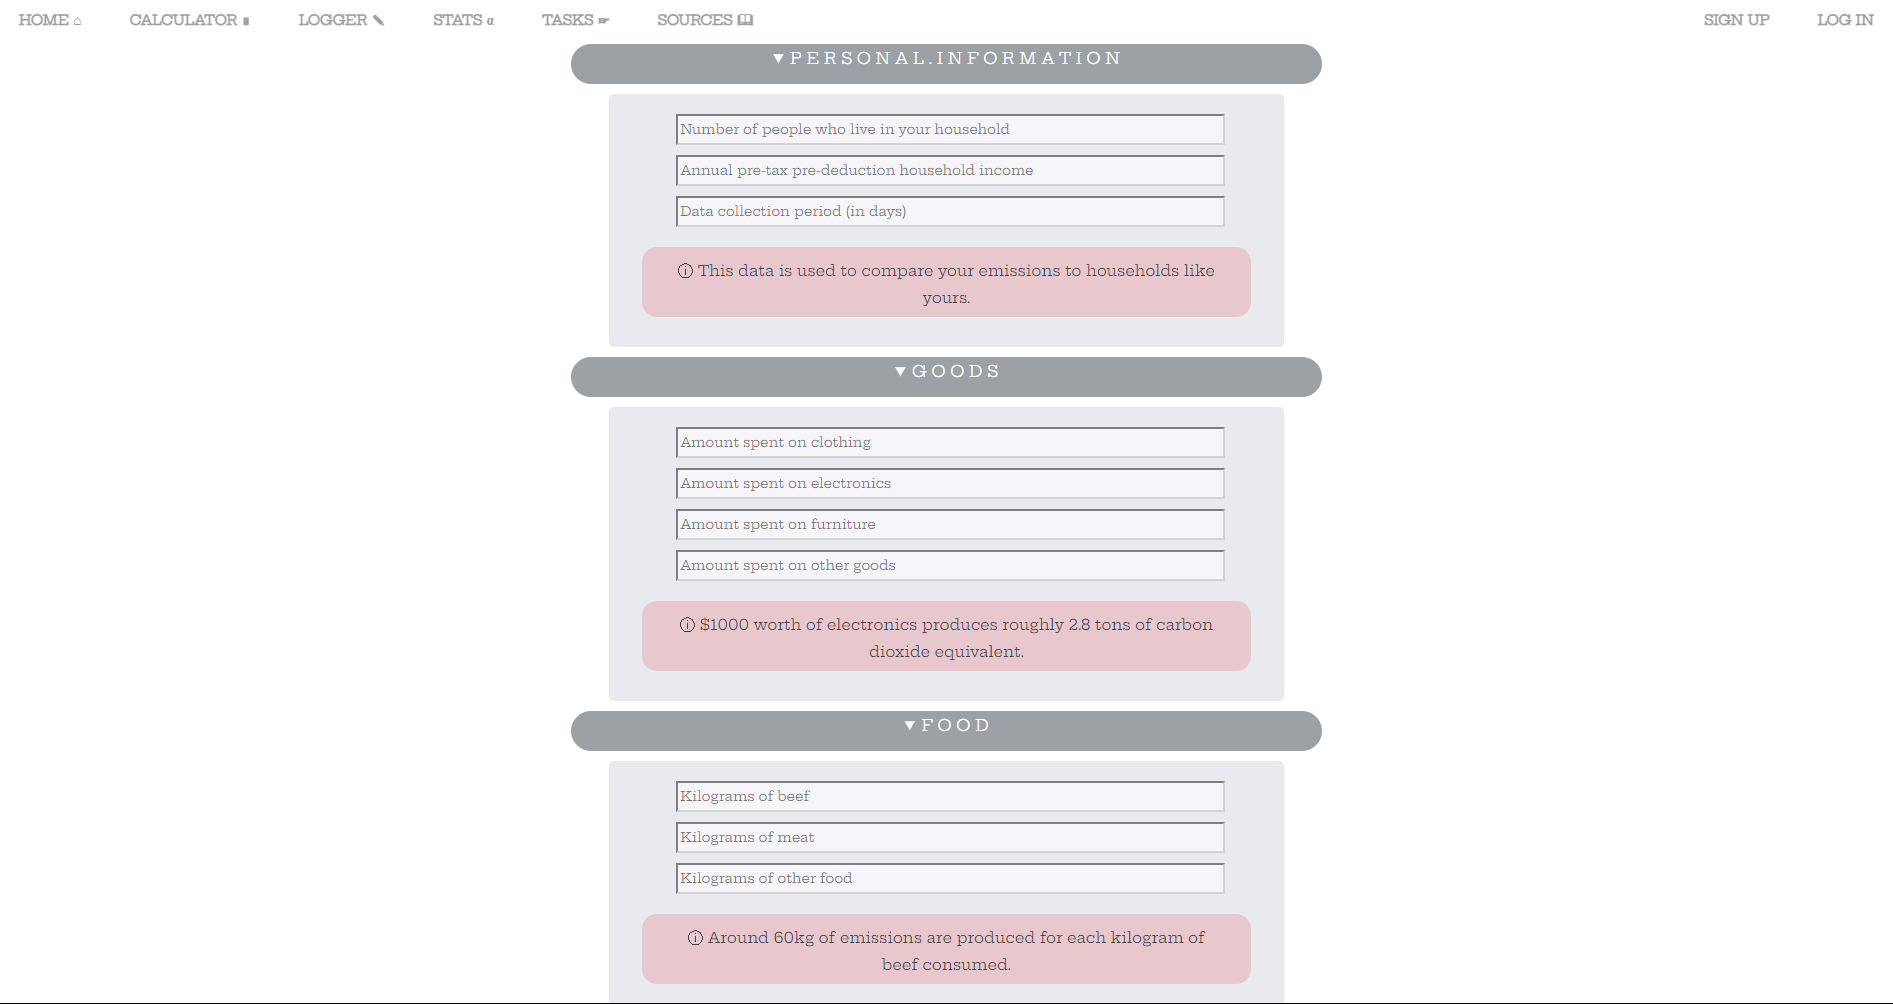
Footprint Calculator
-
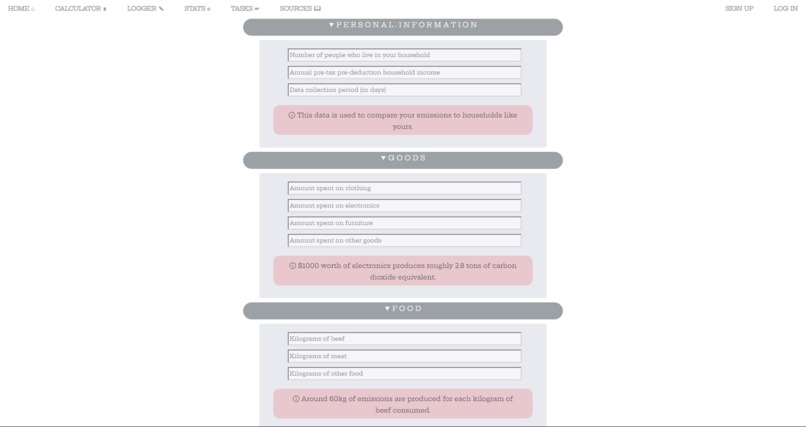
Footprint Calculator
-
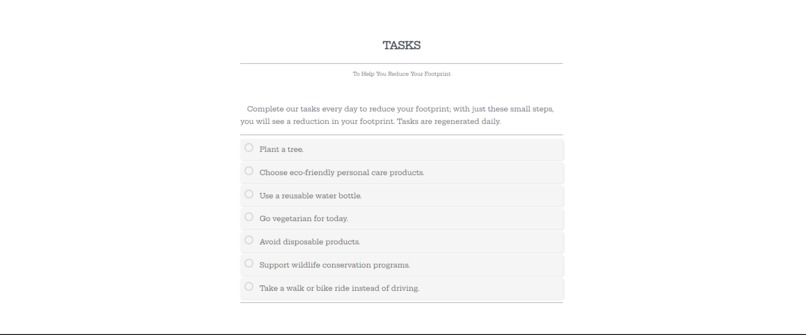
Tasks
-

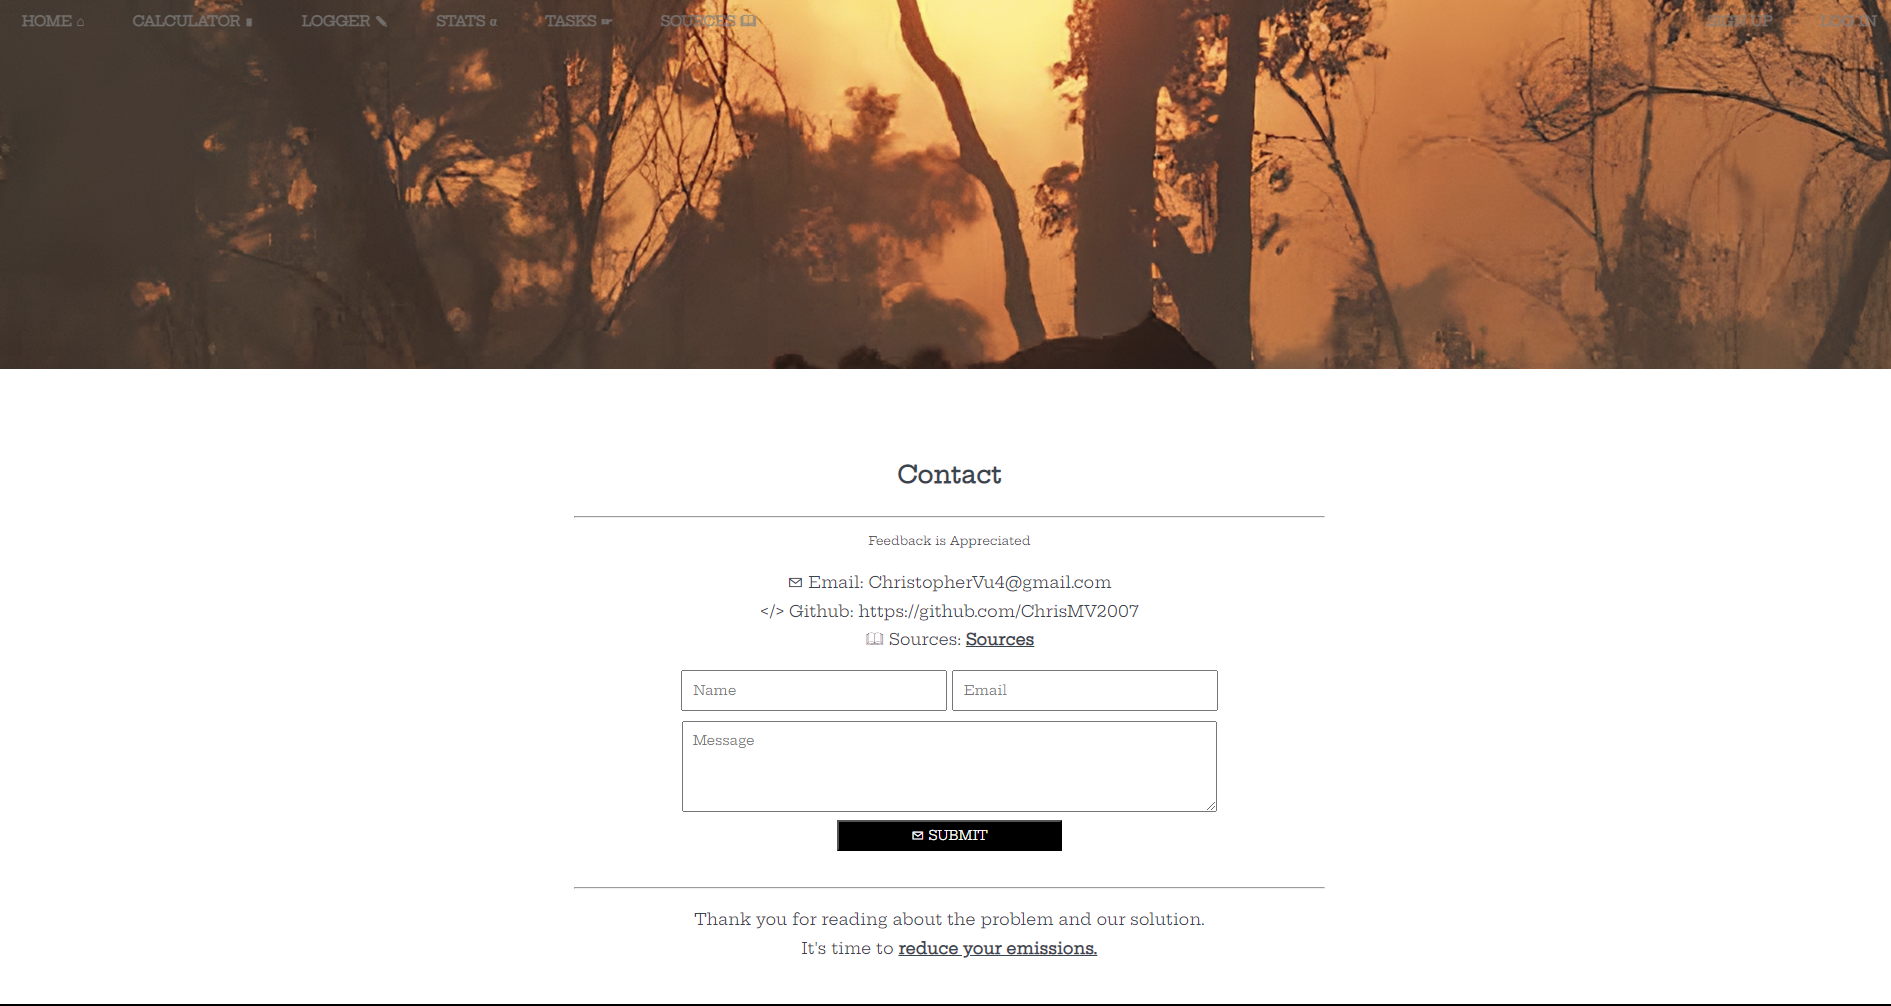
Contact
-
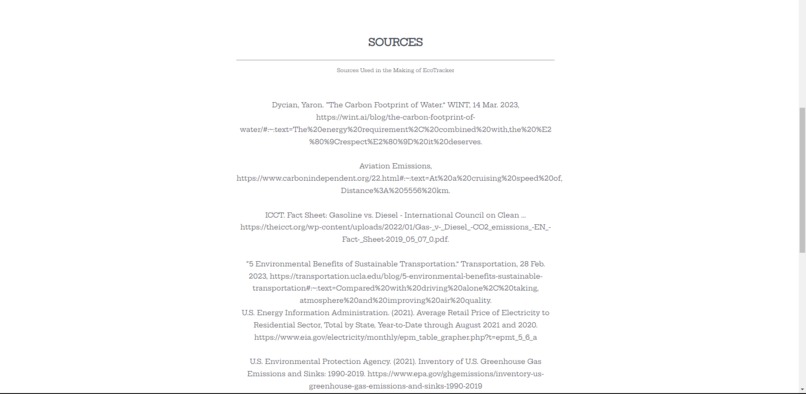
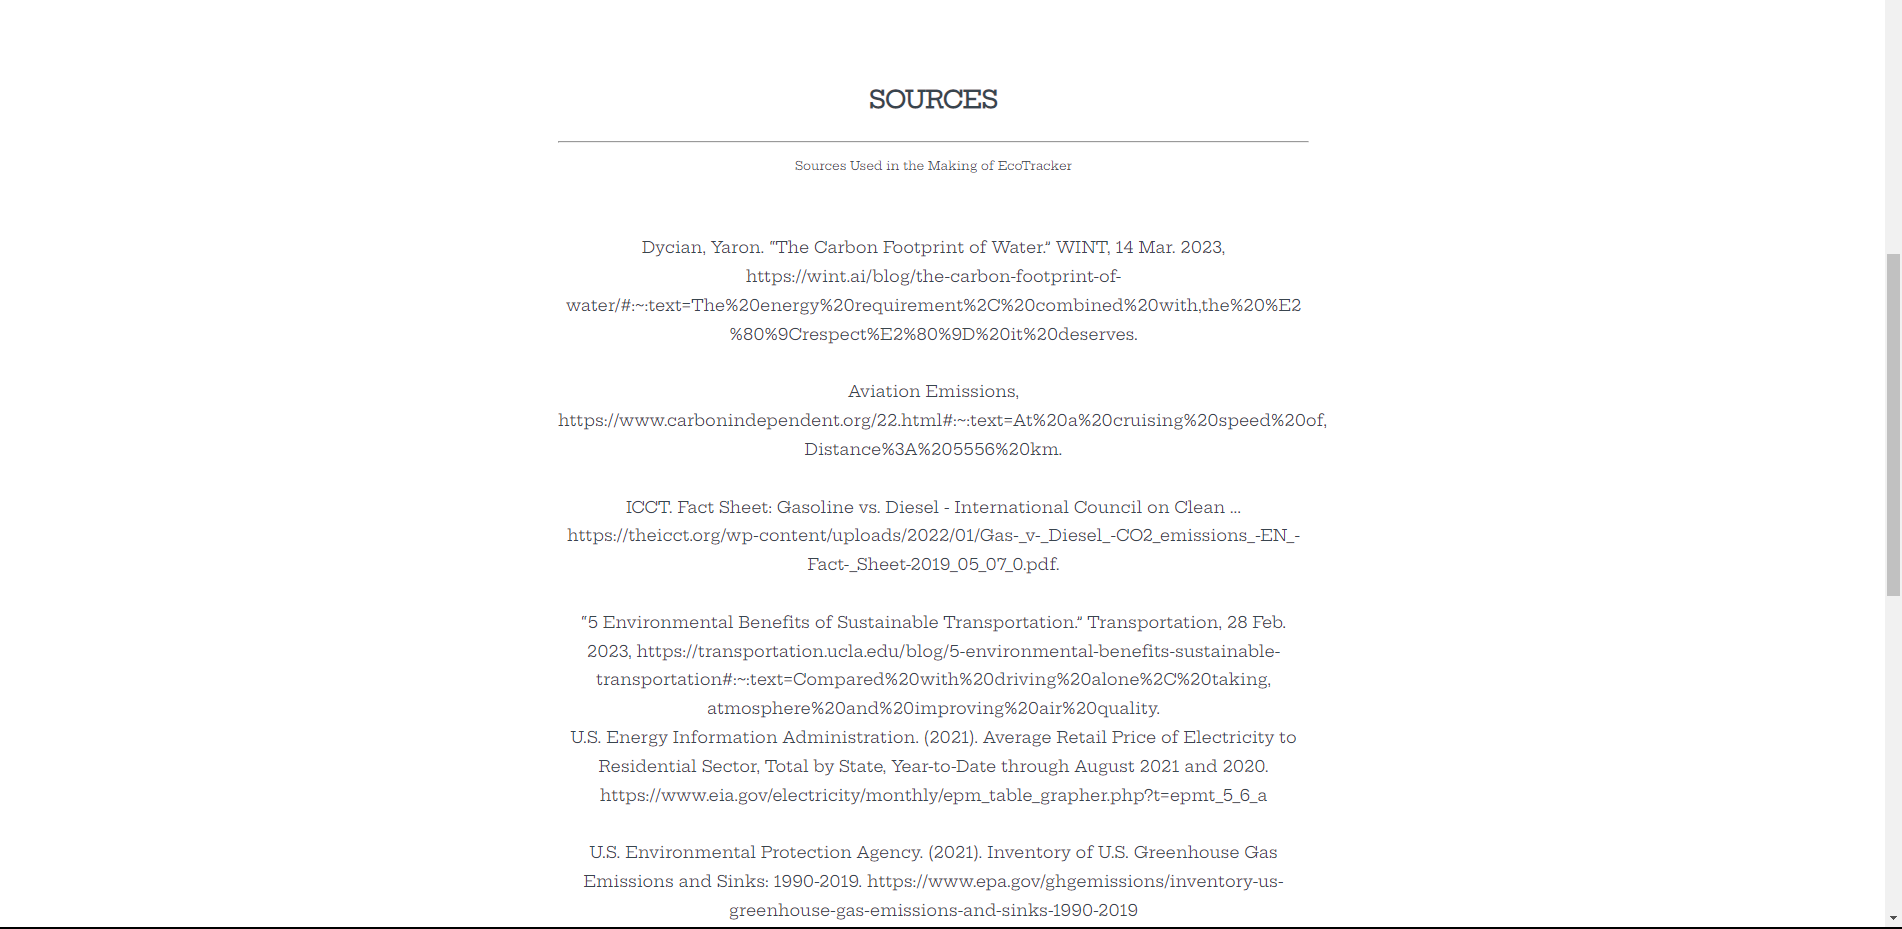
Sources


Inspiration
Climate change has always been a big issue we wanted to fight, so a carbon calculator was a very fitting project idea. This project pertains to the 13th goal of the UN; climate action.
What it does
EcoTracker is a way to accurately quantify your carbon footprint, compare it to the carbon footprint of others, and measure your improvement or regression over time. Using our carbon calculator, you can determine how much any particular carbon-emitting activity damages our environment.
After setting up an account and logging in, a logger will be available to document your carbon emissions in real-time. These measurements will be saved, and used to generate statistics to track your emissions and hold you accountable for your contributions to our global struggle.
To encourage you to maintain lower carbon emissions, a task system has been implemented to walk you through sustainable practices in bite-sized assignments rather than forcing large commitments and lifestyle changes.
How we built it
The app was built with Flask, python, html5, css3, and sqlite3. The SQLite database holds user data on carbon emissions and handles login/logout/signup. The Python scripts perform calculations for the carbon footprint. Flask manages redirects and receives form inputs to be given to the Python scripts.
Challenges we ran into
Figuring out how to manage data and sending it from the html page to Python scripts was a big struggle for us; we are used to text-based Python scripts, so this was a step outside of our comfort zone. Working with SQLite was also a big challenge; we usually work with pandas for data storage, so using a database was a new experience. The login system was a great struggle, as we struggled to trying to manipulate and fetch data from the database through a Python script and send that information back to the front end.
Accomplishments that we're proud of
We are very proud of the web design, as well as the login system. Getting the SQL files to work was a big accomplishment.
What we learned
We learned how to work with Flask and SQLite, and how to make a front end and back end cooperate.
What's next for EcoTracker
We would like to program more visually appealing statistics, such as bar or line graphs. We would also like to create some kind of script to identify problem areas and specify tasks to those problem areas.

Log in or sign up for Devpost to join the conversation.